
|
|||||
|
 | |
| |
| |
| |
| |
| |
|
Gene: BATF |
Gene summary for BATF |
| Gene information | Species | Human | Gene symbol | BATF | Gene ID | 10538 |
| Gene name | basic leucine zipper ATF-like transcription factor | |
| Gene Alias | B-ATF | |
| Cytomap | 14q24.3 | |
| Gene Type | protein-coding | GO ID | GO:0001562 | UniProtAcc | Q16520 |
Top |
Malignant transformation analysis |
| Identification of the aberrant gene expression in precancerous and cancerous lesions by comparing the gene expression of stem-like cells in diseased tissues with normal stem cells |
| Entrez ID | Symbol | Replicates | Species | Organ | Tissue | Adj P-value | Log2FC | Malignancy |
| 10538 | BATF | LZE2D | Human | Esophagus | HGIN | 3.64e-03 | 1.15e+00 | 0.0642 |
| 10538 | BATF | LZE4T | Human | Esophagus | ESCC | 9.56e-12 | 5.48e-01 | 0.0811 |
| 10538 | BATF | LZE5T | Human | Esophagus | ESCC | 1.54e-04 | 2.87e-01 | 0.0514 |
| 10538 | BATF | LZE7T | Human | Esophagus | ESCC | 2.07e-09 | 1.28e+00 | 0.0667 |
| 10538 | BATF | LZE8T | Human | Esophagus | ESCC | 3.19e-08 | 5.89e-01 | 0.067 |
| 10538 | BATF | LZE20T | Human | Esophagus | ESCC | 1.26e-02 | 1.54e-01 | 0.0662 |
| 10538 | BATF | LZE22D1 | Human | Esophagus | HGIN | 8.03e-04 | 4.20e-01 | 0.0595 |
| 10538 | BATF | LZE22T | Human | Esophagus | ESCC | 1.57e-02 | 2.30e-01 | 0.068 |
| 10538 | BATF | LZE24T | Human | Esophagus | ESCC | 4.15e-02 | 1.14e-01 | 0.0596 |
| 10538 | BATF | LZE6T | Human | Esophagus | ESCC | 7.09e-15 | 9.23e-01 | 0.0845 |
| 10538 | BATF | P1T-E | Human | Esophagus | ESCC | 7.11e-04 | 1.82e-01 | 0.0875 |
| 10538 | BATF | P8T-E | Human | Esophagus | ESCC | 1.00e-41 | 1.02e+00 | 0.0889 |
| 10538 | BATF | P62T-E | Human | Esophagus | ESCC | 5.46e-06 | 1.30e-01 | 0.1302 |
| 10538 | BATF | P65T-E | Human | Esophagus | ESCC | 1.45e-23 | 4.34e-01 | 0.0978 |
| 10538 | BATF | P76T-E | Human | Esophagus | ESCC | 3.70e-02 | 6.79e-02 | 0.1207 |
| 10538 | BATF | P82T-E | Human | Esophagus | ESCC | 2.98e-07 | 3.99e-01 | 0.1072 |
| 10538 | BATF | P127T-E | Human | Esophagus | ESCC | 8.93e-17 | 3.10e-01 | 0.0826 |
| 10538 | BATF | P130T-E | Human | Esophagus | ESCC | 2.63e-14 | 3.88e-01 | 0.1676 |
| Page: 1 |
| Tissue | Expression Dynamics | Abbreviation |
| Esophagus | 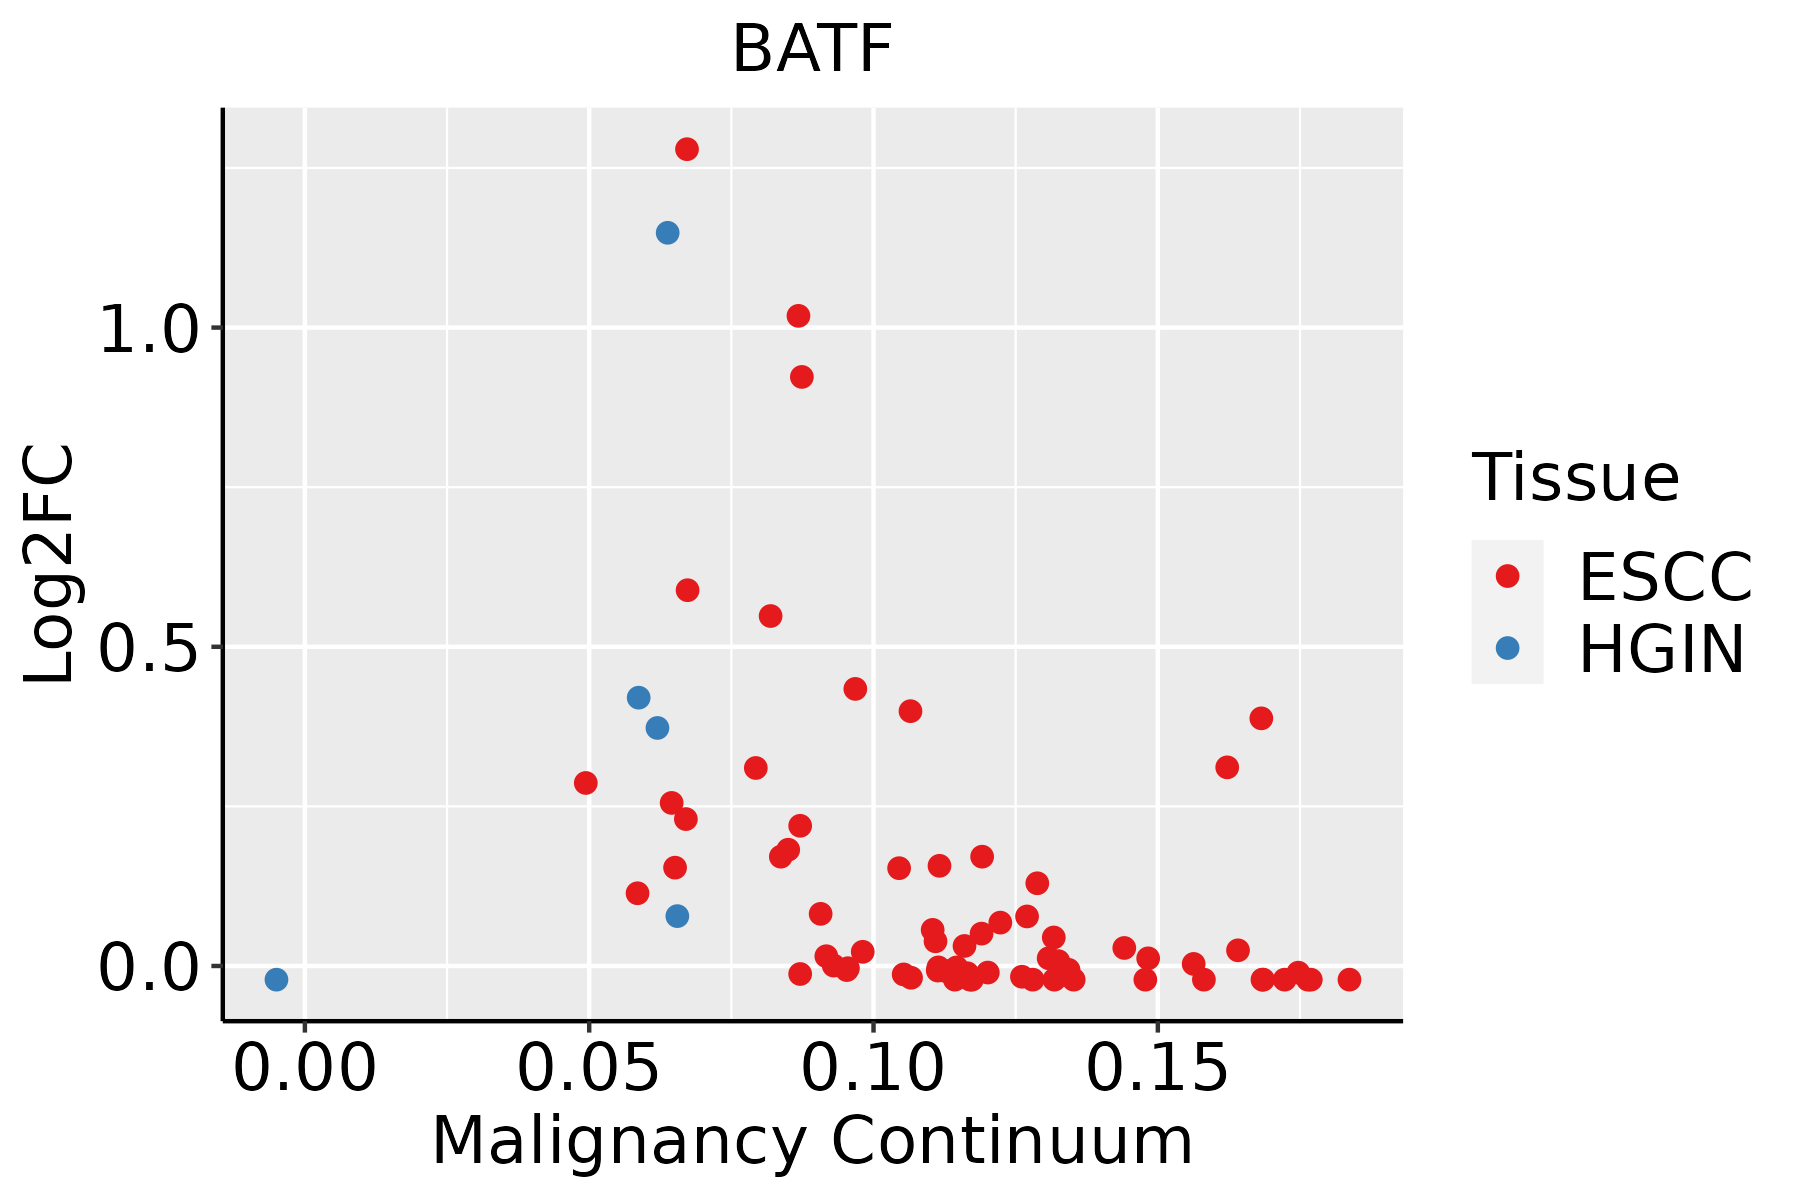 | ESCC: Esophageal squamous cell carcinoma |
| HGIN: High-grade intraepithelial neoplasias | ||
| LGIN: Low-grade intraepithelial neoplasias |
| ∗log2FC in expression of this searched gene in stem-like cells from each diseased tissue sample relative to stem-like cells in normal samples in each tissue plotted against the malignancy continuum. Samples are colored based on if they are from different disease stage. |
Top |
Malignant transformation related pathway analysis |
| Find out the enriched GO biological processes and KEGG pathways involved in transition from healthy to precancer to cancer |
| Tissue | Disease Stage | Enriched GO biological Processes |
| Colorectum | AD |  |
| Colorectum | SER |  |
| Colorectum | MSS |  |
| Colorectum | MSI-H |  |
| Colorectum | FAP |  |
| ∗Top 15 enriched GO BP terms are showed in the bar plot of each disease state in each tissue. Each row represents a significant GO biological process which is colored according to the -log10(p.adjust). |
| Page: 1 2 3 4 5 6 7 8 9 |
| GO ID | Tissue | Disease Stage | Description | Gene Ratio | Bg Ratio | pvalue | p.adjust | Count |
| GO:007233127 | Esophagus | HGIN | signal transduction by p53 class mediator | 49/2587 | 163/18723 | 5.71e-08 | 3.06e-06 | 49 |
| GO:003009927 | Esophagus | HGIN | myeloid cell differentiation | 83/2587 | 381/18723 | 1.26e-05 | 3.52e-04 | 83 |
| GO:003033020 | Esophagus | HGIN | DNA damage response, signal transduction by p53 class mediator | 24/2587 | 72/18723 | 2.03e-05 | 5.43e-04 | 24 |
| GO:00427708 | Esophagus | HGIN | signal transduction in response to DNA damage | 39/2587 | 172/18723 | 1.07e-03 | 1.32e-02 | 39 |
| GO:000257316 | Esophagus | HGIN | myeloid leukocyte differentiation | 45/2587 | 208/18723 | 1.31e-03 | 1.56e-02 | 45 |
| GO:0072331111 | Esophagus | ESCC | signal transduction by p53 class mediator | 121/8552 | 163/18723 | 9.61e-14 | 4.69e-12 | 121 |
| GO:0030099111 | Esophagus | ESCC | myeloid cell differentiation | 232/8552 | 381/18723 | 1.22e-09 | 2.90e-08 | 232 |
| GO:004277014 | Esophagus | ESCC | signal transduction in response to DNA damage | 117/8552 | 172/18723 | 2.38e-09 | 5.32e-08 | 117 |
| GO:0030330110 | Esophagus | ESCC | DNA damage response, signal transduction by p53 class mediator | 53/8552 | 72/18723 | 1.34e-06 | 1.63e-05 | 53 |
| GO:000257317 | Esophagus | ESCC | myeloid leukocyte differentiation | 128/8552 | 208/18723 | 2.75e-06 | 3.15e-05 | 128 |
| GO:00488638 | Esophagus | ESCC | stem cell differentiation | 122/8552 | 206/18723 | 5.95e-05 | 4.59e-04 | 122 |
| GO:00063101 | Esophagus | ESCC | DNA recombination | 168/8552 | 305/18723 | 5.58e-04 | 3.05e-03 | 168 |
| GO:00025622 | Esophagus | ESCC | somatic diversification of immune receptors via germline recombination within a single locus | 43/8552 | 66/18723 | 1.10e-03 | 5.53e-03 | 43 |
| GO:00164442 | Esophagus | ESCC | somatic cell DNA recombination | 43/8552 | 66/18723 | 1.10e-03 | 5.53e-03 | 43 |
| GO:00164472 | Esophagus | ESCC | somatic recombination of immunoglobulin gene segments | 38/8552 | 57/18723 | 1.11e-03 | 5.56e-03 | 38 |
| GO:00022003 | Esophagus | ESCC | somatic diversification of immune receptors | 49/8552 | 77/18723 | 1.12e-03 | 5.60e-03 | 49 |
| GO:004211018 | Esophagus | ESCC | T cell activation | 256/8552 | 487/18723 | 1.18e-03 | 5.87e-03 | 256 |
| GO:19031317 | Esophagus | ESCC | mononuclear cell differentiation | 226/8552 | 426/18723 | 1.20e-03 | 5.88e-03 | 226 |
| GO:00164452 | Esophagus | ESCC | somatic diversification of immunoglobulins | 43/8552 | 67/18723 | 1.73e-03 | 7.97e-03 | 43 |
| GO:00602185 | Esophagus | ESCC | hematopoietic stem cell differentiation | 22/8552 | 30/18723 | 1.98e-03 | 8.90e-03 | 22 |
| Page: 1 2 |
| Pathway ID | Tissue | Disease Stage | Description | Gene Ratio | Bg Ratio | pvalue | p.adjust | qvalue | Count |
| hsa052356 | Esophagus | ESCC | PD-L1 expression and PD-1 checkpoint pathway in cancer | 58/4205 | 89/8465 | 2.19e-03 | 6.16e-03 | 3.16e-03 | 58 |
| hsa0523511 | Esophagus | ESCC | PD-L1 expression and PD-1 checkpoint pathway in cancer | 58/4205 | 89/8465 | 2.19e-03 | 6.16e-03 | 3.16e-03 | 58 |
| Page: 1 |
Top |
Cell-cell communication analysis |
| Identification of potential cell-cell interactions between two cell types and their ligand-receptor pairs for different disease states |
| Ligand | Receptor | LRpair | Pathway | Tissue | Disease Stage |
| Page: 1 |
Top |
Single-cell gene regulatory network inference analysis |
| Find out the significant the regulons (TFs) and the target genes of each regulon across cell types for different disease states |
| TF | Cell Type | Tissue | Disease Stage | Target Gene | RSS | Regulon Activity |
| BATF | TREG | Breast | DCIS | TNFRSF4,TNFRSF18,IL32, etc. | 1.80e-01 |  |
| BATF | TREG | Breast | Healthy | TNFRSF4,TNFRSF18,IL32, etc. | 5.39e-02 |  |
| BATF | TREG | Breast | IDC | TNFRSF4,TNFRSF18,IL32, etc. | 1.77e-01 |  |
| BATF | KER | Cervix | Healthy | CD2,CEP78,TRAC, etc. | 2.69e-01 |  |
| BATF | STM | Cervix | HSIL_HPV | MRPS17,CD7,TNFRSF18, etc. | 2.58e-01 |  |
| BATF | STM | Cervix | N_HPV | MRPS17,CD7,TNFRSF18, etc. | 4.61e-01 |  |
| BATF | TREG | Colorectum | AD | SH2D2A,SDC4,ZNRF1, etc. | 9.33e-02 |  |
| BATF | TREG | Colorectum | ADJ | SH2D2A,SDC4,ZNRF1, etc. | 1.46e-01 |  |
| BATF | TREG | Colorectum | FAP | SH2D2A,SDC4,ZNRF1, etc. | 1.28e-01 |  |
| BATF | CD8TCM | Colorectum | MSI-H | SH2D2A,SDC4,ZNRF1, etc. | 2.29e-01 |  |
| ∗The dot plots of a searched regulon are shown for all cell subpopulations in each disease state of each tissue based on the regulon specific score inferred using pySCENIC and by calculating the average expression. |
| Page: 1 2 3 4 5 6 |
Top |
Somatic mutation of malignant transformation related genes |
| Annotation of somatic variants for genes involved in malignant transformation |
| Hugo Symbol | Variant Class | Variant Classification | dbSNP RS | HGVSc | HGVSp | HGVSp Short | SWISSPROT | BIOTYPE | SIFT | PolyPhen | Tumor Sample Barcode | Tissue | Histology | Sex | Age | Stage | Therapy Types | Drugs | Outcome |
| BATF | SNV | Missense_Mutation | novel | c.88N>A | p.Val30Ile | p.V30I | Q16520 | protein_coding | tolerated(0.08) | benign(0.333) | TCGA-PL-A8LZ-01 | Breast | breast invasive carcinoma | Female | <65 | III/IV | Chemotherapy | paclitaxel | SD |
| BATF | SNV | Missense_Mutation | c.313N>A | p.Glu105Lys | p.E105K | Q16520 | protein_coding | deleterious(0.01) | benign(0.299) | TCGA-JW-A5VI-01 | Cervix | cervical & endocervical cancer | Female | <65 | I/II | Chemotherapy | topotecan | PD | |
| BATF | SNV | Missense_Mutation | c.109N>T | p.Arg37Cys | p.R37C | Q16520 | protein_coding | deleterious(0) | probably_damaging(0.996) | TCGA-AD-6888-01 | Colorectum | colon adenocarcinoma | Male | >=65 | III/IV | Unknown | Unknown | PD | |
| BATF | SNV | Missense_Mutation | c.109C>T | p.Arg37Cys | p.R37C | Q16520 | protein_coding | deleterious(0) | probably_damaging(0.996) | TCGA-AZ-6601-01 | Colorectum | colon adenocarcinoma | Male | >=65 | I/II | Unknown | Unknown | PD | |
| BATF | SNV | Missense_Mutation | rs772105665 | c.362C>T | p.Pro121Leu | p.P121L | Q16520 | protein_coding | deleterious_low_confidence(0) | probably_damaging(0.995) | TCGA-G4-6310-01 | Colorectum | colon adenocarcinoma | Male | >=65 | III/IV | Chemotherapy | 5-fu | SD |
| BATF | SNV | Missense_Mutation | c.109C>T | p.Arg37Cys | p.R37C | Q16520 | protein_coding | deleterious(0) | probably_damaging(0.996) | TCGA-AG-A002-01 | Colorectum | rectum adenocarcinoma | Male | <65 | I/II | Unknown | Unknown | SD | |
| BATF | SNV | Missense_Mutation | novel | c.16G>A | p.Asp6Asn | p.D6N | Q16520 | protein_coding | tolerated_low_confidence(0.18) | probably_damaging(0.978) | TCGA-A5-A0G2-01 | Endometrium | uterine corpus endometrioid carcinoma | Female | <65 | III/IV | Unknown | Unknown | SD |
| BATF | SNV | Missense_Mutation | novel | c.292G>A | p.Ala98Thr | p.A98T | Q16520 | protein_coding | tolerated(0.8) | benign(0) | TCGA-AP-A1DK-01 | Endometrium | uterine corpus endometrioid carcinoma | Female | <65 | I/II | Unknown | Unknown | SD |
| BATF | SNV | Missense_Mutation | novel | c.315N>T | p.Glu105Asp | p.E105D | Q16520 | protein_coding | tolerated(0.36) | benign(0.014) | TCGA-AX-A2HC-01 | Endometrium | uterine corpus endometrioid carcinoma | Female | <65 | III/IV | Chemotherapy | paclitaxel | PD |
| BATF | SNV | Missense_Mutation | c.175N>A | p.Glu59Lys | p.E59K | Q16520 | protein_coding | deleterious(0) | probably_damaging(0.989) | TCGA-B5-A11Y-01 | Endometrium | uterine corpus endometrioid carcinoma | Female | <65 | I/II | Unknown | Unknown | SD |
| Page: 1 2 |
Top |
Related drugs of malignant transformation related genes |
| Identification of chemicals and drugs interact with genes involved in malignant transfromation |
| (DGIdb 4.0) |
| Entrez ID | Symbol | Category | Interaction Types | Drug Claim Name | Drug Name | PMIDs |
| Page: 1 |

Copyright 2023-Present -The University of Texas Health Science Center at Houston |