| Tissue | Expression Dynamics | Abbreviation |
| Esophagus | 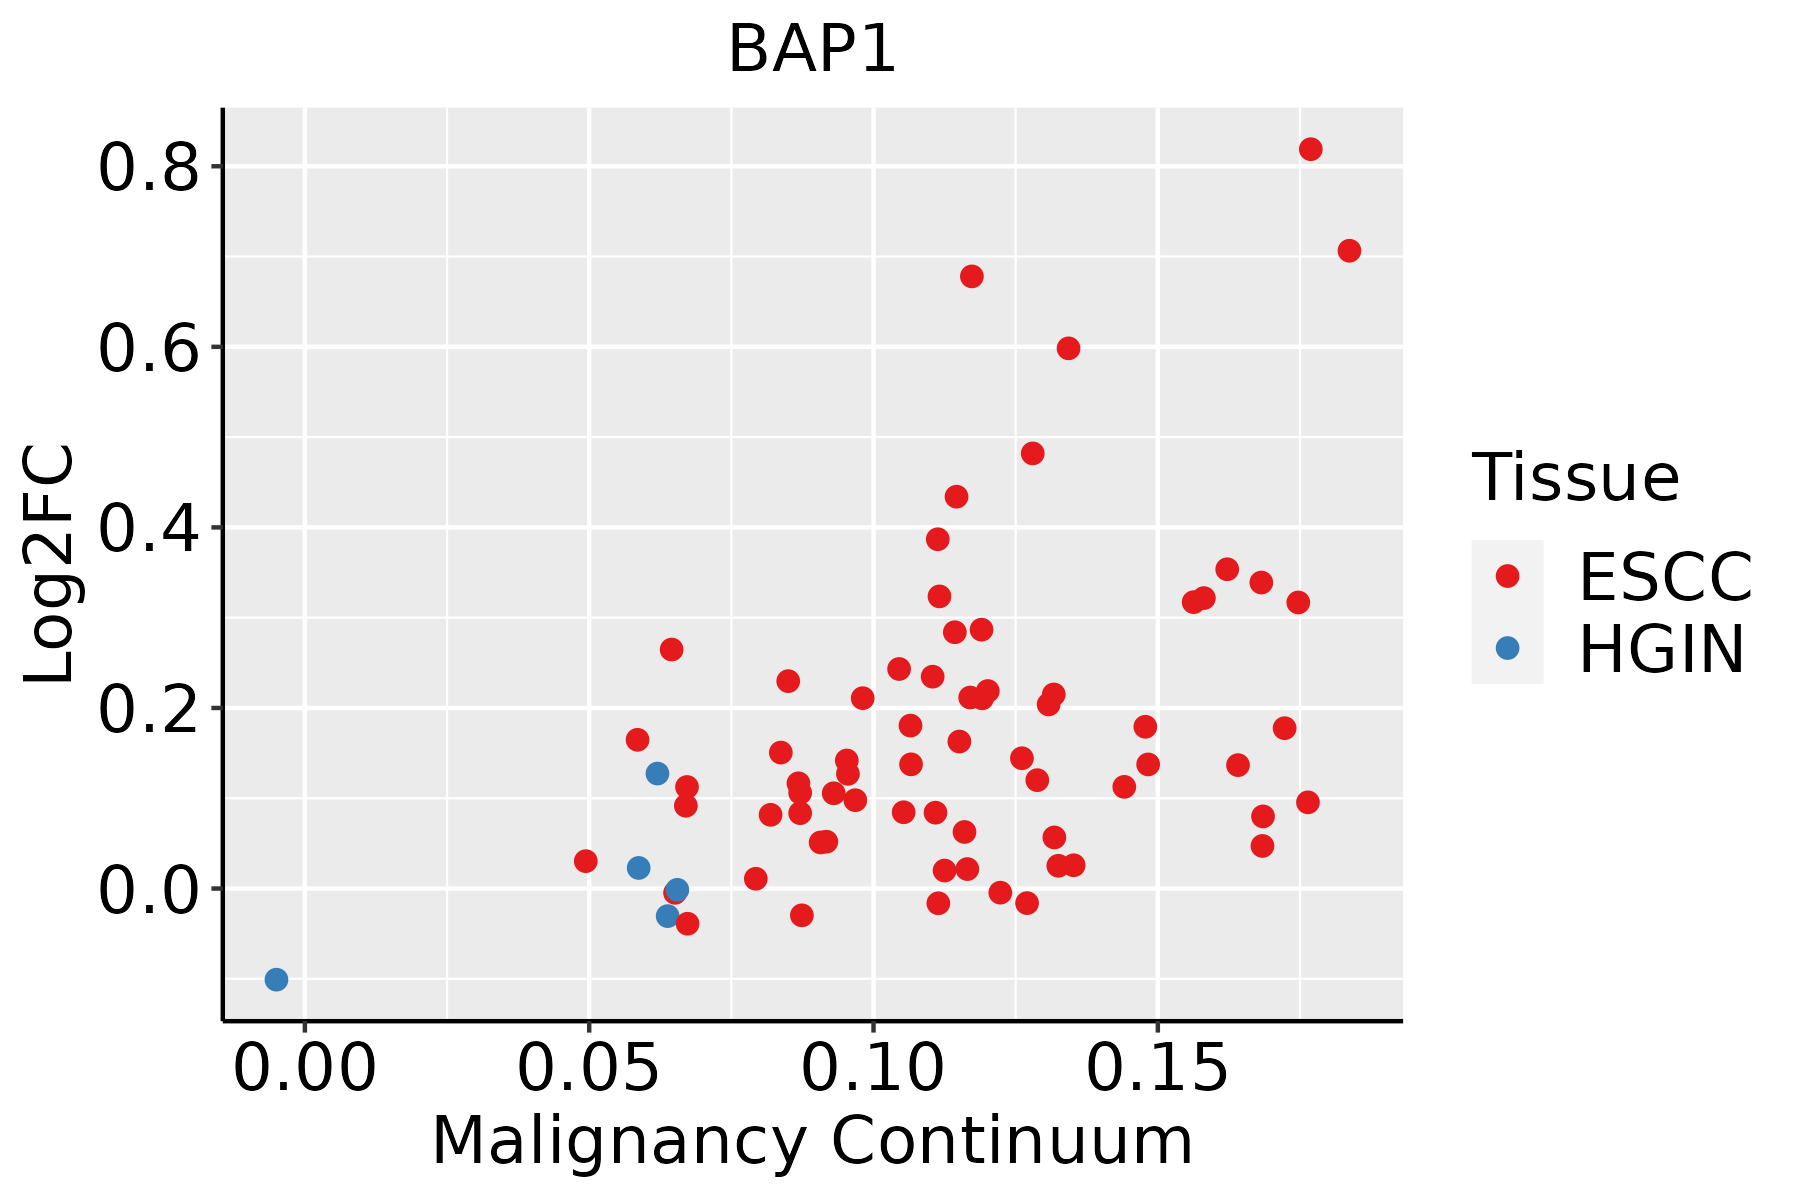 | ESCC: Esophageal squamous cell carcinoma |
| HGIN: High-grade intraepithelial neoplasias |
| LGIN: Low-grade intraepithelial neoplasias |
| Liver |  | HCC: Hepatocellular carcinoma |
| NAFLD: Non-alcoholic fatty liver disease |
| Oral Cavity | 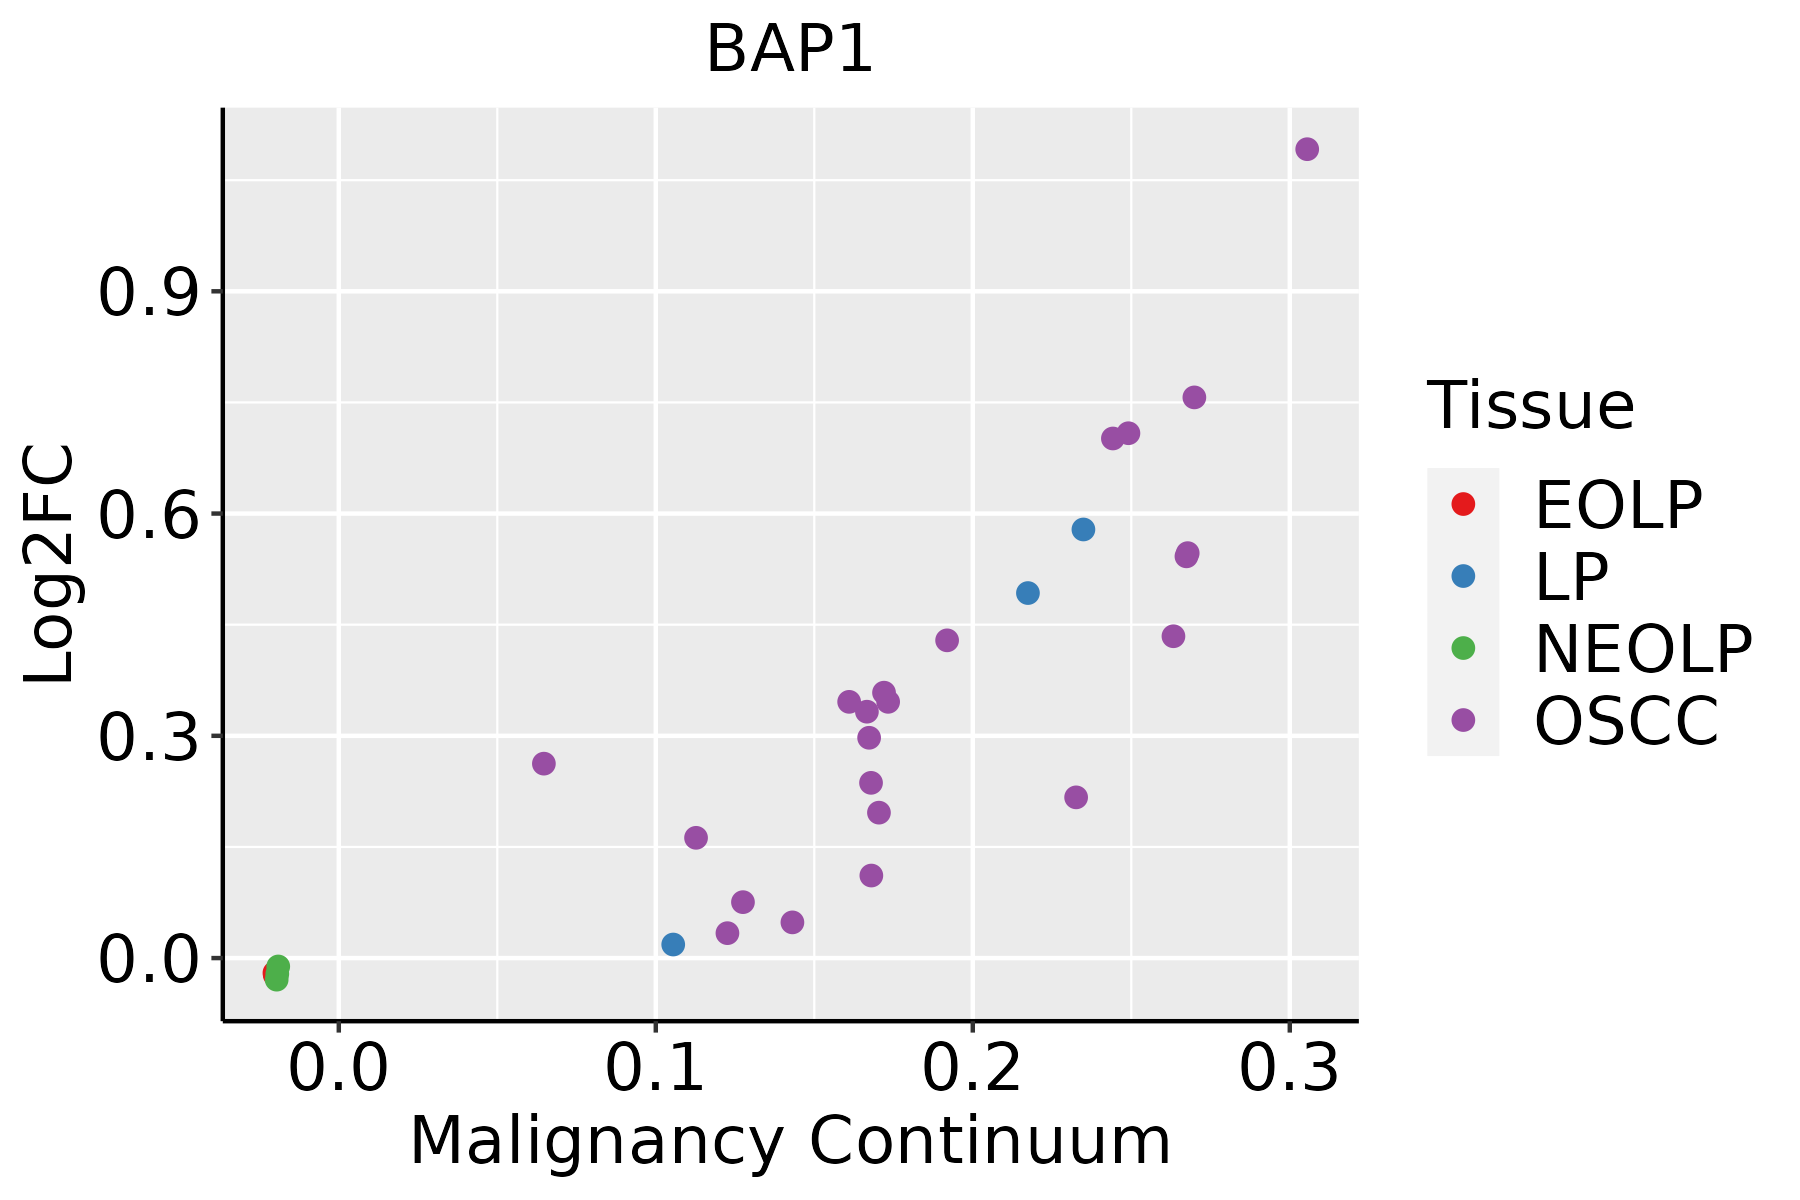 | EOLP: Erosive Oral lichen planus |
| LP: leukoplakia |
| NEOLP: Non-erosive oral lichen planus |
| OSCC: Oral squamous cell carcinoma |
| Skin |  | AK: Actinic keratosis |
| cSCC: Cutaneous squamous cell carcinoma |
| SCCIS:squamous cell carcinoma in situ |
| GO ID | Tissue | Disease Stage | Description | Gene Ratio | Bg Ratio | pvalue | p.adjust | Count |
| GO:0072594110 | Esophagus | ESCC | establishment of protein localization to organelle | 311/8552 | 422/18723 | 3.02e-32 | 2.13e-29 | 311 |
| GO:001657015 | Esophagus | ESCC | histone modification | 323/8552 | 463/18723 | 2.61e-26 | 7.88e-24 | 323 |
| GO:003238618 | Esophagus | ESCC | regulation of intracellular transport | 243/8552 | 337/18723 | 3.20e-23 | 7.25e-21 | 243 |
| GO:0006605111 | Esophagus | ESCC | protein targeting | 229/8552 | 314/18723 | 4.93e-23 | 1.01e-20 | 229 |
| GO:0006839110 | Esophagus | ESCC | mitochondrial transport | 187/8552 | 254/18723 | 8.35e-20 | 9.81e-18 | 187 |
| GO:1903829111 | Esophagus | ESCC | positive regulation of cellular protein localization | 199/8552 | 276/18723 | 2.99e-19 | 3.45e-17 | 199 |
| GO:0033157110 | Esophagus | ESCC | regulation of intracellular protein transport | 169/8552 | 229/18723 | 3.31e-18 | 3.23e-16 | 169 |
| GO:0032388110 | Esophagus | ESCC | positive regulation of intracellular transport | 152/8552 | 202/18723 | 7.89e-18 | 7.36e-16 | 152 |
| GO:1904951111 | Esophagus | ESCC | positive regulation of establishment of protein localization | 216/8552 | 319/18723 | 1.01e-15 | 6.86e-14 | 216 |
| GO:0072655110 | Esophagus | ESCC | establishment of protein localization to mitochondrion | 97/8552 | 120/18723 | 2.17e-15 | 1.33e-13 | 97 |
| GO:009031617 | Esophagus | ESCC | positive regulation of intracellular protein transport | 122/8552 | 160/18723 | 2.45e-15 | 1.49e-13 | 122 |
| GO:0070585110 | Esophagus | ESCC | protein localization to mitochondrion | 100/8552 | 125/18723 | 2.96e-15 | 1.77e-13 | 100 |
| GO:0051222111 | Esophagus | ESCC | positive regulation of protein transport | 204/8552 | 303/18723 | 1.56e-14 | 8.38e-13 | 204 |
| GO:0006626110 | Esophagus | ESCC | protein targeting to mitochondrion | 81/8552 | 100/18723 | 3.60e-13 | 1.67e-11 | 81 |
| GO:0016049110 | Esophagus | ESCC | cell growth | 289/8552 | 482/18723 | 1.29e-10 | 3.77e-09 | 289 |
| GO:000155819 | Esophagus | ESCC | regulation of cell growth | 248/8552 | 414/18723 | 2.97e-09 | 6.45e-08 | 248 |
| GO:0002262111 | Esophagus | ESCC | myeloid cell homeostasis | 104/8552 | 157/18723 | 1.49e-07 | 2.36e-06 | 104 |
| GO:0048872111 | Esophagus | ESCC | homeostasis of number of cells | 163/8552 | 272/18723 | 1.40e-06 | 1.69e-05 | 163 |
| GO:190353315 | Esophagus | ESCC | regulation of protein targeting | 57/8552 | 81/18723 | 5.83e-06 | 6.03e-05 | 57 |
| GO:190374715 | Esophagus | ESCC | regulation of establishment of protein localization to mitochondrion | 37/8552 | 50/18723 | 4.42e-05 | 3.51e-04 | 37 |
| Hugo Symbol | Variant Class | Variant Classification | dbSNP RS | HGVSc | HGVSp | HGVSp Short | SWISSPROT | BIOTYPE | SIFT | PolyPhen | Tumor Sample Barcode | Tissue | Histology | Sex | Age | Stage | Therapy Types | Drugs | Outcome |
| BAP1 | SNV | Missense_Mutation | novel | c.626N>G | p.Val209Gly | p.V209G | Q92560 | protein_coding | deleterious(0) | probably_damaging(0.998) | TCGA-A2-A0CS-01 | Breast | breast invasive carcinoma | Female | >=65 | III/IV | Hormone Therapy | anastrozole | SD |
| BAP1 | SNV | Missense_Mutation | | c.145C>G | p.Leu49Val | p.L49V | Q92560 | protein_coding | deleterious(0) | probably_damaging(0.999) | TCGA-A2-A0EQ-01 | Breast | breast invasive carcinoma | Female | <65 | I/II | Chemotherapy | adriamycin | SD |
| BAP1 | SNV | Missense_Mutation | | c.1195G>A | p.Asp399Asn | p.D399N | Q92560 | protein_coding | deleterious_low_confidence(0.02) | probably_damaging(0.984) | TCGA-A2-A0YD-01 | Breast | breast invasive carcinoma | Female | <65 | I/II | Chemotherapy | cytoxan | SD |
| BAP1 | SNV | Missense_Mutation | | c.134N>A | p.Gly45Glu | p.G45E | Q92560 | protein_coding | deleterious(0) | probably_damaging(1) | TCGA-A2-A0YE-01 | Breast | breast invasive carcinoma | Female | <65 | I/II | Unspecific | Taxotere | SD |
| BAP1 | SNV | Missense_Mutation | | c.131N>G | p.Tyr44Cys | p.Y44C | Q92560 | protein_coding | deleterious(0) | probably_damaging(0.999) | TCGA-AN-A0AK-01 | Breast | breast invasive carcinoma | Female | >=65 | I/II | Unknown | Unknown | SD |
| BAP1 | SNV | Missense_Mutation | | c.709N>T | p.Arg237Cys | p.R237C | Q92560 | protein_coding | deleterious(0.05) | probably_damaging(0.976) | TCGA-BH-A0GY-01 | Breast | breast invasive carcinoma | Female | >=65 | I/II | Chemotherapy | cyotxan | SD |
| BAP1 | SNV | Missense_Mutation | | c.599N>G | p.Glu200Gly | p.E200G | Q92560 | protein_coding | deleterious(0.02) | benign(0.352) | TCGA-BH-A0HA-01 | Breast | breast invasive carcinoma | Female | <65 | I/II | Unknown | Unknown | SD |
| BAP1 | SNV | Missense_Mutation | | c.1291N>A | p.Gly431Ser | p.G431S | Q92560 | protein_coding | tolerated_low_confidence(0.34) | benign(0) | TCGA-BH-A0HF-01 | Breast | breast invasive carcinoma | Female | >=65 | I/II | Hormone Therapy | arimidex | SD |
| BAP1 | SNV | Missense_Mutation | novel | c.1696G>A | p.Glu566Lys | p.E566K | Q92560 | protein_coding | tolerated_low_confidence(0.11) | benign(0.001) | TCGA-C8-A3M7-01 | Breast | breast invasive carcinoma | Female | <65 | III/IV | Unknown | Unknown | PD |
| BAP1 | SNV | Missense_Mutation | rs375129361 | c.277N>G | p.Thr93Ala | p.T93A | Q92560 | protein_coding | deleterious(0) | probably_damaging(0.989) | TCGA-E2-A573-01 | Breast | breast invasive carcinoma | Female | <65 | I/II | Chemotherapy | taxotere | CR |
| Entrez ID | Symbol | Category | Interaction Types | Drug Claim Name | Drug Name | PMIDs |
| 8314 | BAP1 | PROTEASE, TUMOR SUPPRESSOR, ENZYME, CLINICALLY ACTIONABLE, DRUG RESISTANCE | | APITOLISIB | APITOLISIB | 28389374 |
| 8314 | BAP1 | PROTEASE, TUMOR SUPPRESSOR, ENZYME, CLINICALLY ACTIONABLE, DRUG RESISTANCE | | VALPROIC ACID | | 22038994 |
| 8314 | BAP1 | PROTEASE, TUMOR SUPPRESSOR, ENZYME, CLINICALLY ACTIONABLE, DRUG RESISTANCE | | SUNITINIB | SUNITINIB | 27751729 |
| 8314 | BAP1 | PROTEASE, TUMOR SUPPRESSOR, ENZYME, CLINICALLY ACTIONABLE, DRUG RESISTANCE | | VORINOSTAT | VORINOSTAT | 22038994 |
| 8314 | BAP1 | PROTEASE, TUMOR SUPPRESSOR, ENZYME, CLINICALLY ACTIONABLE, DRUG RESISTANCE | | PANOBINOSTAT | PANOBINOSTAT | 22038994 |
| 8314 | BAP1 | PROTEASE, TUMOR SUPPRESSOR, ENZYME, CLINICALLY ACTIONABLE, DRUG RESISTANCE | | EVEROLIMUS | EVEROLIMUS | 27751729 |
| 8314 | BAP1 | PROTEASE, TUMOR SUPPRESSOR, ENZYME, CLINICALLY ACTIONABLE, DRUG RESISTANCE | | TRICHOSTATIN A | | 22038994 |
| 8314 | BAP1 | PROTEASE, TUMOR SUPPRESSOR, ENZYME, CLINICALLY ACTIONABLE, DRUG RESISTANCE | | OLAPARIB | OLAPARIB | 28389374,22683710 |


