
|
|||||
|
 | |
| |
| |
| |
| |
| |
|
Gene: BANP |
Gene summary for BANP |
| Gene information | Species | Human | Gene symbol | BANP | Gene ID | 54971 |
| Gene name | BTG3 associated nuclear protein | |
| Gene Alias | BEND1 | |
| Cytomap | 16q24.2 | |
| Gene Type | protein-coding | GO ID | GO:0006325 | UniProtAcc | B3KM38 |
Top |
Malignant transformation analysis |
| Identification of the aberrant gene expression in precancerous and cancerous lesions by comparing the gene expression of stem-like cells in diseased tissues with normal stem cells |
| Entrez ID | Symbol | Replicates | Species | Organ | Tissue | Adj P-value | Log2FC | Malignancy |
| 54971 | BANP | LZE4T | Human | Esophagus | ESCC | 3.67e-09 | 2.73e-01 | 0.0811 |
| 54971 | BANP | LZE7T | Human | Esophagus | ESCC | 8.21e-04 | 2.40e-01 | 0.0667 |
| 54971 | BANP | LZE8T | Human | Esophagus | ESCC | 3.15e-02 | 1.30e-01 | 0.067 |
| 54971 | BANP | LZE22T | Human | Esophagus | ESCC | 4.19e-02 | 1.96e-01 | 0.068 |
| 54971 | BANP | LZE24T | Human | Esophagus | ESCC | 3.17e-07 | 2.20e-01 | 0.0596 |
| 54971 | BANP | P1T-E | Human | Esophagus | ESCC | 3.12e-04 | 2.87e-01 | 0.0875 |
| 54971 | BANP | P2T-E | Human | Esophagus | ESCC | 1.37e-11 | 2.77e-01 | 0.1177 |
| 54971 | BANP | P4T-E | Human | Esophagus | ESCC | 1.14e-09 | 2.34e-01 | 0.1323 |
| 54971 | BANP | P5T-E | Human | Esophagus | ESCC | 5.69e-18 | 2.14e-01 | 0.1327 |
| 54971 | BANP | P8T-E | Human | Esophagus | ESCC | 2.85e-10 | 2.00e-01 | 0.0889 |
| 54971 | BANP | P9T-E | Human | Esophagus | ESCC | 7.84e-08 | 1.16e-01 | 0.1131 |
| 54971 | BANP | P10T-E | Human | Esophagus | ESCC | 4.52e-12 | 2.40e-01 | 0.116 |
| 54971 | BANP | P11T-E | Human | Esophagus | ESCC | 3.59e-04 | 2.68e-01 | 0.1426 |
| 54971 | BANP | P12T-E | Human | Esophagus | ESCC | 8.98e-18 | 3.18e-01 | 0.1122 |
| 54971 | BANP | P15T-E | Human | Esophagus | ESCC | 1.01e-13 | 2.74e-01 | 0.1149 |
| 54971 | BANP | P16T-E | Human | Esophagus | ESCC | 3.56e-09 | 2.69e-01 | 0.1153 |
| 54971 | BANP | P20T-E | Human | Esophagus | ESCC | 1.50e-17 | 4.22e-01 | 0.1124 |
| 54971 | BANP | P21T-E | Human | Esophagus | ESCC | 2.75e-09 | 1.93e-01 | 0.1617 |
| 54971 | BANP | P22T-E | Human | Esophagus | ESCC | 5.20e-15 | 2.19e-01 | 0.1236 |
| 54971 | BANP | P23T-E | Human | Esophagus | ESCC | 5.64e-12 | 3.23e-01 | 0.108 |
| Page: 1 2 3 |
| Tissue | Expression Dynamics | Abbreviation |
| Esophagus | 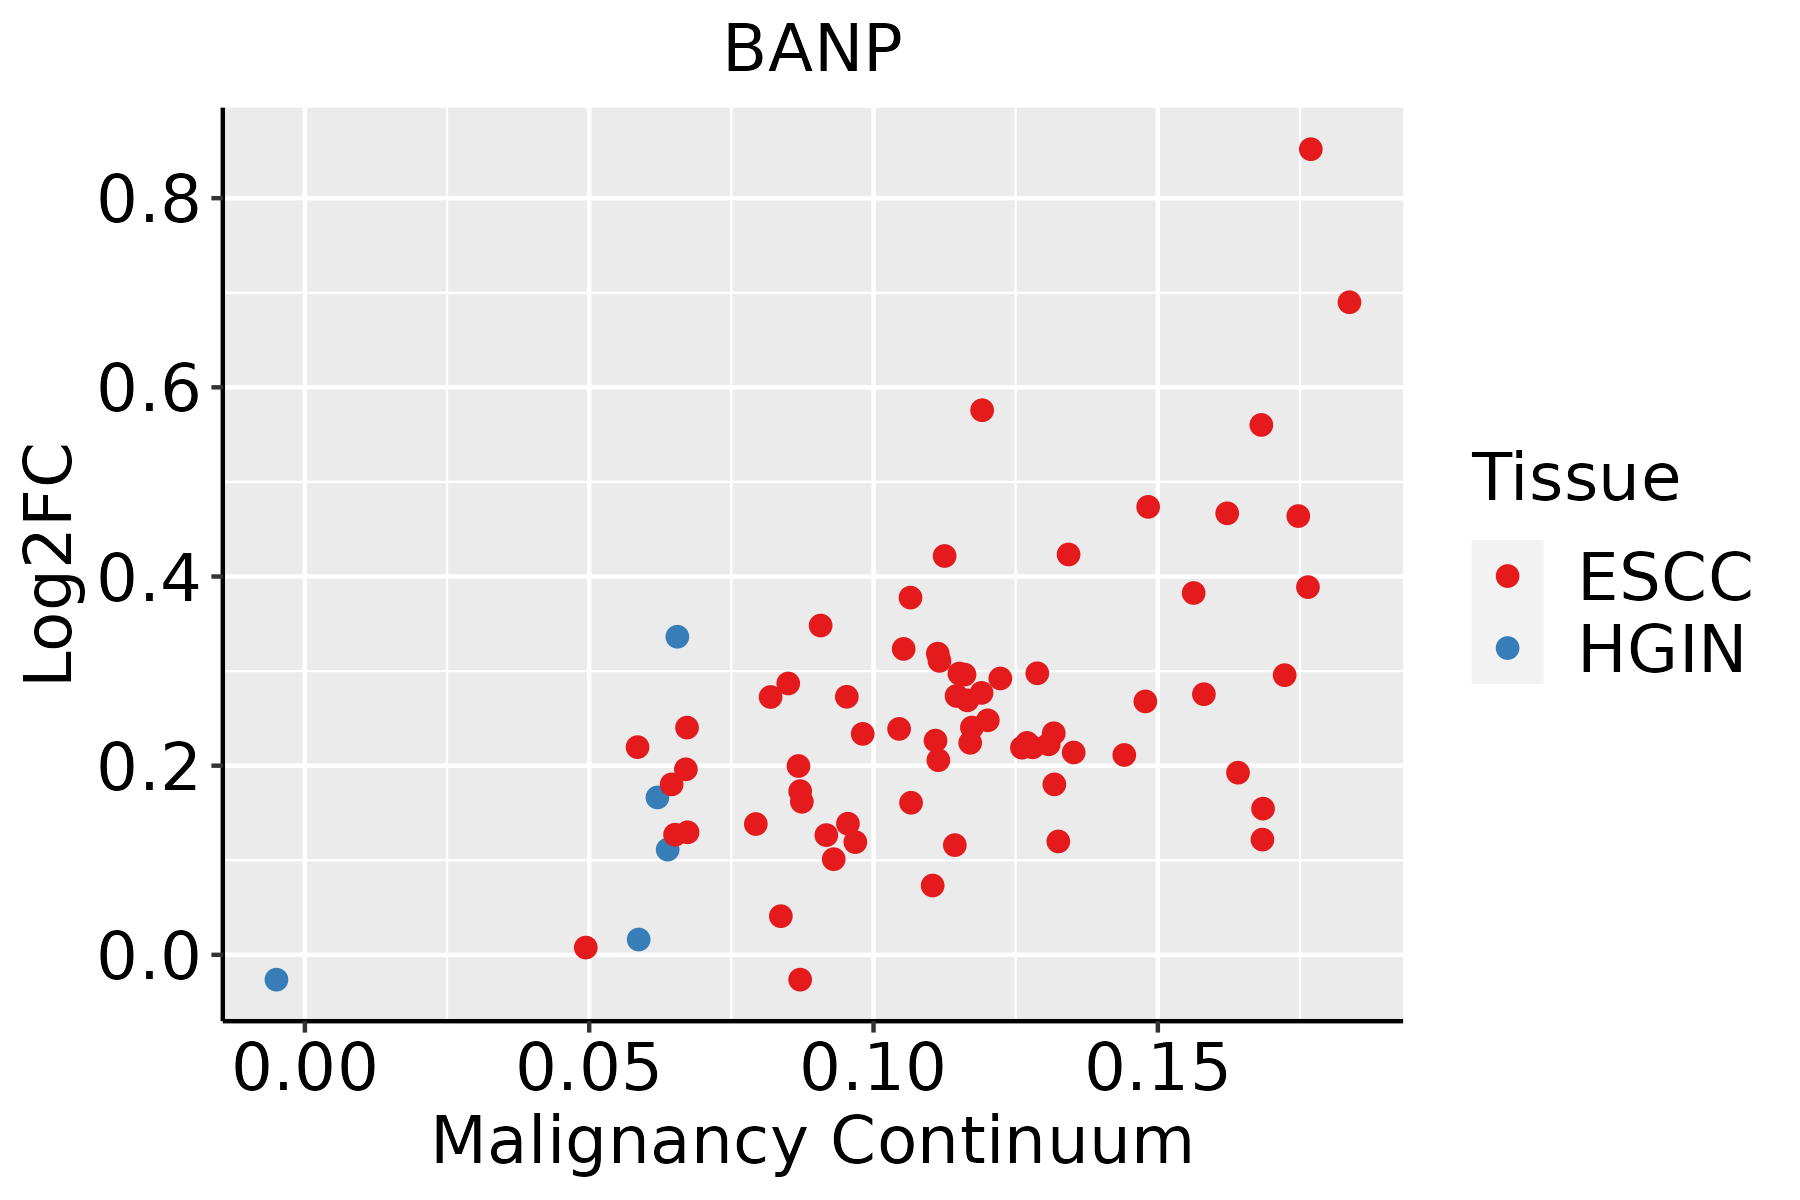 | ESCC: Esophageal squamous cell carcinoma |
| HGIN: High-grade intraepithelial neoplasias | ||
| LGIN: Low-grade intraepithelial neoplasias |
| ∗log2FC in expression of this searched gene in stem-like cells from each diseased tissue sample relative to stem-like cells in normal samples in each tissue plotted against the malignancy continuum. Samples are colored based on if they are from different disease stage. |
Top |
Malignant transformation related pathway analysis |
| Find out the enriched GO biological processes and KEGG pathways involved in transition from healthy to precancer to cancer |
| Tissue | Disease Stage | Enriched GO biological Processes |
| Colorectum | AD |  |
| Colorectum | SER |  |
| Colorectum | MSS |  |
| Colorectum | MSI-H |  |
| Colorectum | FAP |  |
| ∗Top 15 enriched GO BP terms are showed in the bar plot of each disease state in each tissue. Each row represents a significant GO biological process which is colored according to the -log10(p.adjust). |
| Page: 1 2 3 4 5 6 7 8 9 |
| GO ID | Tissue | Disease Stage | Description | Gene Ratio | Bg Ratio | pvalue | p.adjust | Count |
| GO:0042176111 | Esophagus | ESCC | regulation of protein catabolic process | 280/8552 | 391/18723 | 8.65e-26 | 2.39e-23 | 280 |
| GO:003450418 | Esophagus | ESCC | protein localization to nucleus | 211/8552 | 290/18723 | 4.06e-21 | 6.60e-19 | 211 |
| GO:0009895111 | Esophagus | ESCC | negative regulation of catabolic process | 201/8552 | 320/18723 | 3.88e-10 | 1.05e-08 | 201 |
| GO:000632517 | Esophagus | ESCC | chromatin organization | 240/8552 | 409/18723 | 6.52e-08 | 1.14e-06 | 240 |
| GO:0042177111 | Esophagus | ESCC | negative regulation of protein catabolic process | 84/8552 | 121/18723 | 1.03e-07 | 1.69e-06 | 84 |
| Page: 1 |
| Pathway ID | Tissue | Disease Stage | Description | Gene Ratio | Bg Ratio | pvalue | p.adjust | qvalue | Count |
| Page: 1 |
Top |
Cell-cell communication analysis |
| Identification of potential cell-cell interactions between two cell types and their ligand-receptor pairs for different disease states |
| Ligand | Receptor | LRpair | Pathway | Tissue | Disease Stage |
| Page: 1 |
Top |
Single-cell gene regulatory network inference analysis |
| Find out the significant the regulons (TFs) and the target genes of each regulon across cell types for different disease states |
| TF | Cell Type | Tissue | Disease Stage | Target Gene | RSS | Regulon Activity |
| BANP | INMON | Cervix | ADJ | RGS5,S100Z,GNA12, etc. | 1.18e-01 |  |
| BANP | NEUT | Cervix | Healthy | RGS5,S100Z,GNA12, etc. | 4.68e-01 |  |
| BANP | NEUT | Cervix | N_HPV | RGS5,S100Z,GNA12, etc. | 3.96e-01 |  |
| ∗The dot plots of a searched regulon are shown for all cell subpopulations in each disease state of each tissue based on the regulon specific score inferred using pySCENIC and by calculating the average expression. |
| Page: 1 |
Top |
Somatic mutation of malignant transformation related genes |
| Annotation of somatic variants for genes involved in malignant transformation |
| Hugo Symbol | Variant Class | Variant Classification | dbSNP RS | HGVSc | HGVSp | HGVSp Short | SWISSPROT | BIOTYPE | SIFT | PolyPhen | Tumor Sample Barcode | Tissue | Histology | Sex | Age | Stage | Therapy Types | Drugs | Outcome |
| BANP | SNV | Missense_Mutation | c.145N>A | p.Gln49Lys | p.Q49K | Q8N9N5 | protein_coding | deleterious_low_confidence(0.03) | probably_damaging(0.91) | TCGA-D8-A1JP-01 | Breast | breast invasive carcinoma | Female | >=65 | I/II | Hormone Therapy | tamoxiphen | SD | |
| BANP | SNV | Missense_Mutation | c.515G>T | p.Ser172Ile | p.S172I | Q8N9N5 | protein_coding | tolerated_low_confidence(0.09) | probably_damaging(0.983) | TCGA-D8-A4Z1-01 | Breast | breast invasive carcinoma | Female | >=65 | I/II | Hormone Therapy | tamoxiphen | SD | |
| BANP | insertion | In_Frame_Ins | novel | c.538_539insCCCATGGAGTTTCTATTAATCTTGGTAGAGAGA | p.Gly180delinsAlaHisGlyValSerIleAsnLeuGlyArgGluSer | p.G180delinsAHGVSINLGRES | Q8N9N5 | protein_coding | TCGA-A8-A09M-01 | Breast | breast invasive carcinoma | Female | >=65 | III/IV | Chemotherapy | paclitaxel | CR | ||
| BANP | insertion | Frame_Shift_Ins | novel | c.540_541insAGTA | p.Glu182IlefsTer116 | p.E182Ifs*116 | Q8N9N5 | protein_coding | TCGA-A8-A09M-01 | Breast | breast invasive carcinoma | Female | >=65 | III/IV | Chemotherapy | paclitaxel | CR | ||
| BANP | SNV | Missense_Mutation | c.49G>T | p.Asp17Tyr | p.D17Y | Q8N9N5 | protein_coding | deleterious_low_confidence(0) | possibly_damaging(0.807) | TCGA-2W-A8YY-01 | Cervix | cervical & endocervical cancer | Female | <65 | I/II | Chemotherapy | cisplatin | CR | |
| BANP | SNV | Missense_Mutation | rs375355566 | c.1019C>T | p.Ser340Leu | p.S340L | Q8N9N5 | protein_coding | deleterious_low_confidence(0) | probably_damaging(0.974) | TCGA-2W-A8YY-01 | Cervix | cervical & endocervical cancer | Female | <65 | I/II | Chemotherapy | cisplatin | CR |
| BANP | SNV | Missense_Mutation | c.376N>T | p.Arg126Trp | p.R126W | Q8N9N5 | protein_coding | deleterious_low_confidence(0) | probably_damaging(0.988) | TCGA-EK-A3GJ-01 | Cervix | cervical & endocervical cancer | Female | <65 | I/II | Unknown | Unknown | SD | |
| BANP | SNV | Missense_Mutation | c.1110N>A | p.His370Gln | p.H370Q | Q8N9N5 | protein_coding | deleterious_low_confidence(0.05) | probably_damaging(0.972) | TCGA-AA-3492-01 | Colorectum | colon adenocarcinoma | Female | >=65 | I/II | Unknown | Unknown | SD | |
| BANP | SNV | Missense_Mutation | c.694N>A | p.Ala232Thr | p.A232T | Q8N9N5 | protein_coding | deleterious(0.01) | probably_damaging(0.991) | TCGA-AA-3672-01 | Colorectum | colon adenocarcinoma | Female | >=65 | III/IV | Unknown | Unknown | SD | |
| BANP | SNV | Missense_Mutation | novel | c.16G>A | p.Asp6Asn | p.D6N | Q8N9N5 | protein_coding | deleterious_low_confidence(0.01) | probably_damaging(0.988) | TCGA-AA-3984-01 | Colorectum | colon adenocarcinoma | Female | <65 | I/II | Unknown | Unknown | SD |
| Page: 1 2 3 4 5 6 |
Top |
Related drugs of malignant transformation related genes |
| Identification of chemicals and drugs interact with genes involved in malignant transfromation |
| (DGIdb 4.0) |
| Entrez ID | Symbol | Category | Interaction Types | Drug Claim Name | Drug Name | PMIDs |
| Page: 1 |

Copyright 2023-Present -The University of Texas Health Science Center at Houston |