
|
|||||
|
 | |
| |
| |
| |
| |
| |
|
Gene: BANK1 |
Gene summary for BANK1 |
| Gene information | Species | Human | Gene symbol | BANK1 | Gene ID | 55024 |
| Gene name | B cell scaffold protein with ankyrin repeats 1 | |
| Gene Alias | BANK | |
| Cytomap | 4q24 | |
| Gene Type | protein-coding | GO ID | GO:0000165 | UniProtAcc | Q8NDB2 |
Top |
Malignant transformation analysis |
| Identification of the aberrant gene expression in precancerous and cancerous lesions by comparing the gene expression of stem-like cells in diseased tissues with normal stem cells |
| Entrez ID | Symbol | Replicates | Species | Organ | Tissue | Adj P-value | Log2FC | Malignancy |
| 55024 | BANK1 | GSM5353216_PA_PB1A_Pool_1_3_S50_L002 | Human | Prostate | Tumor | 2.22e-03 | 6.48e-01 | 0.159 |
| 55024 | BANK1 | GSM5353226_PA_PR5196-2_Pool_1_2_3_S54_L002 | Human | Prostate | Tumor | 4.40e-03 | 5.14e-01 | 0.159 |
| Page: 1 |
| Tissue | Expression Dynamics | Abbreviation |
| Prostate | 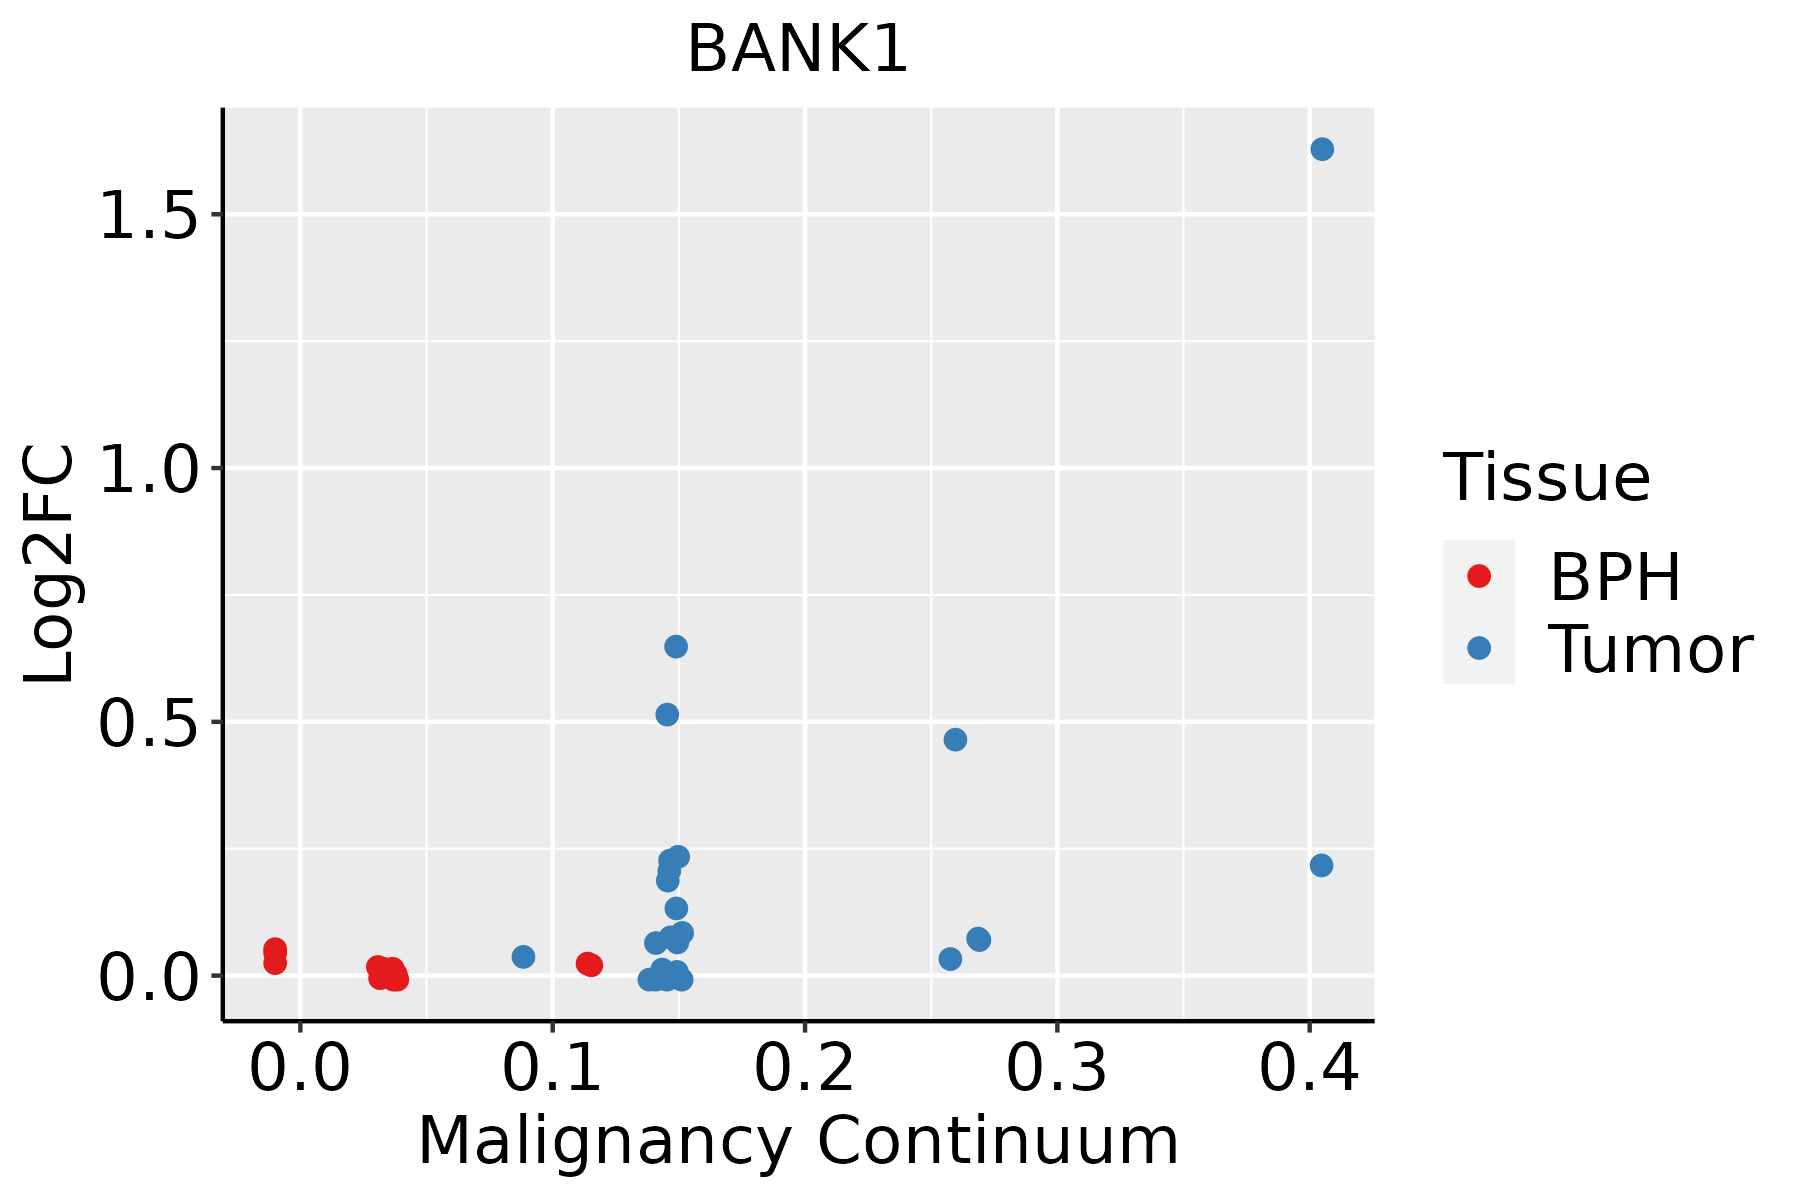 | BPH: Benign Prostatic Hyperplasia |
| ∗log2FC in expression of this searched gene in stem-like cells from each diseased tissue sample relative to stem-like cells in normal samples in each tissue plotted against the malignancy continuum. Samples are colored based on if they are from different disease stage. |
Top |
Malignant transformation related pathway analysis |
| Find out the enriched GO biological processes and KEGG pathways involved in transition from healthy to precancer to cancer |
| Tissue | Disease Stage | Enriched GO biological Processes |
| Colorectum | AD |  |
| Colorectum | SER |  |
| Colorectum | MSS |  |
| Colorectum | MSI-H |  |
| Colorectum | FAP |  |
| ∗Top 15 enriched GO BP terms are showed in the bar plot of each disease state in each tissue. Each row represents a significant GO biological process which is colored according to the -log10(p.adjust). |
| Page: 1 2 3 4 5 6 7 8 9 |
| GO ID | Tissue | Disease Stage | Description | Gene Ratio | Bg Ratio | pvalue | p.adjust | Count |
| GO:000641317 | Prostate | Tumor | translational initiation | 66/3246 | 118/18723 | 2.57e-21 | 2.66e-18 | 66 |
| GO:000641719 | Prostate | Tumor | regulation of translation | 161/3246 | 468/18723 | 1.55e-19 | 8.74e-17 | 161 |
| GO:000644615 | Prostate | Tumor | regulation of translational initiation | 44/3246 | 79/18723 | 1.37e-14 | 1.89e-12 | 44 |
| GO:004594712 | Prostate | Tumor | negative regulation of translational initiation | 15/3246 | 19/18723 | 7.16e-09 | 2.75e-07 | 15 |
| GO:003424912 | Prostate | Tumor | negative regulation of cellular amide metabolic process | 80/3246 | 273/18723 | 6.33e-07 | 1.32e-05 | 80 |
| GO:001714812 | Prostate | Tumor | negative regulation of translation | 71/3246 | 245/18723 | 4.08e-06 | 6.51e-05 | 71 |
| GO:004349114 | Prostate | Tumor | protein kinase B signaling | 60/3246 | 211/18723 | 4.05e-05 | 4.62e-04 | 60 |
| GO:005189613 | Prostate | Tumor | regulation of protein kinase B signaling | 54/3246 | 185/18723 | 4.44e-05 | 5.02e-04 | 54 |
| GO:000268314 | Prostate | Tumor | negative regulation of immune system process | 101/3246 | 434/18723 | 8.70e-04 | 5.85e-03 | 101 |
| GO:004341012 | Prostate | Tumor | positive regulation of MAPK cascade | 110/3246 | 480/18723 | 9.41e-04 | 6.18e-03 | 110 |
| Page: 1 |
| Pathway ID | Tissue | Disease Stage | Description | Gene Ratio | Bg Ratio | pvalue | p.adjust | qvalue | Count |
| Page: 1 |
Top |
Cell-cell communication analysis |
| Identification of potential cell-cell interactions between two cell types and their ligand-receptor pairs for different disease states |
| Ligand | Receptor | LRpair | Pathway | Tissue | Disease Stage |
| Page: 1 |
Top |
Single-cell gene regulatory network inference analysis |
| Find out the significant the regulons (TFs) and the target genes of each regulon across cell types for different disease states |
| TF | Cell Type | Tissue | Disease Stage | Target Gene | RSS | Regulon Activity |
| ∗The dot plots of a searched regulon are shown for all cell subpopulations in each disease state of each tissue based on the regulon specific score inferred using pySCENIC and by calculating the average expression. |
| Page: 1 |
Top |
Somatic mutation of malignant transformation related genes |
| Annotation of somatic variants for genes involved in malignant transformation |
| Hugo Symbol | Variant Class | Variant Classification | dbSNP RS | HGVSc | HGVSp | HGVSp Short | SWISSPROT | BIOTYPE | SIFT | PolyPhen | Tumor Sample Barcode | Tissue | Histology | Sex | Age | Stage | Therapy Types | Drugs | Outcome |
| BANK1 | SNV | Missense_Mutation | novel | c.317N>T | p.His106Leu | p.H106L | Q8NDB2 | protein_coding | tolerated(0.17) | benign(0.229) | TCGA-A7-A26I-01 | Breast | breast invasive carcinoma | Female | >=65 | I/II | Chemotherapy | cytoxan | SD |
| BANK1 | SNV | Missense_Mutation | novel | c.318N>G | p.His106Gln | p.H106Q | Q8NDB2 | protein_coding | tolerated(0.44) | benign(0.031) | TCGA-A7-A26I-01 | Breast | breast invasive carcinoma | Female | >=65 | I/II | Chemotherapy | cytoxan | SD |
| BANK1 | SNV | Missense_Mutation | novel | c.1687N>C | p.Glu563Gln | p.E563Q | Q8NDB2 | protein_coding | deleterious(0.02) | benign(0.026) | TCGA-A8-A0A7-01 | Breast | breast invasive carcinoma | Female | <65 | I/II | Unknown | Unknown | SD |
| BANK1 | SNV | Missense_Mutation | c.1091A>G | p.Gln364Arg | p.Q364R | Q8NDB2 | protein_coding | tolerated(0.09) | benign(0.015) | TCGA-AN-A0XU-01 | Breast | breast invasive carcinoma | Female | <65 | I/II | Unknown | Unknown | SD | |
| BANK1 | SNV | Missense_Mutation | c.2213N>G | p.Asn738Ser | p.N738S | Q8NDB2 | protein_coding | deleterious(0.01) | benign(0.053) | TCGA-B6-A0IJ-01 | Breast | breast invasive carcinoma | Female | <65 | I/II | Unknown | Unknown | SD | |
| BANK1 | SNV | Missense_Mutation | c.1351N>A | p.Glu451Lys | p.E451K | Q8NDB2 | protein_coding | tolerated(0.2) | benign(0.009) | TCGA-BH-A18V-01 | Breast | breast invasive carcinoma | Female | <65 | I/II | Unknown | Unknown | SD | |
| BANK1 | SNV | Missense_Mutation | c.1770N>A | p.Met590Ile | p.M590I | Q8NDB2 | protein_coding | tolerated(0.31) | benign(0.007) | TCGA-C8-A12Z-01 | Breast | breast invasive carcinoma | Female | <65 | I/II | Chemotherapy | 5-fluorouracil | CR | |
| BANK1 | SNV | Missense_Mutation | c.1018T>G | p.Phe340Val | p.F340V | Q8NDB2 | protein_coding | tolerated(0.2) | benign(0.005) | TCGA-D8-A1JN-01 | Breast | breast invasive carcinoma | Female | >=65 | III/IV | Hormone Therapy | anastrozolum | SD | |
| BANK1 | SNV | Missense_Mutation | c.1567N>A | p.Leu523Met | p.L523M | Q8NDB2 | protein_coding | tolerated(0.13) | benign(0.197) | TCGA-E2-A159-01 | Breast | breast invasive carcinoma | Female | <65 | I/II | Chemotherapy | cyclophosphamide | SD | |
| BANK1 | SNV | Missense_Mutation | rs777895274 | c.707N>A | p.Arg236His | p.R236H | Q8NDB2 | protein_coding | tolerated(0.26) | benign(0) | TCGA-EW-A6SA-01 | Breast | breast invasive carcinoma | Male | <65 | I/II | Unknown | Unknown | SD |
| Page: 1 2 3 4 5 6 7 8 9 10 11 12 |
Top |
Related drugs of malignant transformation related genes |
| Identification of chemicals and drugs interact with genes involved in malignant transfromation |
| (DGIdb 4.0) |
| Entrez ID | Symbol | Category | Interaction Types | Drug Claim Name | Drug Name | PMIDs |
| Page: 1 |

Copyright 2023-Present -The University of Texas Health Science Center at Houston |