Schematic overview of the cellular and molecular mechanisms involved in the cancer progression, including the proposed cellular and molecular mechanisms in cancer cells trajectory. AT1: alveolar type 1 cells; AT2: alveolar type 2 cells; AAH: atypical adenomatous hyperplasia; AIS: adenocarcinoma in situ; MIA: minimally invasive adenocarcinoma; IA: invasive adenocarcinoma; EMT: epithelial-mesenchymal transition

Home

Download

Statistics

Help

Contact

Center for Computational Systems Medicine
leaf

Gene summary

leaf

Malignant transformation analysis

leaf

Malignant transformation related pathway analysis

leaf

Cell-cell communication analysis

leaf

Single-cell gene regulatory network inference analysis

leaf

Somatic mutation of malignant transformation related genes

leaf

Related drugs of malignant transformation related genes

Gene: BAG6

Gene summary for BAG6

check button Gene summary.

Gene informationSpeciesHuman
Gene symbol

BAG6

Gene ID

7917

Gene nameBAG cochaperone 6
Gene AliasBAG-6
Cytomap6p21.33
Gene Typeprotein-coding
GO ID

GO:0000003

UniProtAcc

A0A1U9X7A6


Top

Malignant transformation analysis

check button Identification of the aberrant gene expression in precancerous and cancerous lesions by comparing the gene expression of stem-like cells in diseased tissues with normal stem cells
check button Malignant transformation involving gene list.
Entrez IDSymbolReplicatesSpeciesOrganTissueAdj P-valueLog2FCMalignancy
7917BAG6HTA11_3410_2000001011HumanColorectumAD1.73e-031.34e-010.0155
7917BAG6HTA11_2487_2000001011HumanColorectumSER4.47e-053.80e-01-0.1808
7917BAG6HTA11_1938_2000001011HumanColorectumAD2.64e-104.76e-01-0.0811
7917BAG6HTA11_78_2000001011HumanColorectumAD2.22e-032.65e-01-0.1088
7917BAG6HTA11_347_2000001011HumanColorectumAD3.83e-134.11e-01-0.1954
7917BAG6HTA11_411_2000001011HumanColorectumSER2.22e-027.39e-01-0.2602
7917BAG6HTA11_3361_2000001011HumanColorectumAD3.57e-065.79e-01-0.1207
7917BAG6HTA11_83_2000001011HumanColorectumSER2.45e-023.14e-01-0.1526
7917BAG6HTA11_696_2000001011HumanColorectumAD8.01e-195.15e-01-0.1464
7917BAG6HTA11_866_2000001011HumanColorectumAD4.54e-063.06e-01-0.1001
7917BAG6HTA11_1391_2000001011HumanColorectumAD2.43e-146.85e-01-0.059
7917BAG6HTA11_2992_2000001011HumanColorectumSER3.86e-035.02e-01-0.1706
7917BAG6HTA11_5216_2000001011HumanColorectumSER4.75e-035.76e-01-0.1462
7917BAG6HTA11_546_2000001011HumanColorectumAD3.81e-064.63e-01-0.0842
7917BAG6HTA11_866_3004761011HumanColorectumAD4.16e-052.31e-010.096
7917BAG6HTA11_10711_2000001011HumanColorectumAD1.59e-033.05e-010.0338
7917BAG6HTA11_7696_3000711011HumanColorectumAD4.84e-083.61e-010.0674
7917BAG6HTA11_6818_2000001011HumanColorectumAD2.75e-023.64e-010.0112
7917BAG6HTA11_6818_2000001021HumanColorectumAD3.95e-085.52e-010.0588
7917BAG6HTA11_99999970781_79442HumanColorectumMSS2.05e-072.54e-010.294
Page: 1 2 3 4 5 6 7 8 

check button Transcriptomic changes along malignancy continuum.
TissueExpression DynamicsAbbreviation
Colorectum (GSE201348)The image shows the transcriptomic changes along malignancy continuum.log2FC in expression of this searched gene in stem-like cells from each diseased tissue sample relative to stem-like cells in normal samples in each tissue plotted against the malignancy continuum. Samples are colored based on if they are from different disease stage.
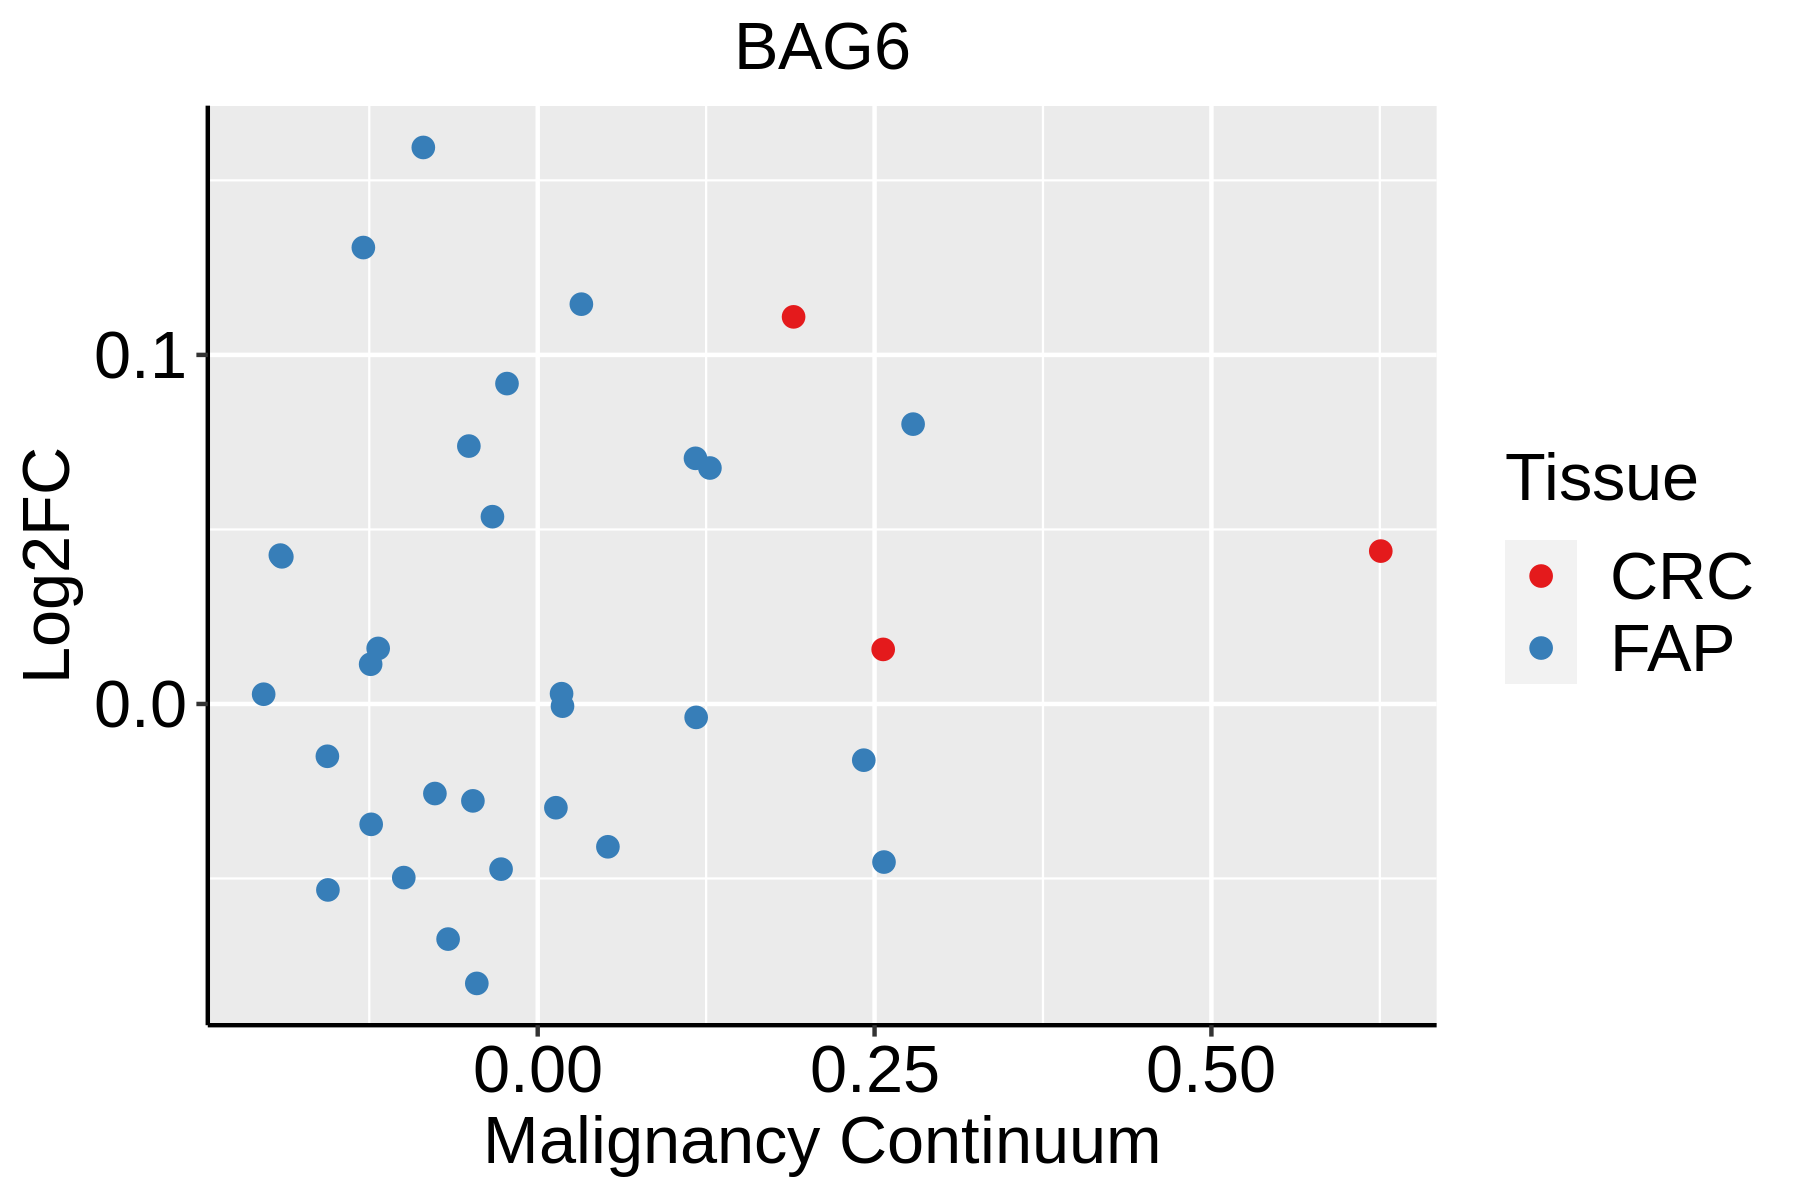
FAP: Familial adenomatous polyposis
CRC: Colorectal cancer
Colorectum (HTA11)The image shows the transcriptomic changes along malignancy continuum.log2FC in expression of this searched gene in stem-like cells from each diseased tissue sample relative to stem-like cells in normal samples in each tissue plotted against the malignancy continuum. Samples are colored based on if they are from different disease stage.AD: Adenomas
SER: Sessile serrated lesions
MSI-H: Microsatellite-high colorectal cancer
MSS: Microsatellite stable colorectal cancer
EsophagusThe image shows the transcriptomic changes along malignancy continuum.log2FC in expression of this searched gene in stem-like cells from each diseased tissue sample relative to stem-like cells in normal samples in each tissue plotted against the malignancy continuum. Samples are colored based on if they are from different disease stage.
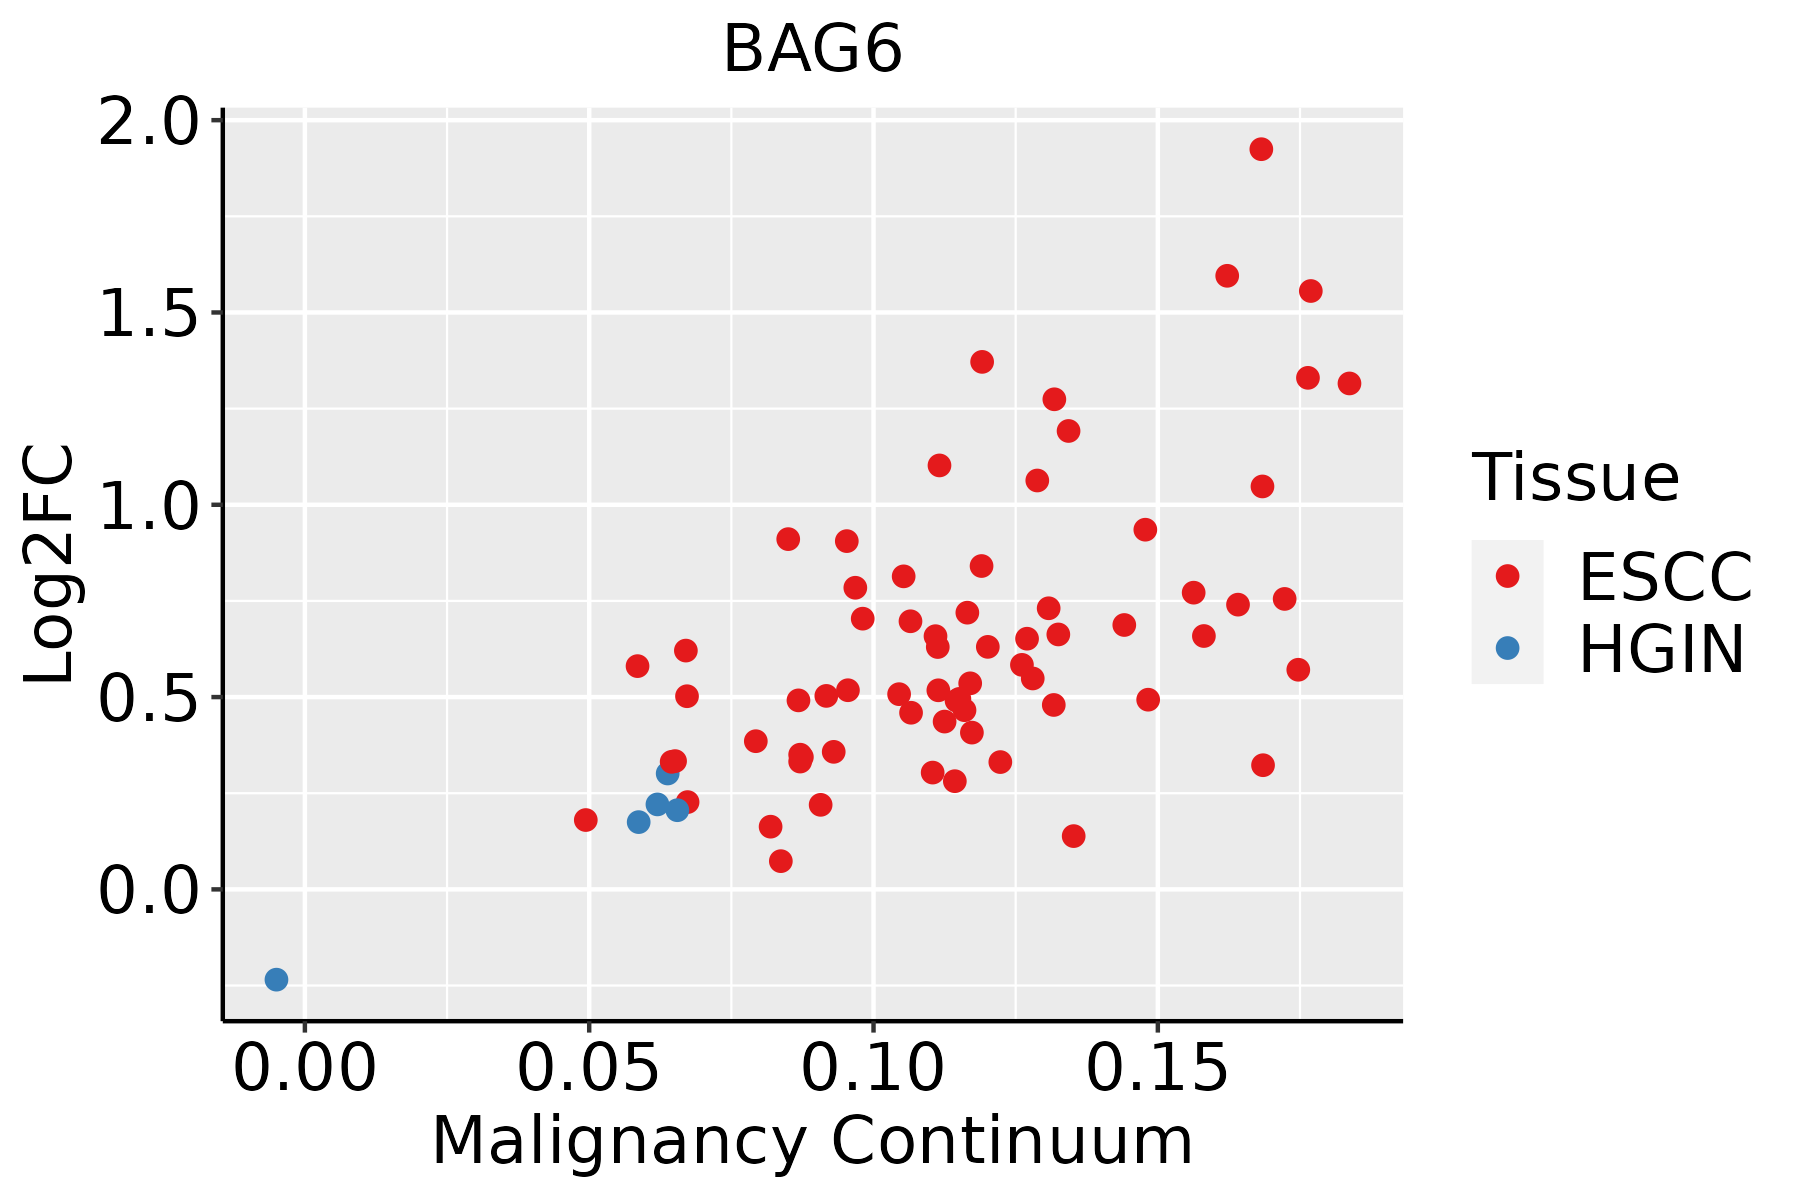
ESCC: Esophageal squamous cell carcinoma
HGIN: High-grade intraepithelial neoplasias
LGIN: Low-grade intraepithelial neoplasias
LiverThe image shows the transcriptomic changes along malignancy continuum.log2FC in expression of this searched gene in stem-like cells from each diseased tissue sample relative to stem-like cells in normal samples in each tissue plotted against the malignancy continuum. Samples are colored based on if they are from different disease stage.
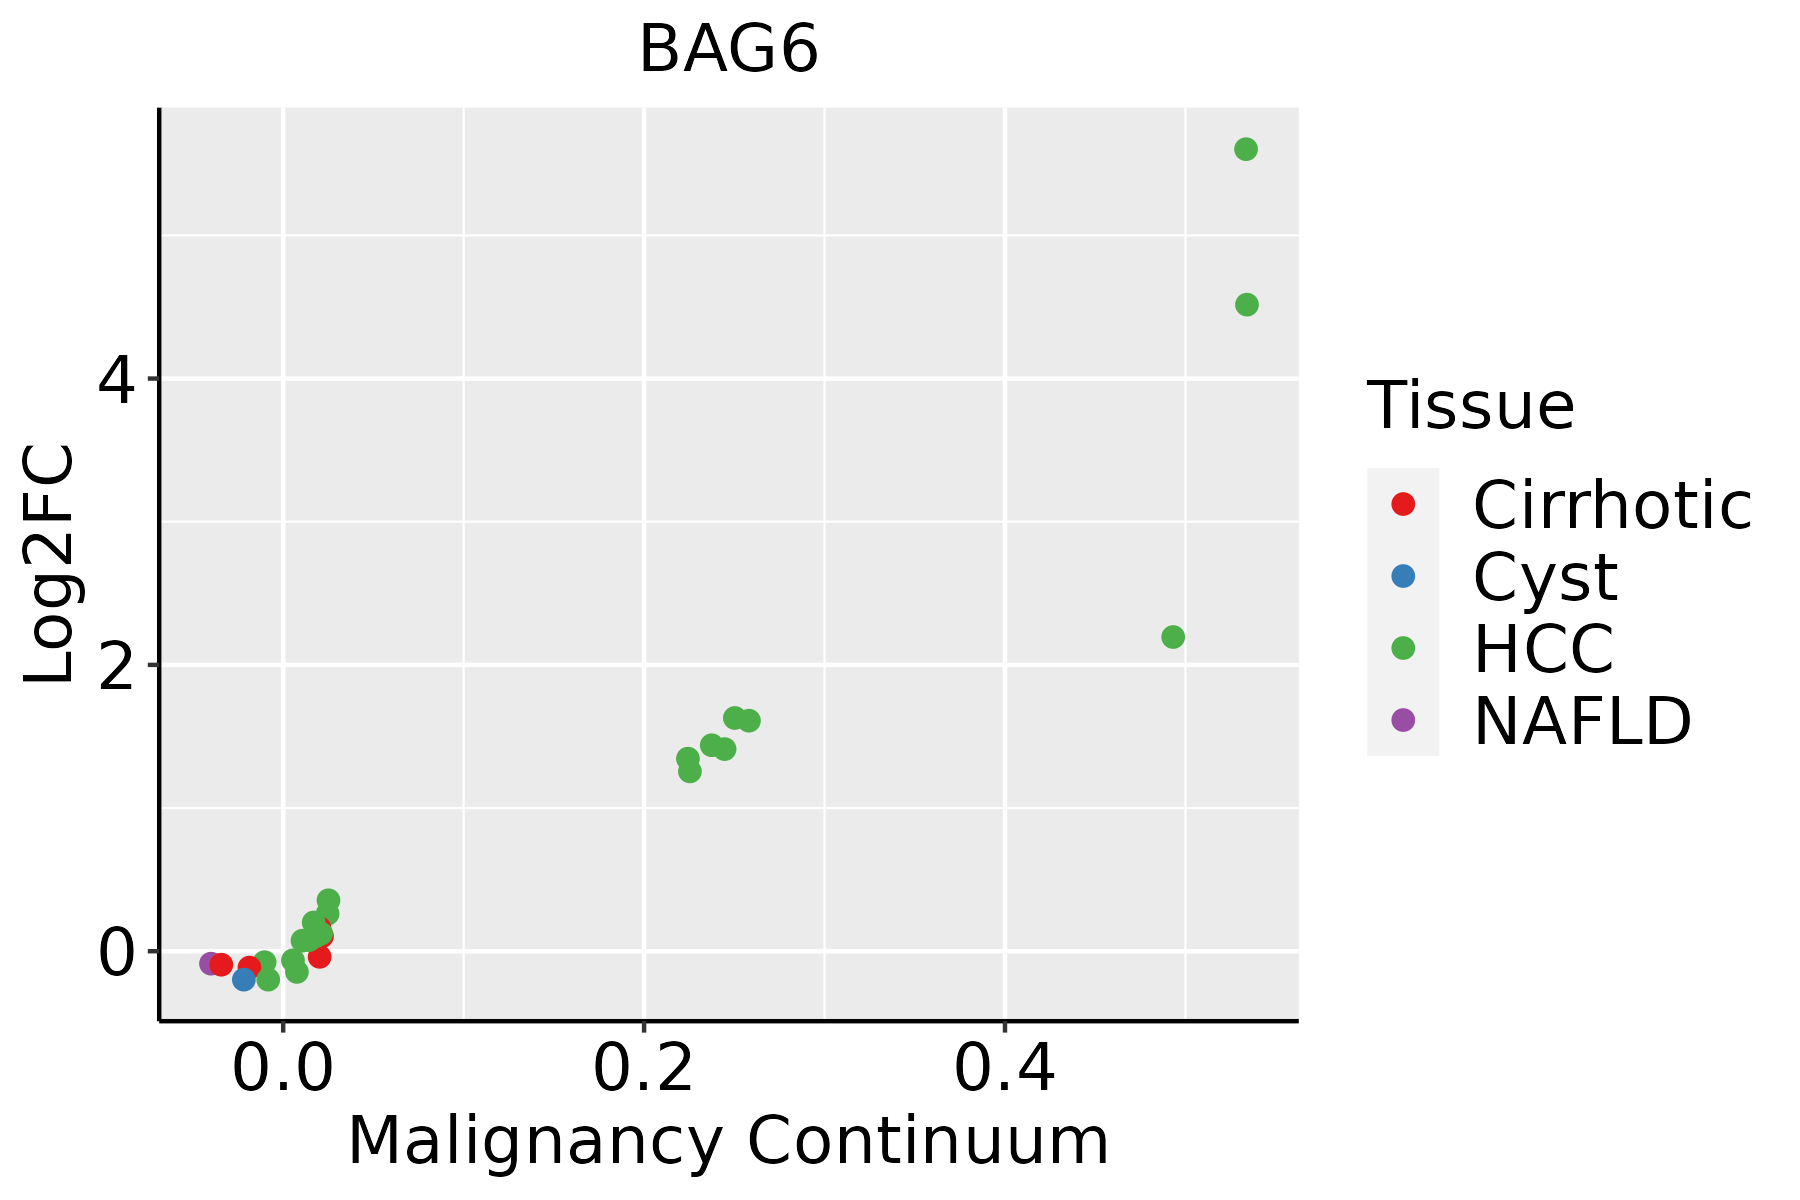
HCC: Hepatocellular carcinoma
NAFLD: Non-alcoholic fatty liver disease
Oral CavityThe image shows the transcriptomic changes along malignancy continuum.log2FC in expression of this searched gene in stem-like cells from each diseased tissue sample relative to stem-like cells in normal samples in each tissue plotted against the malignancy continuum. Samples are colored based on if they are from different disease stage.
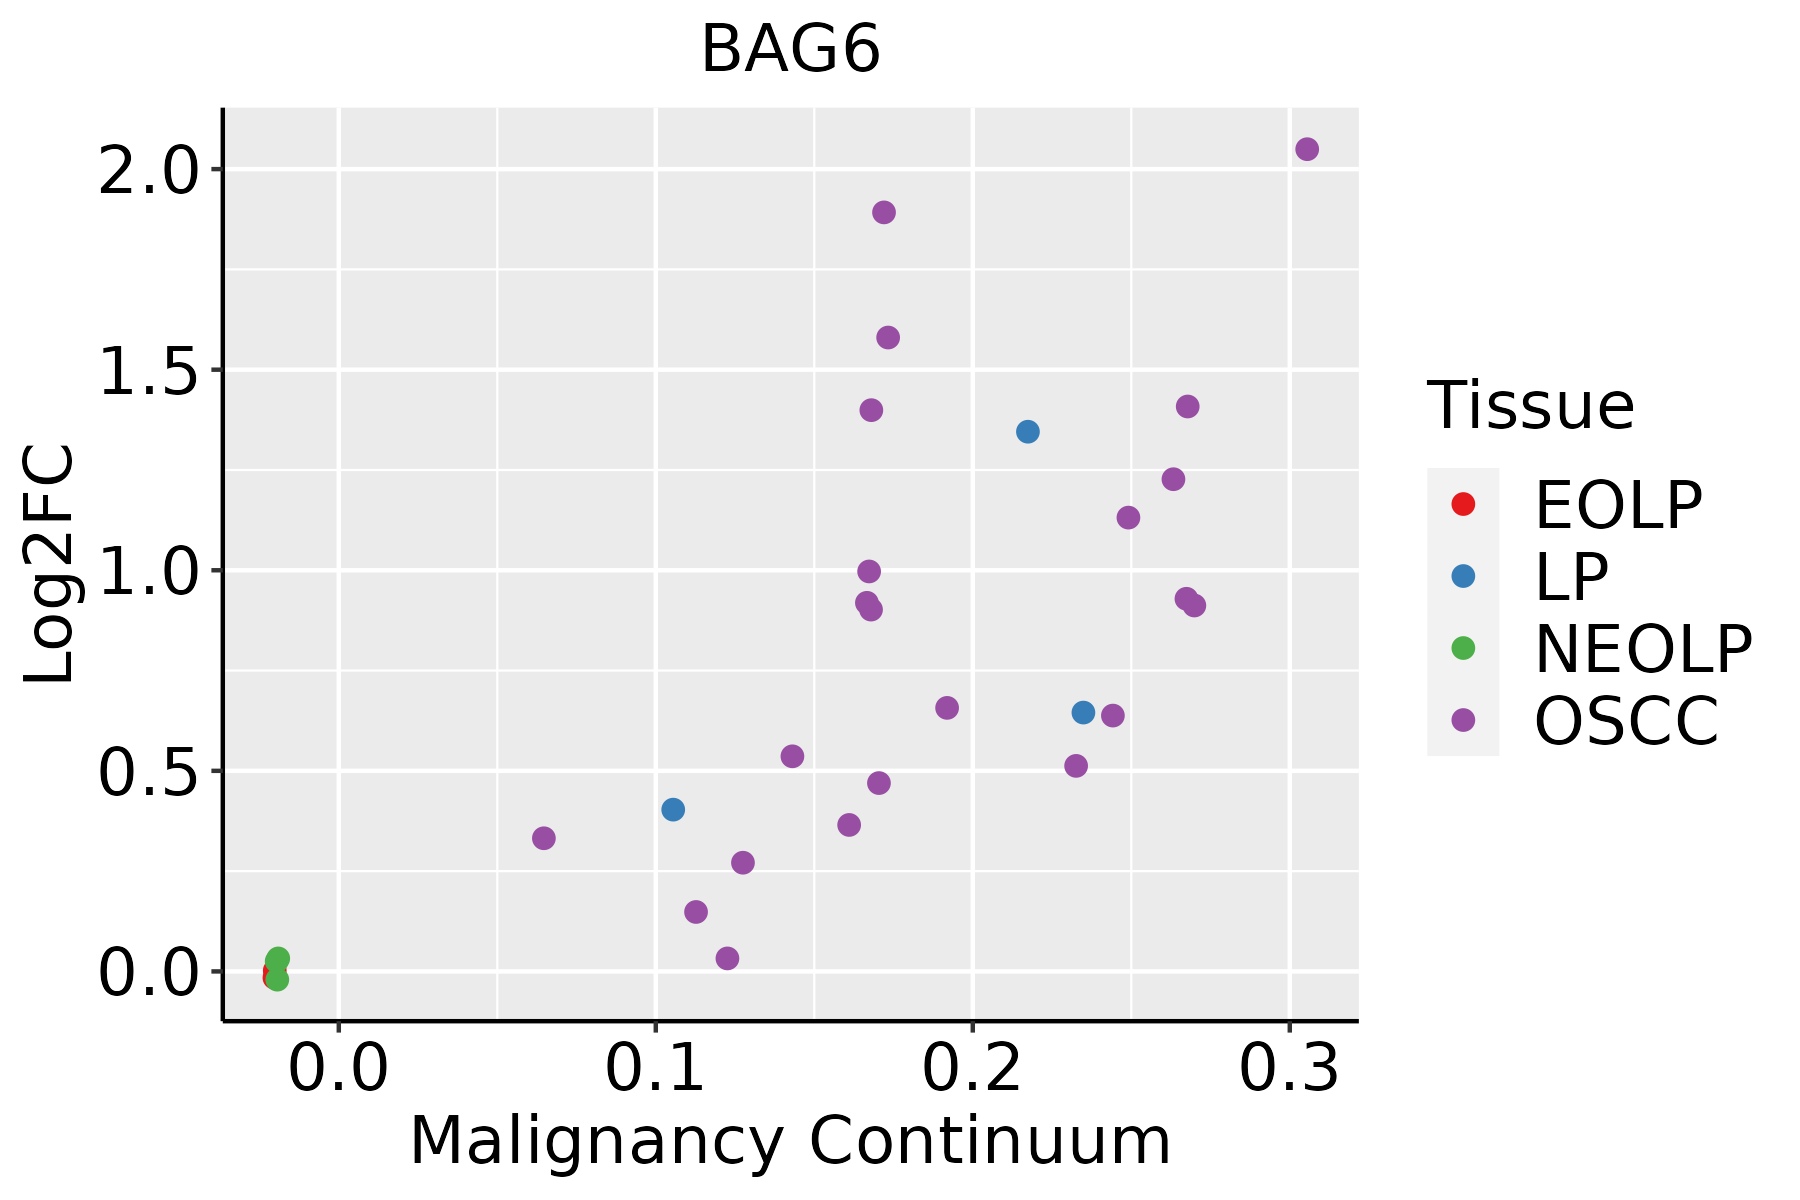
EOLP: Erosive Oral lichen planus
LP: leukoplakia
NEOLP: Non-erosive oral lichen planus
OSCC: Oral squamous cell carcinoma
SkinThe image shows the transcriptomic changes along malignancy continuum.log2FC in expression of this searched gene in stem-like cells from each diseased tissue sample relative to stem-like cells in normal samples in each tissue plotted against the malignancy continuum. Samples are colored based on if they are from different disease stage.AK: Actinic keratosis
cSCC: Cutaneous squamous cell carcinoma
SCCIS:squamous cell carcinoma in situ
ThyroidThe image shows the transcriptomic changes along malignancy continuum.log2FC in expression of this searched gene in stem-like cells from each diseased tissue sample relative to stem-like cells in normal samples in each tissue plotted against the malignancy continuum. Samples are colored based on if they are from different disease stage.
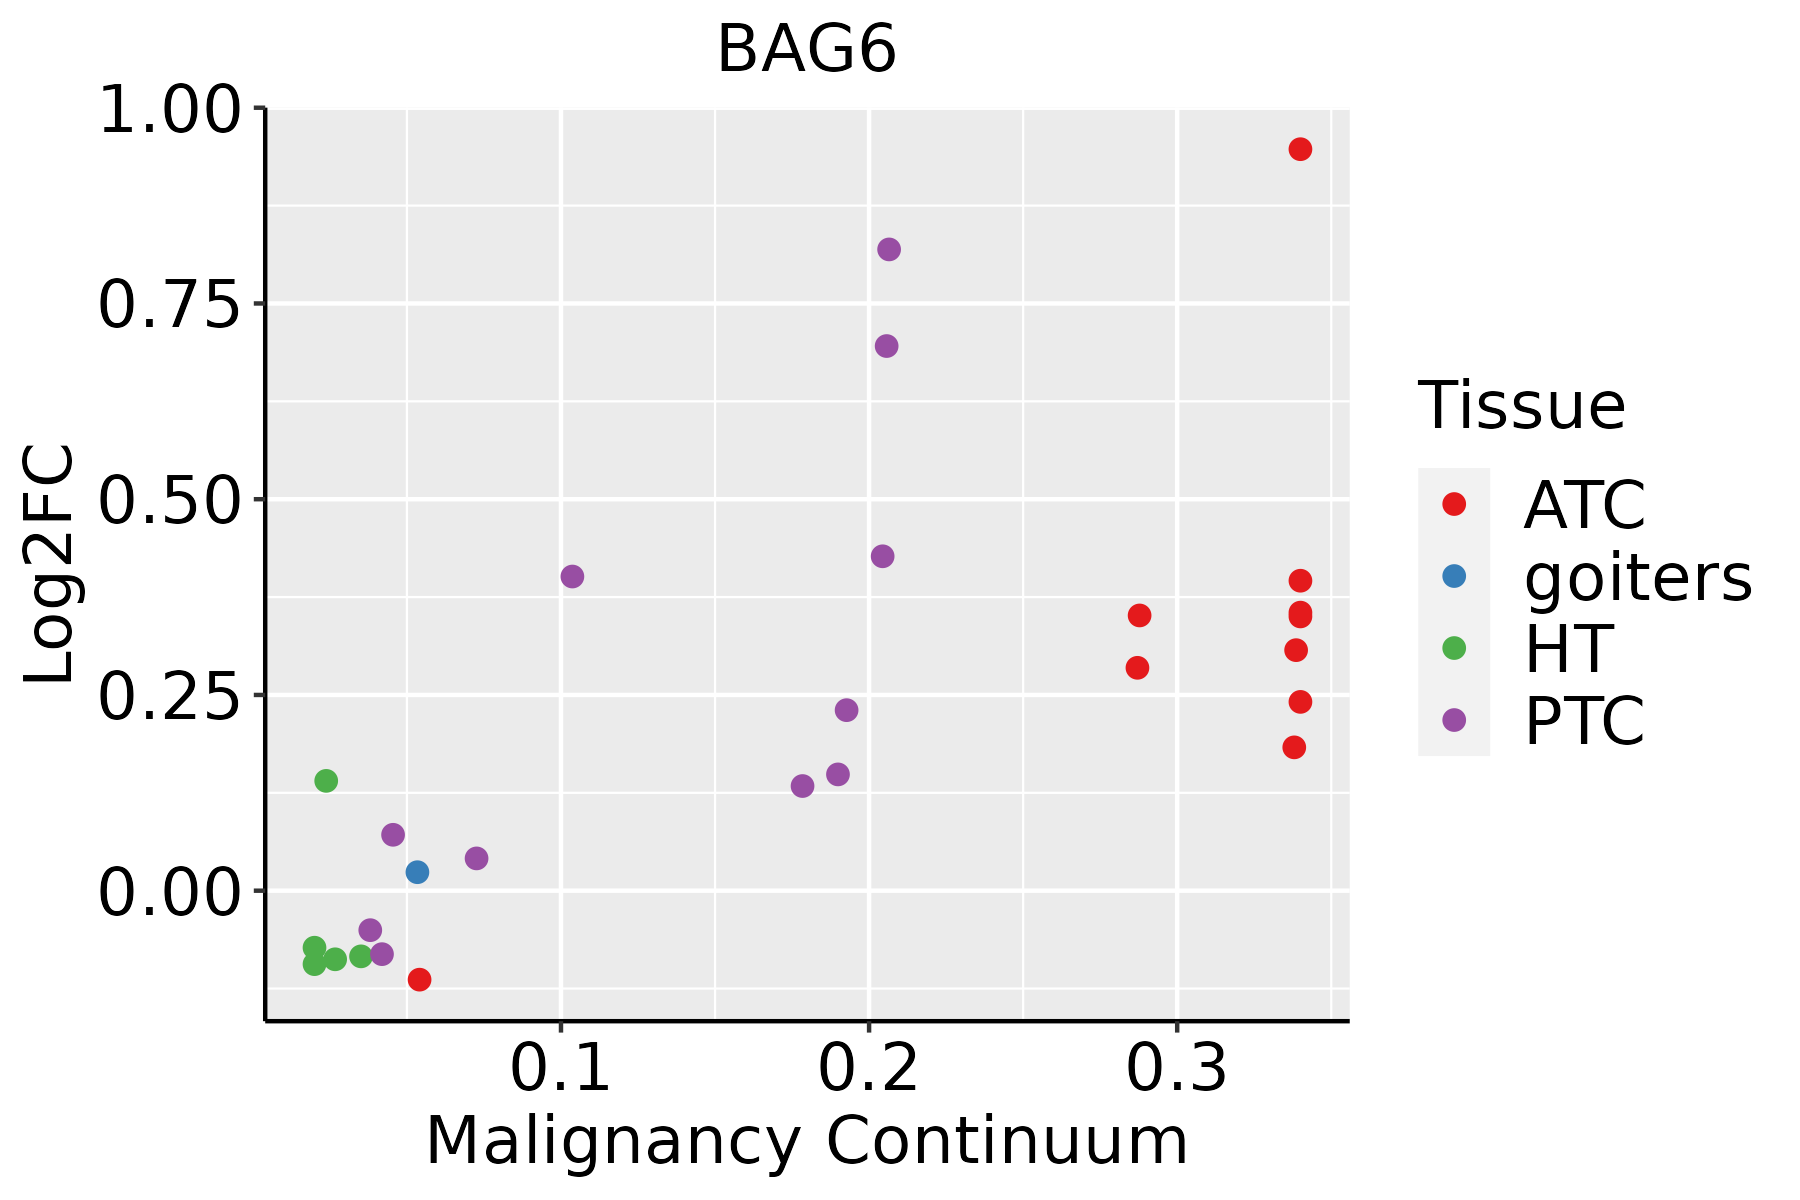
ATC: Anaplastic thyroid cancer
HT: Hashimoto's thyroiditis
PTC: Papillary thyroid cancer
∗log2FC in expression of this searched gene in stem-like cells from each diseased tissue sample relative to stem-like cells in normal samples in each tissue plotted against the malignancy continuum. Samples are colored based on if they are from different disease stage.

Top

Malignant transformation related pathway analysis

check buttonFind out the enriched GO biological processes and KEGG pathways involved in transition from healthy to precancer to cancer
check button Figure of enriched GO biological processes.
TissueDisease StageEnriched GO biological Processes
ColorectumADGO analysis - Figure of enriched GO biological processes: Top 15 enriched GO BP terms are showed in the bar plot of each disease state in each tissue. Each row represents a significant GO biological process which is colored according to the -log10(p.adjust).
ColorectumSERGO analysis - Figure of enriched GO biological processes: Top 15 enriched GO BP terms are showed in the bar plot of each disease state in each tissue. Each row represents a significant GO biological process which is colored according to the -log10(p.adjust).
ColorectumMSSGO analysis - Figure of enriched GO biological processes: Top 15 enriched GO BP terms are showed in the bar plot of each disease state in each tissue. Each row represents a significant GO biological process which is colored according to the -log10(p.adjust).
ColorectumMSI-HGO analysis - Figure of enriched GO biological processes: Top 15 enriched GO BP terms are showed in the bar plot of each disease state in each tissue. Each row represents a significant GO biological process which is colored according to the -log10(p.adjust).
ColorectumFAPGO analysis - Figure of enriched GO biological processes: Top 15 enriched GO BP terms are showed in the bar plot of each disease state in each tissue. Each row represents a significant GO biological process which is colored according to the -log10(p.adjust).
∗Top 15 enriched GO BP terms are showed in the bar plot of each disease state in each tissue. Each row represents a significant GO biological process which is colored according to the -log10(p.adjust).
Page: 1 2 3 4 5 6 7 8 9 

check button Enriched GO biological processes.
GO IDTissueDisease StageDescriptionGene RatioBg Ratiopvaluep.adjustCount
GO:0042176ColorectumADregulation of protein catabolic process160/3918391/187231.06e-197.34e-17160
GO:0009896ColorectumADpositive regulation of catabolic process180/3918492/187234.33e-161.94e-13180
GO:1903362ColorectumADregulation of cellular protein catabolic process109/3918255/187232.14e-156.08e-13109
GO:0010498ColorectumADproteasomal protein catabolic process174/3918490/187233.18e-147.66e-12174
GO:0031331ColorectumADpositive regulation of cellular catabolic process156/3918427/187234.68e-141.05e-11156
GO:0009895ColorectumADnegative regulation of catabolic process124/3918320/187231.66e-133.35e-11124
GO:1903050ColorectumADregulation of proteolysis involved in cellular protein catabolic process92/3918221/187232.04e-123.19e-1092
GO:0031330ColorectumADnegative regulation of cellular catabolic process104/3918262/187232.66e-123.96e-10104
GO:0045732ColorectumADpositive regulation of protein catabolic process92/3918231/187233.85e-114.47e-0992
GO:0090150ColorectumADestablishment of protein localization to membrane100/3918260/187236.01e-116.33e-09100
GO:0097193ColorectumADintrinsic apoptotic signaling pathway108/3918288/187236.25e-116.41e-09108
GO:0043161ColorectumADproteasome-mediated ubiquitin-dependent protein catabolic process141/3918412/187231.77e-101.68e-08141
GO:0045862ColorectumADpositive regulation of proteolysis129/3918372/187234.04e-103.46e-08129
GO:0031647ColorectumADregulation of protein stability108/3918298/187236.33e-105.08e-08108
GO:0042177ColorectumADnegative regulation of protein catabolic process55/3918121/187231.19e-098.85e-0855
GO:0061136ColorectumADregulation of proteasomal protein catabolic process75/3918187/187231.65e-091.20e-0775
GO:2000058ColorectumADregulation of ubiquitin-dependent protein catabolic process68/3918164/187231.82e-091.31e-0768
GO:1903363ColorectumADnegative regulation of cellular protein catabolic process39/391875/187232.69e-091.87e-0739
GO:0050821ColorectumADprotein stabilization73/3918191/187233.02e-081.64e-0673
GO:1903364ColorectumADpositive regulation of cellular protein catabolic process62/3918155/187234.66e-082.51e-0662
Page: 1 2 3 4 5 6 7 8 9 10 11 12 13 14 15 16 17 18 19 20 21 22 23 24 25 26 27 28 29 30 31 32 33 34 

check button Enriched KEGG pathways.
Pathway IDTissueDisease StageDescriptionGene RatioBg Ratiopvaluep.adjustqvalueCount
Page: 1 

Top

Cell-cell communication analysis

check buttonIdentification of potential cell-cell interactions between two cell types and their ligand-receptor pairs for different disease states
LigandReceptorLRpairPathwayTissueDisease Stage
BAG6NCR3BAG6_NCR3-PSBAGBreastHealthy
BAG6NCR3BAG6_NCR3-PSBAGCervixADJ
BAG6NCR3BAG6_NCR3-PSBAGEndometriumAEH
BAG6NCR3BAG6_NCR3-PSBAGEndometriumEEC
BAG6NCR3BAG6_NCR3-PSBAGEndometriumHealthy
BAG6NCR3BAG6_NCR3-PSBAGHNSCCOSCC
BAG6NCR3BAG6_NCR3-PSBAGLiverHealthy
BAG6NCR3BAG6_NCR3-PSBAGLungAAH
BAG6NCR3BAG6_NCR3-PSBAGTHCAADJ
Page: 1 

Top

Single-cell gene regulatory network inference analysis

check buttonFind out the significant the regulons (TFs) and the target genes of each regulon across cell types for different disease states
TFCell TypeTissueDisease StageTarget GeneRSSRegulon Activity
∗The dot plots of a searched regulon are shown for all cell subpopulations in each disease state of each tissue based on the regulon specific score inferred using pySCENIC and by calculating the average expression.
Page: 1 

Top

Somatic mutation of malignant transformation related genes

check buttonAnnotation of somatic variants for genes involved in malignant transformation
Hugo SymbolVariant ClassVariant ClassificationdbSNP RSHGVScHGVSpHGVSp ShortSWISSPROTBIOTYPESIFTPolyPhenTumor Sample BarcodeTissueHistologySexAgeStageTherapy TypesDrugsOutcome
BAG6SNVMissense_Mutationnovelc.418N>Tp.Leu140Phep.L140FP46379protein_codingdeleterious(0.01)probably_damaging(0.994)TCGA-5L-AAT1-01Breastbreast invasive carcinomaFemale<65III/IVHormone TherapyletrozolSD
BAG6SNVMissense_Mutationnovelc.1891A>Gp.Thr631Alap.T631AP46379protein_codingdeleterious(0.01)benign(0.421)TCGA-AC-A8OS-01Breastbreast invasive carcinomaFemale>=65I/IIUnknownUnknownSD
BAG6SNVMissense_Mutationnovelc.2693G>Ap.Arg898Glnp.R898QP46379protein_codingdeleterious(0.01)probably_damaging(0.963)TCGA-AN-A046-01Breastbreast invasive carcinomaFemale>=65I/IIUnknownUnknownSD
BAG6SNVMissense_Mutationnovelc.3131N>Cp.Ser1044Thrp.S1044TP46379protein_codingtolerated(0.61)probably_damaging(0.958)TCGA-AR-A0TY-01Breastbreast invasive carcinomaFemale<65I/IIUnspecificPaclitaxelPD
BAG6SNVMissense_Mutationc.1472N>Gp.Gln491Argp.Q491RP46379protein_codingdeleterious(0.01)benign(0.363)TCGA-D8-A27F-01Breastbreast invasive carcinomaFemale<65I/IIChemotherapyadriamycin+cyclophosphamideSD
BAG6insertionIn_Frame_Insnovelc.1720_1721insAAGTGCTGGAATTACAGGCGTGGGCTACCGCGCCCAGCCTGGTGTTTGTATp.Ser574delinsLysValLeuGluLeuGlnAlaTrpAlaThrAlaProSerLeuValPheValCysp.S574delinsKVLELQAWATAPSLVFVCP46379protein_codingTCGA-A2-A0CP-01Breastbreast invasive carcinomaFemale<65I/IIChemotherapycytoxanSD
BAG6insertionIn_Frame_Insnovelc.2166_2167insCCGGCTAATTTTTGTATTTTTAGTAGAGACAGGGTTTCACCATATTGGp.Ser722_Ser723insProAlaAsnPheCysIlePheSerArgAspArgValSerProTyrTrpp.S722_S723insPANFCIFSRDRVSPYWP46379protein_codingTCGA-A8-A06P-01Breastbreast invasive carcinomaFemale<65III/IVUnspecificSD
BAG6insertionFrame_Shift_Insnovelc.2533_2534insTTCCCCTGAGCCTCAGGTACTCTAGAGAGGGGGAGGTTGAGGGp.Gln845LeufsTer17p.Q845Lfs*17P46379protein_codingTCGA-BH-A0DP-01Breastbreast invasive carcinomaFemale<65I/IIHormone TherapyarimidexSD
BAG6SNVMissense_Mutationnovelc.95T>Gp.Ile32Serp.I32SP46379protein_codingtolerated(0.25)benign(0.007)TCGA-2W-A8YY-01Cervixcervical & endocervical cancerFemale<65I/IIChemotherapycisplatinCR
BAG6SNVMissense_Mutationrs745856906c.3307N>Tp.Arg1103Trpp.R1103WP46379protein_codingdeleterious(0)probably_damaging(0.965)TCGA-EK-A2RA-01Cervixcervical & endocervical cancerFemale>=65I/IIUnknownUnknownSD
Page: 1 2 3 4 5 6 7 8 9 10 

Top

Related drugs of malignant transformation related genes

check buttonIdentification of chemicals and drugs interact with genes involved in malignant transfromation
(DGIdb 4.0)
Entrez IDSymbolCategoryInteraction TypesDrug Claim NameDrug NamePMIDs
7917BAG6NAcarbamazepineCARBAMAZEPINE16538176
Page: 1