
|
|||||
|
 | |
| |
| |
| |
| |
| |
|
Gene: BAG3 |
Gene summary for BAG3 |
| Gene information | Species | Human | Gene symbol | BAG3 | Gene ID | 9531 |
| Gene name | BAG cochaperone 3 | |
| Gene Alias | BAG-3 | |
| Cytomap | 10q26.11 | |
| Gene Type | protein-coding | GO ID | GO:0000045 | UniProtAcc | O95817 |
Top |
Malignant transformation analysis |
| Identification of the aberrant gene expression in precancerous and cancerous lesions by comparing the gene expression of stem-like cells in diseased tissues with normal stem cells |
| Entrez ID | Symbol | Replicates | Species | Organ | Tissue | Adj P-value | Log2FC | Malignancy |
| 9531 | BAG3 | CA_HPV_3 | Human | Cervix | CC | 1.63e-02 | 1.44e-01 | 0.0414 |
| 9531 | BAG3 | sample1 | Human | Cervix | CC | 1.89e-31 | 1.13e+00 | 0.0959 |
| 9531 | BAG3 | T1 | Human | Cervix | CC | 2.28e-51 | 1.13e+00 | 0.0918 |
| 9531 | BAG3 | HTA11_1938_2000001011 | Human | Colorectum | AD | 4.45e-04 | 3.11e-01 | -0.0811 |
| 9531 | BAG3 | HTA11_1391_2000001011 | Human | Colorectum | AD | 5.06e-05 | 3.05e-01 | -0.059 |
| 9531 | BAG3 | HTA11_99999970781_79442 | Human | Colorectum | MSS | 2.97e-23 | 6.95e-01 | 0.294 |
| 9531 | BAG3 | HTA11_99999965104_69814 | Human | Colorectum | MSS | 2.48e-07 | 4.23e-01 | 0.281 |
| 9531 | BAG3 | HTA11_99999971662_82457 | Human | Colorectum | MSS | 1.45e-15 | 5.80e-01 | 0.3859 |
| 9531 | BAG3 | CRC-3-11773 | Human | Colorectum | CRC | 1.66e-07 | 4.94e-01 | 0.2564 |
| 9531 | BAG3 | LZE2D | Human | Esophagus | HGIN | 1.73e-06 | -4.13e-01 | 0.0642 |
| 9531 | BAG3 | LZE4T | Human | Esophagus | ESCC | 3.59e-08 | 1.19e+00 | 0.0811 |
| 9531 | BAG3 | LZE7T | Human | Esophagus | ESCC | 8.88e-07 | -3.63e-01 | 0.0667 |
| 9531 | BAG3 | LZE8T | Human | Esophagus | ESCC | 2.03e-15 | -4.65e-01 | 0.067 |
| 9531 | BAG3 | LZE20T | Human | Esophagus | ESCC | 1.71e-05 | 9.95e-01 | 0.0662 |
| 9531 | BAG3 | LZE22D1 | Human | Esophagus | HGIN | 4.24e-08 | -6.25e-01 | 0.0595 |
| 9531 | BAG3 | LZE24D1 | Human | Esophagus | HGIN | 6.69e-03 | 2.39e-01 | 0.054 |
| 9531 | BAG3 | LZE24T | Human | Esophagus | ESCC | 1.41e-11 | 1.08e+00 | 0.0596 |
| 9531 | BAG3 | LZE6T | Human | Esophagus | ESCC | 1.46e-05 | -4.21e-01 | 0.0845 |
| 9531 | BAG3 | P2T-E | Human | Esophagus | ESCC | 1.92e-24 | 9.81e-01 | 0.1177 |
| 9531 | BAG3 | P4T-E | Human | Esophagus | ESCC | 2.19e-48 | 2.80e+00 | 0.1323 |
| Page: 1 2 3 4 5 6 7 8 9 10 |
| Tissue | Expression Dynamics | Abbreviation |
| Cervix | 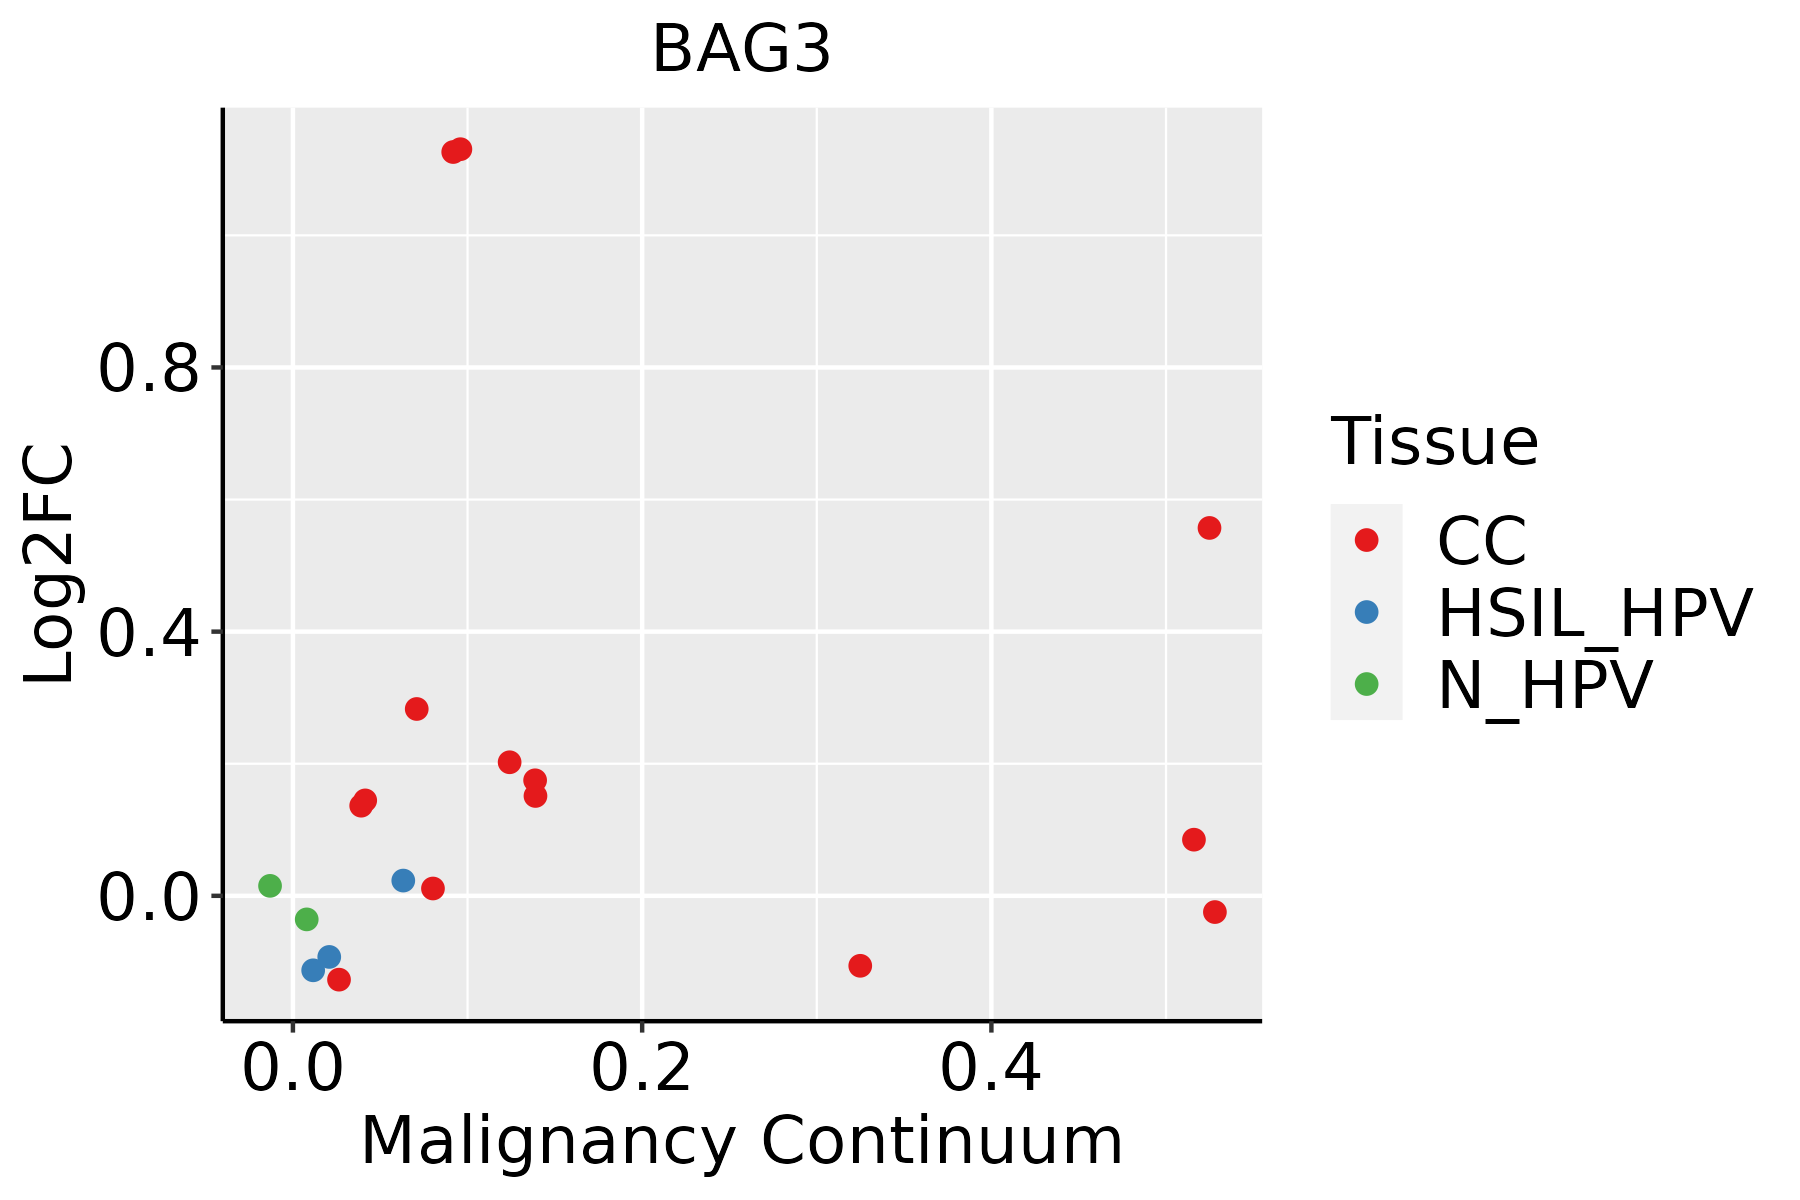 | CC: Cervix cancer |
| HSIL_HPV: HPV-infected high-grade squamous intraepithelial lesions | ||
| N_HPV: HPV-infected normal cervix | ||
| Colorectum (GSE201348) |  | FAP: Familial adenomatous polyposis |
| CRC: Colorectal cancer | ||
| Colorectum (HTA11) |  | AD: Adenomas |
| SER: Sessile serrated lesions | ||
| MSI-H: Microsatellite-high colorectal cancer | ||
| MSS: Microsatellite stable colorectal cancer | ||
| Esophagus | 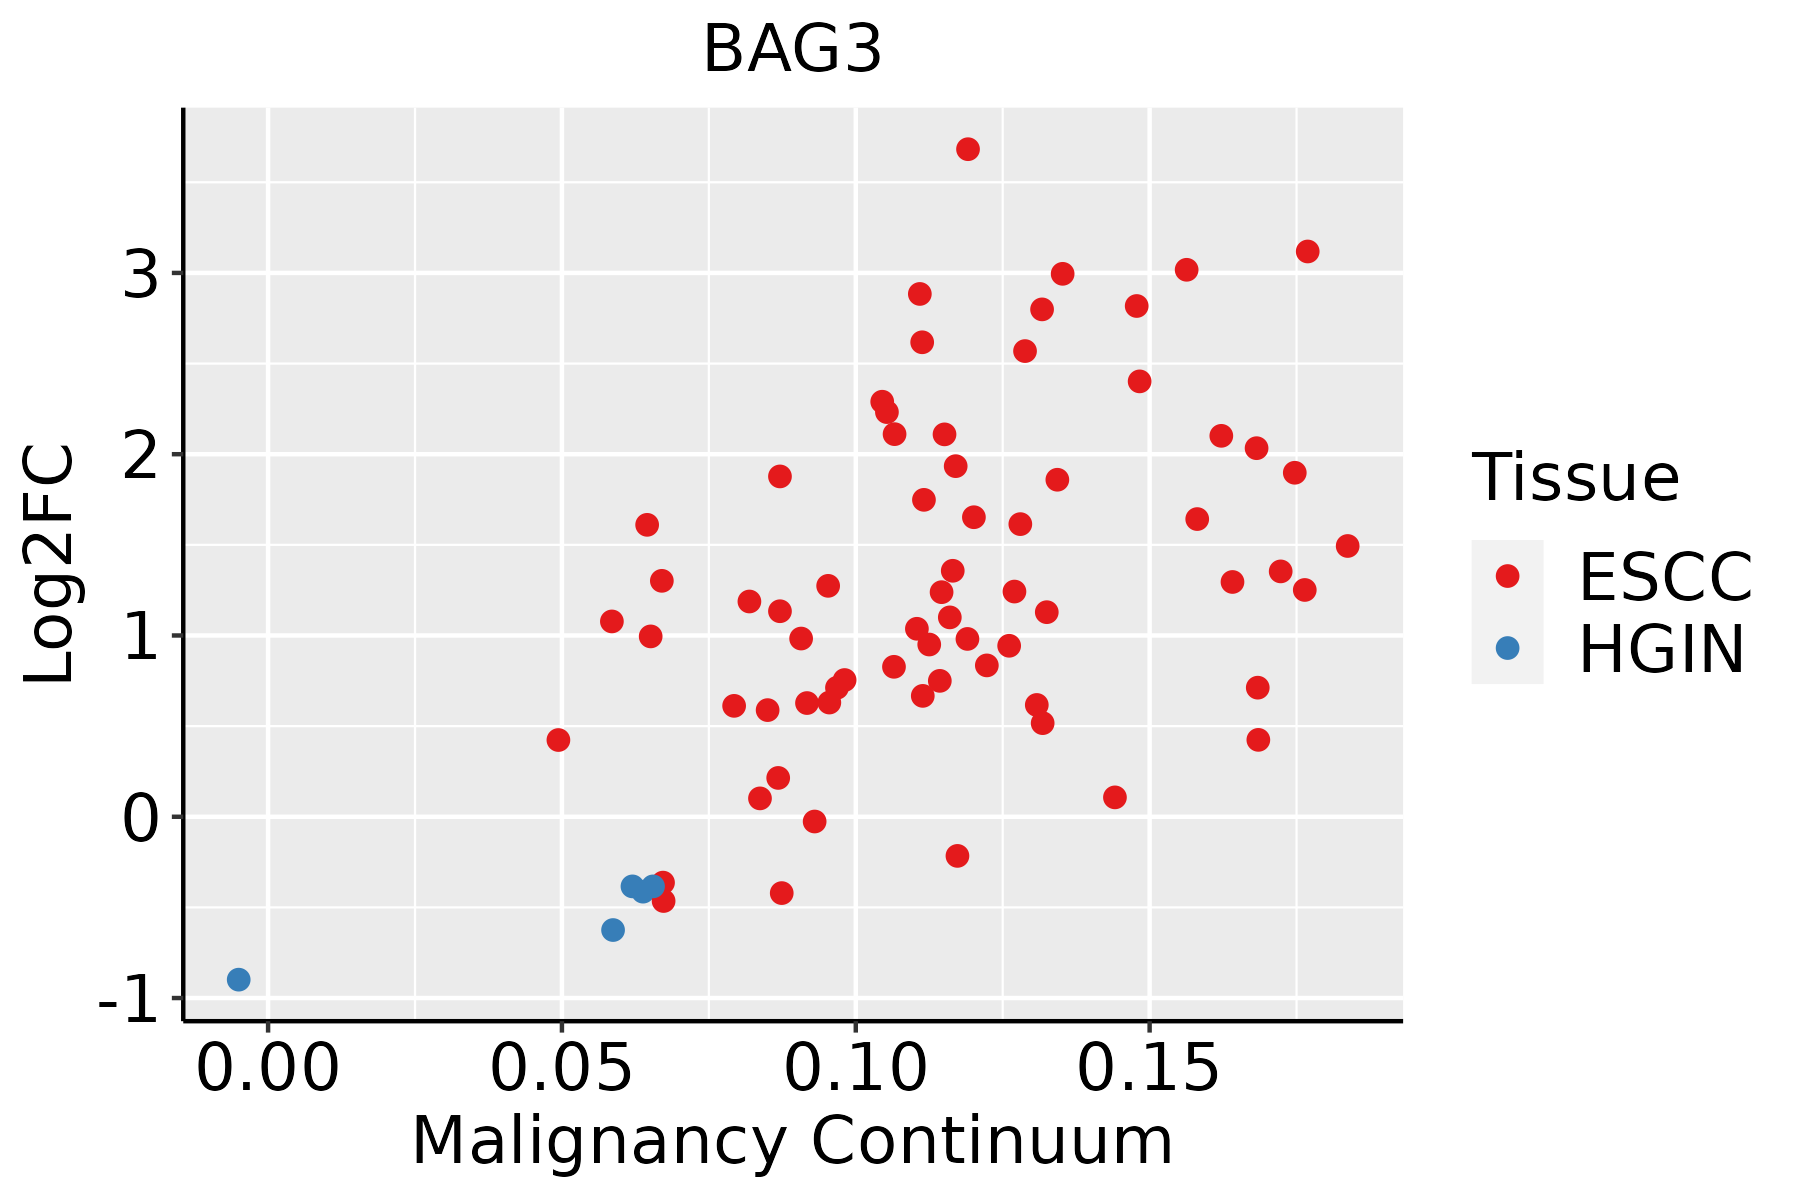 | ESCC: Esophageal squamous cell carcinoma |
| HGIN: High-grade intraepithelial neoplasias | ||
| LGIN: Low-grade intraepithelial neoplasias | ||
| GC | 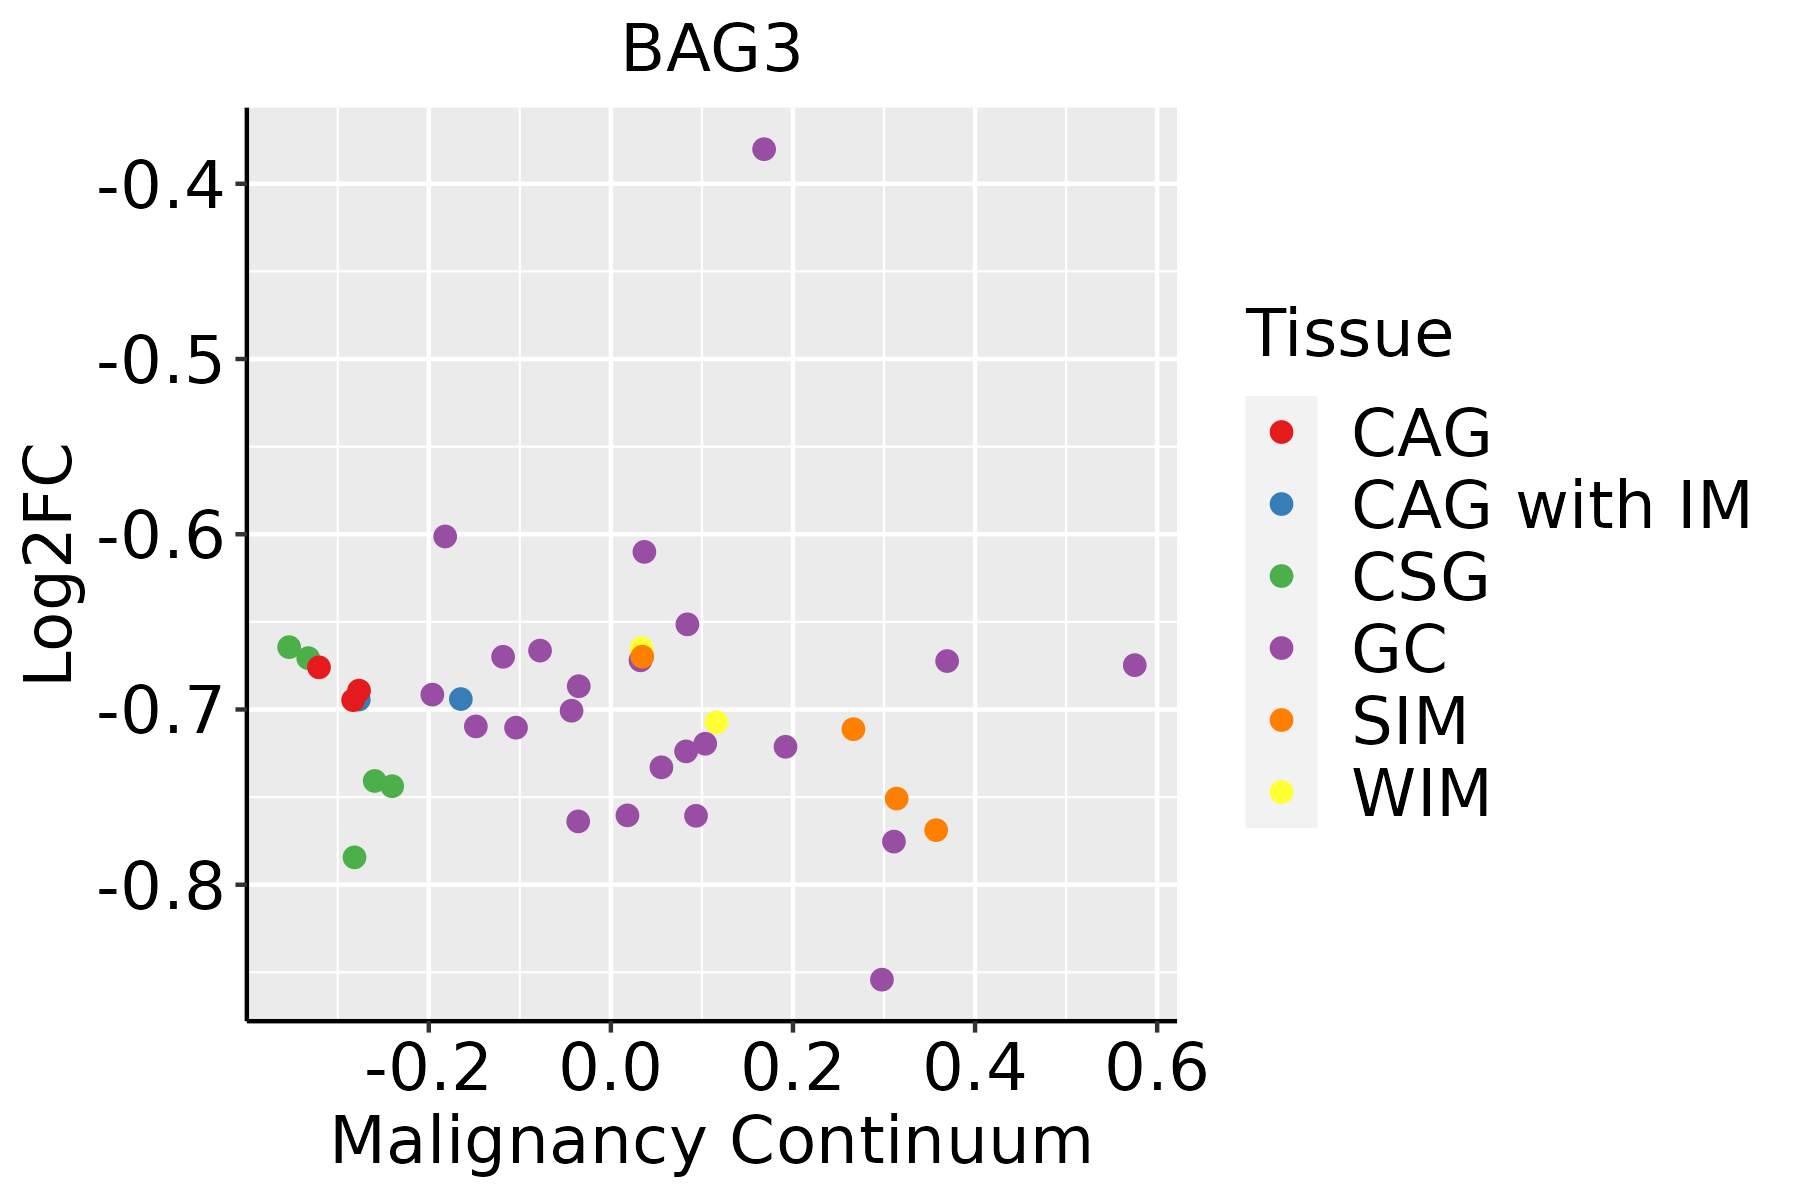 | CAG: Chronic atrophic gastritis |
| CAG with IM: Chronic atrophic gastritis with intestinal metaplasia | ||
| CSG: Chronic superficial gastritis | ||
| GC: Gastric cancer | ||
| SIM: Severe intestinal metaplasia | ||
| WIM: Wild intestinal metaplasia | ||
| Liver | 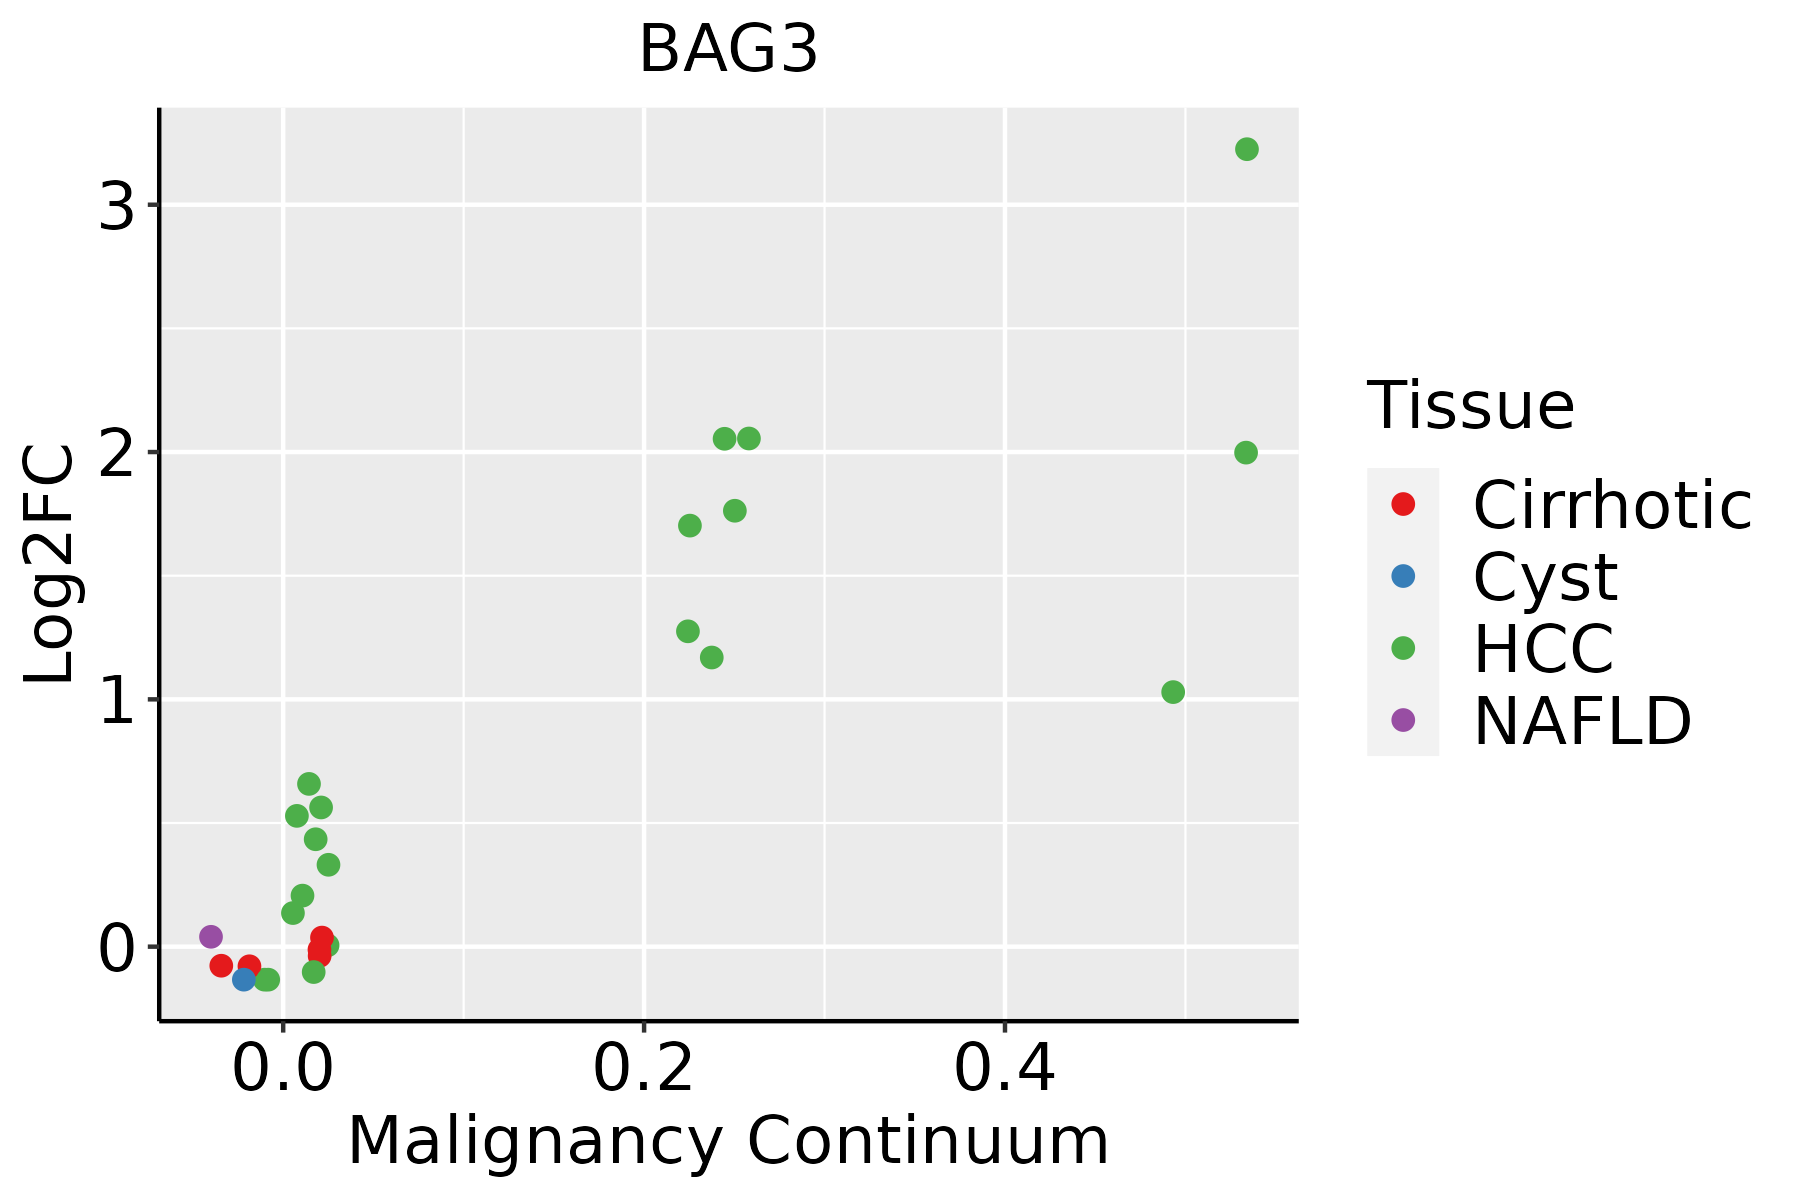 | HCC: Hepatocellular carcinoma |
| NAFLD: Non-alcoholic fatty liver disease | ||
| Oral Cavity |  | EOLP: Erosive Oral lichen planus |
| LP: leukoplakia | ||
| NEOLP: Non-erosive oral lichen planus | ||
| OSCC: Oral squamous cell carcinoma | ||
| Prostate | 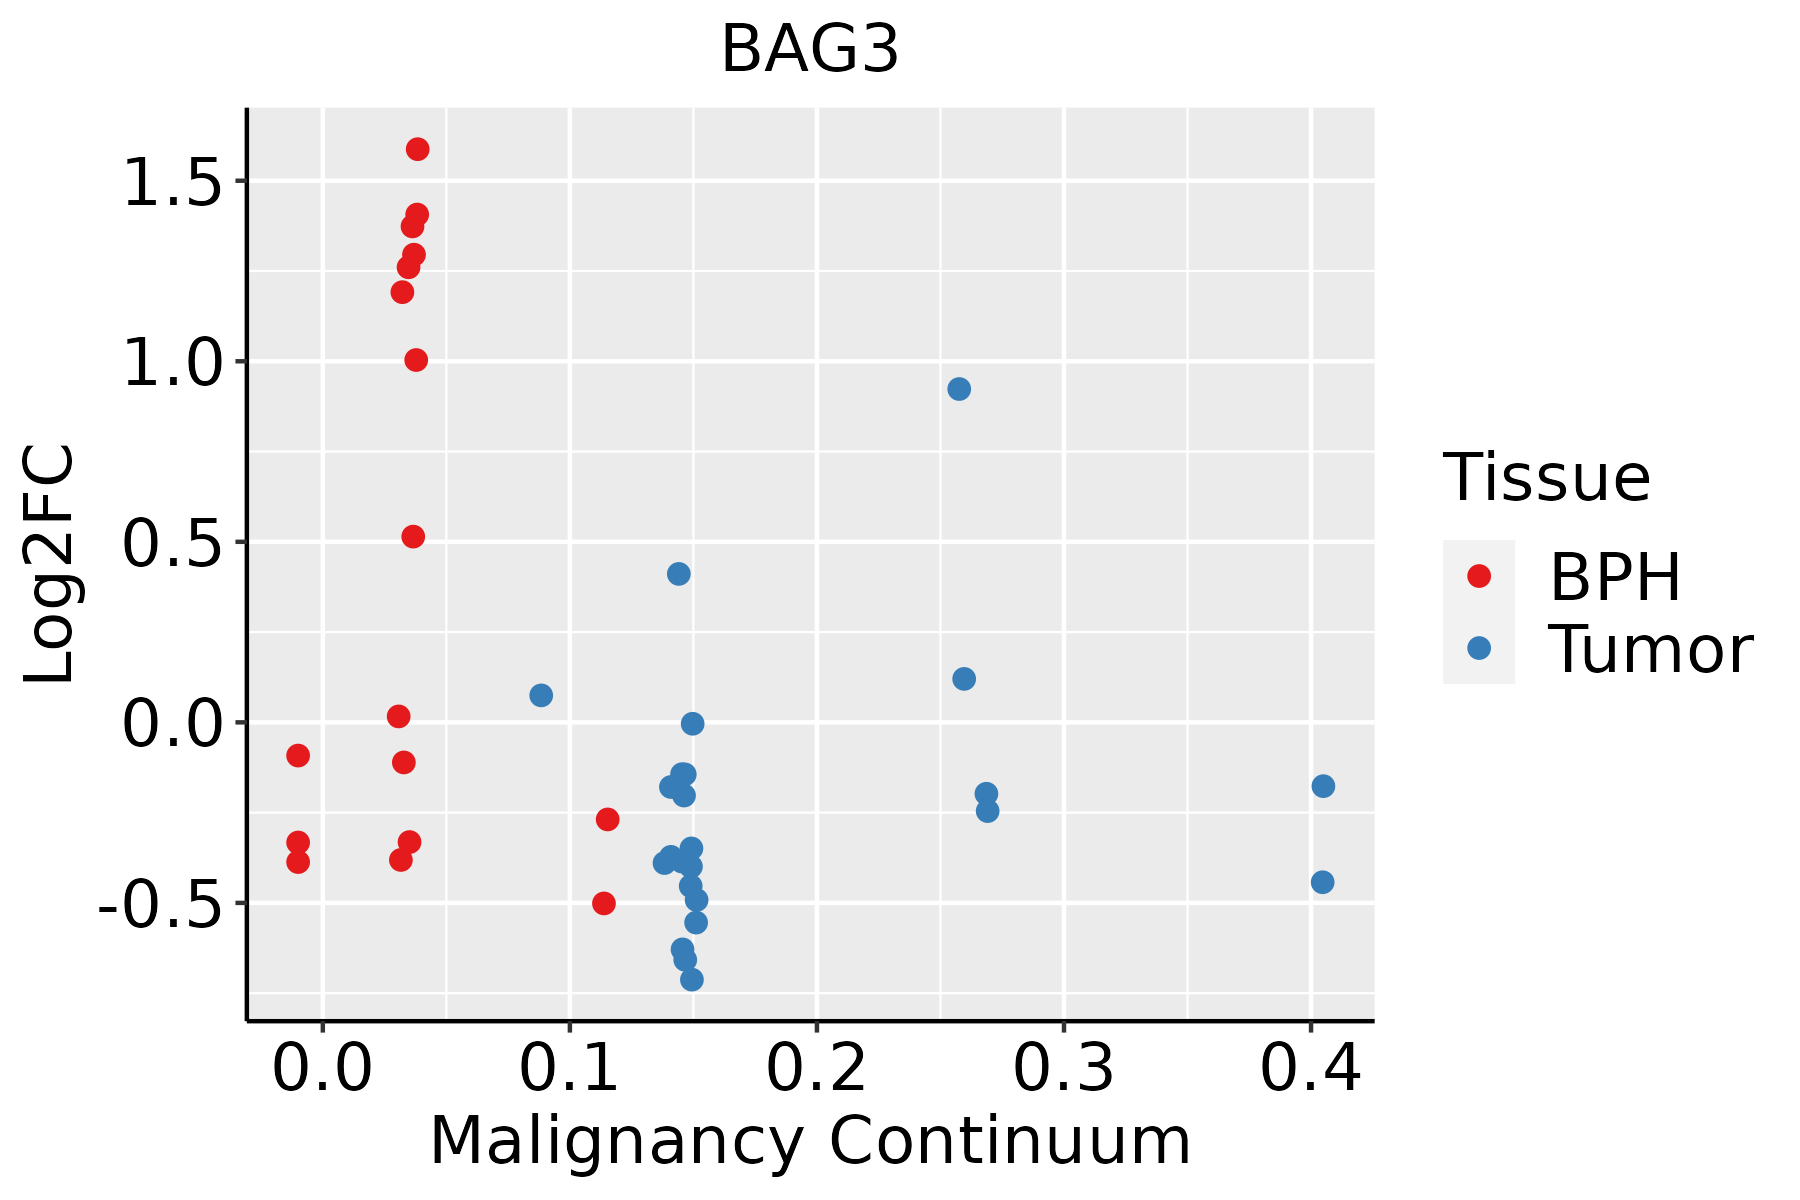 | BPH: Benign Prostatic Hyperplasia |
| Skin |  | AK: Actinic keratosis |
| cSCC: Cutaneous squamous cell carcinoma | ||
| SCCIS:squamous cell carcinoma in situ | ||
| Thyroid |  | ATC: Anaplastic thyroid cancer |
| HT: Hashimoto's thyroiditis | ||
| PTC: Papillary thyroid cancer |
| ∗log2FC in expression of this searched gene in stem-like cells from each diseased tissue sample relative to stem-like cells in normal samples in each tissue plotted against the malignancy continuum. Samples are colored based on if they are from different disease stage. |
Top |
Malignant transformation related pathway analysis |
| Find out the enriched GO biological processes and KEGG pathways involved in transition from healthy to precancer to cancer |
| Tissue | Disease Stage | Enriched GO biological Processes |
| Colorectum | AD |  |
| Colorectum | SER |  |
| Colorectum | MSS |  |
| Colorectum | MSI-H |  |
| Colorectum | FAP |  |
| ∗Top 15 enriched GO BP terms are showed in the bar plot of each disease state in each tissue. Each row represents a significant GO biological process which is colored according to the -log10(p.adjust). |
| Page: 1 2 3 4 5 6 7 8 9 |
| GO ID | Tissue | Disease Stage | Description | Gene Ratio | Bg Ratio | pvalue | p.adjust | Count |
| GO:00725949 | Cervix | CC | establishment of protein localization to organelle | 99/2311 | 422/18723 | 1.23e-10 | 2.11e-08 | 99 |
| GO:190382910 | Cervix | CC | positive regulation of cellular protein localization | 72/2311 | 276/18723 | 3.20e-10 | 4.46e-08 | 72 |
| GO:000989610 | Cervix | CC | positive regulation of catabolic process | 109/2311 | 492/18723 | 5.26e-10 | 6.99e-08 | 109 |
| GO:007149610 | Cervix | CC | cellular response to external stimulus | 78/2311 | 320/18723 | 1.82e-09 | 1.98e-07 | 78 |
| GO:005122210 | Cervix | CC | positive regulation of protein transport | 72/2311 | 303/18723 | 2.36e-08 | 1.70e-06 | 72 |
| GO:004361810 | Cervix | CC | regulation of transcription from RNA polymerase II promoter in response to stress | 21/2311 | 47/18723 | 3.85e-08 | 2.53e-06 | 21 |
| GO:00069139 | Cervix | CC | nucleocytoplasmic transport | 71/2311 | 301/18723 | 4.04e-08 | 2.54e-06 | 71 |
| GO:00511699 | Cervix | CC | nuclear transport | 71/2311 | 301/18723 | 4.04e-08 | 2.54e-06 | 71 |
| GO:004362010 | Cervix | CC | regulation of DNA-templated transcription in response to stress | 22/2311 | 53/18723 | 9.29e-08 | 5.19e-06 | 22 |
| GO:003133110 | Cervix | CC | positive regulation of cellular catabolic process | 91/2311 | 427/18723 | 9.64e-08 | 5.25e-06 | 91 |
| GO:190495110 | Cervix | CC | positive regulation of establishment of protein localization | 73/2311 | 319/18723 | 9.69e-08 | 5.25e-06 | 73 |
| GO:00345048 | Cervix | CC | protein localization to nucleus | 68/2311 | 290/18723 | 9.91e-08 | 5.25e-06 | 68 |
| GO:00068399 | Cervix | CC | mitochondrial transport | 60/2311 | 254/18723 | 4.21e-07 | 1.67e-05 | 60 |
| GO:009719110 | Cervix | CC | extrinsic apoptotic signaling pathway | 52/2311 | 219/18723 | 2.06e-06 | 6.34e-05 | 52 |
| GO:000660510 | Cervix | CC | protein targeting | 68/2311 | 314/18723 | 2.17e-06 | 6.55e-05 | 68 |
| GO:00468229 | Cervix | CC | regulation of nucleocytoplasmic transport | 31/2311 | 106/18723 | 2.68e-06 | 7.87e-05 | 31 |
| GO:00903167 | Cervix | CC | positive regulation of intracellular protein transport | 41/2311 | 160/18723 | 3.24e-06 | 8.80e-05 | 41 |
| GO:00323868 | Cervix | CC | regulation of intracellular transport | 71/2311 | 337/18723 | 3.70e-06 | 9.74e-05 | 71 |
| GO:000698610 | Cervix | CC | response to unfolded protein | 36/2311 | 137/18723 | 6.83e-06 | 1.63e-04 | 36 |
| GO:00712148 | Cervix | CC | cellular response to abiotic stimulus | 69/2311 | 331/18723 | 7.36e-06 | 1.73e-04 | 69 |
| Page: 1 2 3 4 5 6 7 8 9 10 11 12 13 14 15 16 17 18 19 20 21 22 23 24 25 26 27 28 29 30 31 32 33 34 35 36 37 38 39 40 41 42 43 44 45 46 47 48 49 50 51 52 53 54 55 56 57 58 59 60 61 62 63 64 65 66 67 68 69 70 71 72 73 |
| Pathway ID | Tissue | Disease Stage | Description | Gene Ratio | Bg Ratio | pvalue | p.adjust | qvalue | Count |
| Page: 1 |
Top |
Cell-cell communication analysis |
| Identification of potential cell-cell interactions between two cell types and their ligand-receptor pairs for different disease states |
| Ligand | Receptor | LRpair | Pathway | Tissue | Disease Stage |
| Page: 1 |
Top |
Single-cell gene regulatory network inference analysis |
| Find out the significant the regulons (TFs) and the target genes of each regulon across cell types for different disease states |
| TF | Cell Type | Tissue | Disease Stage | Target Gene | RSS | Regulon Activity |
| ∗The dot plots of a searched regulon are shown for all cell subpopulations in each disease state of each tissue based on the regulon specific score inferred using pySCENIC and by calculating the average expression. |
| Page: 1 |
Top |
Somatic mutation of malignant transformation related genes |
| Annotation of somatic variants for genes involved in malignant transformation |
| Hugo Symbol | Variant Class | Variant Classification | dbSNP RS | HGVSc | HGVSp | HGVSp Short | SWISSPROT | BIOTYPE | SIFT | PolyPhen | Tumor Sample Barcode | Tissue | Histology | Sex | Age | Stage | Therapy Types | Drugs | Outcome |
| BAG3 | SNV | Missense_Mutation | rs747274078 | c.289N>T | p.Pro97Ser | p.P97S | O95817 | protein_coding | deleterious(0) | probably_damaging(0.999) | TCGA-AN-A0XO-01 | Breast | breast invasive carcinoma | Female | <65 | III/IV | Unknown | Unknown | SD |
| BAG3 | insertion | Frame_Shift_Ins | novel | c.1428_1429insATCCGCAAAGAGGTGGATTCTAAAC | p.Arg477IlefsTer27 | p.R477Ifs*27 | O95817 | protein_coding | TCGA-A7-A0CJ-01 | Breast | breast invasive carcinoma | Female | <65 | I/II | Chemotherapy | cytoxan | SD | ||
| BAG3 | insertion | In_Frame_Ins | novel | c.456_457insGCTGGGATTACAGGCACC | p.Gly152_Gln153insAlaGlyIleThrGlyThr | p.G152_Q153insAGITGT | O95817 | protein_coding | TCGA-A8-A06Z-01 | Breast | breast invasive carcinoma | Female | >=65 | I/II | Unknown | Unknown | SD | ||
| BAG3 | SNV | Missense_Mutation | novel | c.637G>A | p.Glu213Lys | p.E213K | O95817 | protein_coding | deleterious(0) | probably_damaging(0.996) | TCGA-2W-A8YY-01 | Cervix | cervical & endocervical cancer | Female | <65 | I/II | Chemotherapy | cisplatin | CR |
| BAG3 | SNV | Missense_Mutation | novel | c.1091T>C | p.Val364Ala | p.V364A | O95817 | protein_coding | tolerated(0.15) | benign(0) | TCGA-2W-A8YY-01 | Cervix | cervical & endocervical cancer | Female | <65 | I/II | Chemotherapy | cisplatin | CR |
| BAG3 | SNV | Missense_Mutation | rs876657746 | c.362N>A | p.Arg121Gln | p.R121Q | O95817 | protein_coding | deleterious(0.05) | probably_damaging(0.944) | TCGA-AA-3510-01 | Colorectum | colon adenocarcinoma | Male | >=65 | I/II | Unknown | Unknown | SD |
| BAG3 | SNV | Missense_Mutation | rs144585878 | c.880N>T | p.Arg294Cys | p.R294C | O95817 | protein_coding | deleterious(0) | possibly_damaging(0.869) | TCGA-AA-3848-01 | Colorectum | colon adenocarcinoma | Female | >=65 | III/IV | Unknown | Unknown | PD |
| BAG3 | SNV | Missense_Mutation | novel | c.1290N>T | p.Glu430Asp | p.E430D | O95817 | protein_coding | tolerated(0.06) | benign(0.114) | TCGA-AA-3984-01 | Colorectum | colon adenocarcinoma | Female | <65 | I/II | Unknown | Unknown | SD |
| BAG3 | SNV | Missense_Mutation | c.7N>A | p.Ala3Thr | p.A3T | O95817 | protein_coding | deleterious(0.03) | probably_damaging(0.962) | TCGA-NH-A5IV-01 | Colorectum | colon adenocarcinoma | Female | >=65 | I/II | Unknown | Unknown | SD | |
| BAG3 | SNV | Missense_Mutation | c.11C>T | p.Ala4Val | p.A4V | O95817 | protein_coding | deleterious(0.01) | benign(0.242) | TCGA-QG-A5Z2-01 | Colorectum | colon adenocarcinoma | Male | <65 | I/II | Unknown | Unknown | SD |
| Page: 1 2 3 4 5 6 |
Top |
Related drugs of malignant transformation related genes |
| Identification of chemicals and drugs interact with genes involved in malignant transfromation |
| (DGIdb 4.0) |
| Entrez ID | Symbol | Category | Interaction Types | Drug Claim Name | Drug Name | PMIDs |
| Page: 1 |

Copyright 2023-Present -The University of Texas Health Science Center at Houston |