
|
|||||
|
 | |
| |
| |
| |
| |
| |
|
Gene: BAG2 |
Gene summary for BAG2 |
| Gene information | Species | Human | Gene symbol | BAG2 | Gene ID | 9532 |
| Gene name | BAG cochaperone 2 | |
| Gene Alias | BAG-2 | |
| Cytomap | 6p12.1 | |
| Gene Type | protein-coding | GO ID | GO:0006457 | UniProtAcc | O95816 |
Top |
Malignant transformation analysis |
| Identification of the aberrant gene expression in precancerous and cancerous lesions by comparing the gene expression of stem-like cells in diseased tissues with normal stem cells |
| Entrez ID | Symbol | Replicates | Species | Organ | Tissue | Adj P-value | Log2FC | Malignancy |
| 9532 | BAG2 | LZE4T | Human | Esophagus | ESCC | 1.78e-05 | 2.28e-01 | 0.0811 |
| 9532 | BAG2 | LZE7T | Human | Esophagus | ESCC | 1.61e-02 | 2.94e-01 | 0.0667 |
| 9532 | BAG2 | LZE22T | Human | Esophagus | ESCC | 8.39e-03 | 5.15e-01 | 0.068 |
| 9532 | BAG2 | LZE24T | Human | Esophagus | ESCC | 2.88e-02 | 1.89e-01 | 0.0596 |
| 9532 | BAG2 | P2T-E | Human | Esophagus | ESCC | 3.37e-08 | 1.69e-01 | 0.1177 |
| 9532 | BAG2 | P4T-E | Human | Esophagus | ESCC | 6.13e-26 | 7.09e-01 | 0.1323 |
| 9532 | BAG2 | P5T-E | Human | Esophagus | ESCC | 1.13e-18 | 4.49e-01 | 0.1327 |
| 9532 | BAG2 | P8T-E | Human | Esophagus | ESCC | 3.20e-02 | 7.57e-02 | 0.0889 |
| 9532 | BAG2 | P9T-E | Human | Esophagus | ESCC | 2.85e-24 | 6.41e-01 | 0.1131 |
| 9532 | BAG2 | P11T-E | Human | Esophagus | ESCC | 5.05e-05 | 3.52e-01 | 0.1426 |
| 9532 | BAG2 | P12T-E | Human | Esophagus | ESCC | 8.85e-04 | 1.17e-01 | 0.1122 |
| 9532 | BAG2 | P15T-E | Human | Esophagus | ESCC | 1.18e-02 | 1.79e-01 | 0.1149 |
| 9532 | BAG2 | P16T-E | Human | Esophagus | ESCC | 1.16e-04 | 1.25e-01 | 0.1153 |
| 9532 | BAG2 | P17T-E | Human | Esophagus | ESCC | 6.63e-07 | 4.05e-01 | 0.1278 |
| 9532 | BAG2 | P19T-E | Human | Esophagus | ESCC | 2.78e-04 | 5.48e-01 | 0.1662 |
| 9532 | BAG2 | P20T-E | Human | Esophagus | ESCC | 5.94e-14 | 2.61e-01 | 0.1124 |
| 9532 | BAG2 | P21T-E | Human | Esophagus | ESCC | 1.56e-33 | 8.29e-01 | 0.1617 |
| 9532 | BAG2 | P22T-E | Human | Esophagus | ESCC | 1.73e-07 | 2.75e-01 | 0.1236 |
| 9532 | BAG2 | P23T-E | Human | Esophagus | ESCC | 7.31e-07 | 2.93e-01 | 0.108 |
| 9532 | BAG2 | P24T-E | Human | Esophagus | ESCC | 5.35e-08 | 2.43e-01 | 0.1287 |
| Page: 1 2 3 4 5 |
| Tissue | Expression Dynamics | Abbreviation |
| Esophagus | 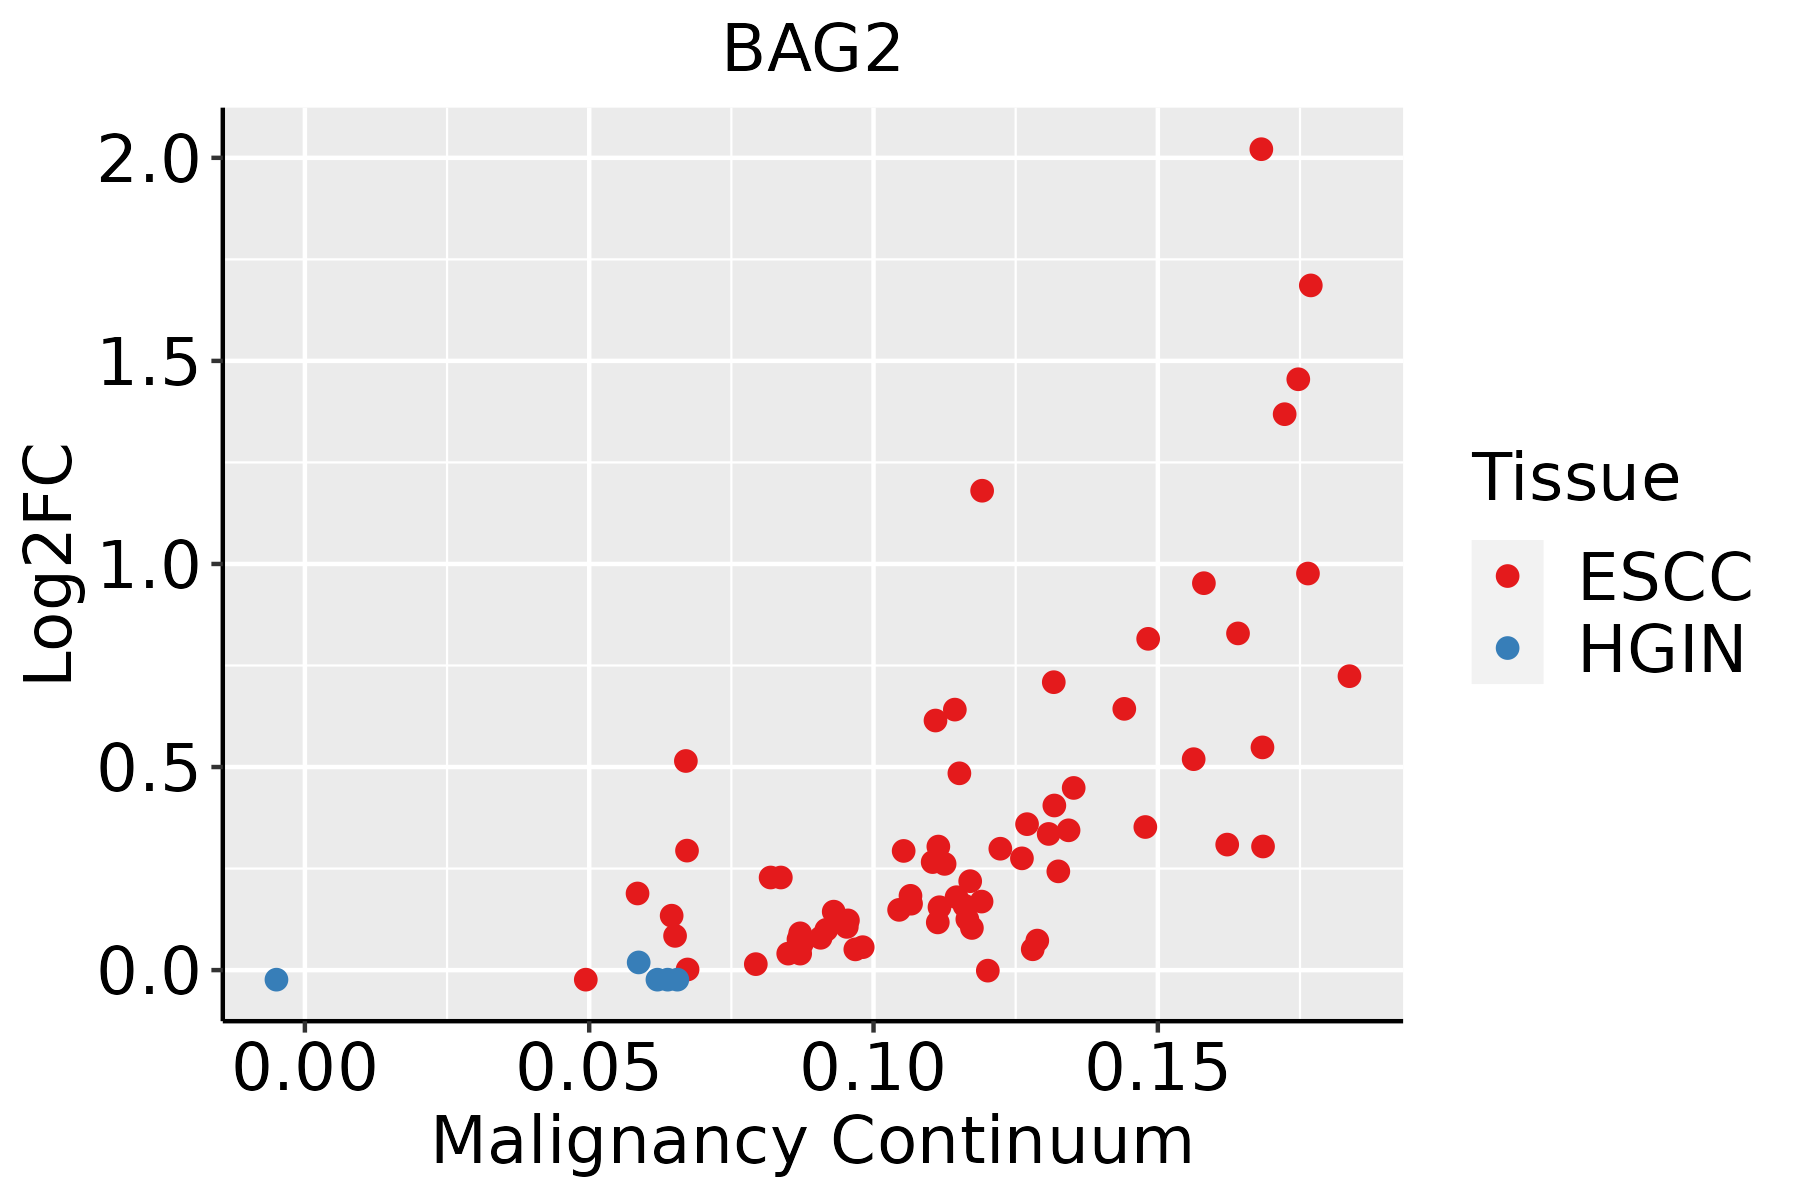 | ESCC: Esophageal squamous cell carcinoma |
| HGIN: High-grade intraepithelial neoplasias | ||
| LGIN: Low-grade intraepithelial neoplasias | ||
| Liver | 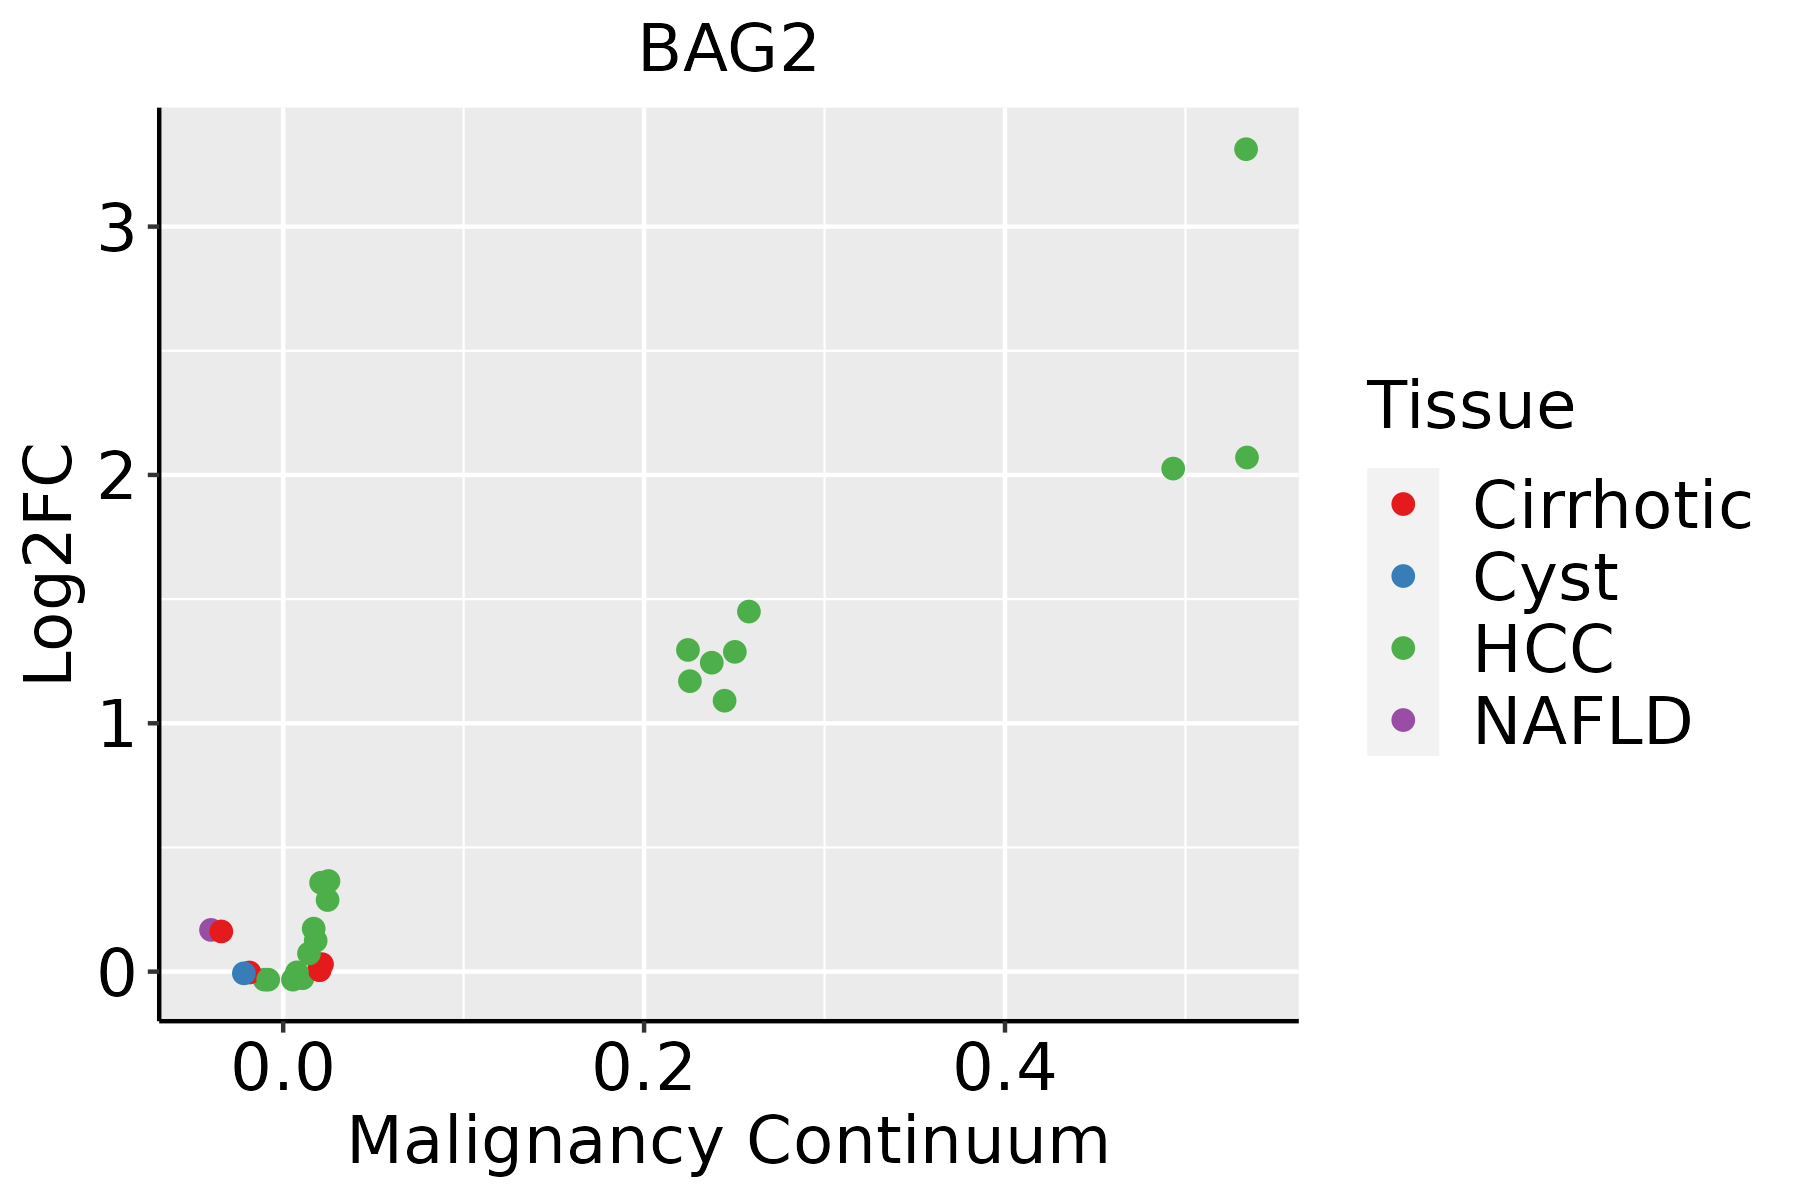 | HCC: Hepatocellular carcinoma |
| NAFLD: Non-alcoholic fatty liver disease | ||
| Oral Cavity | 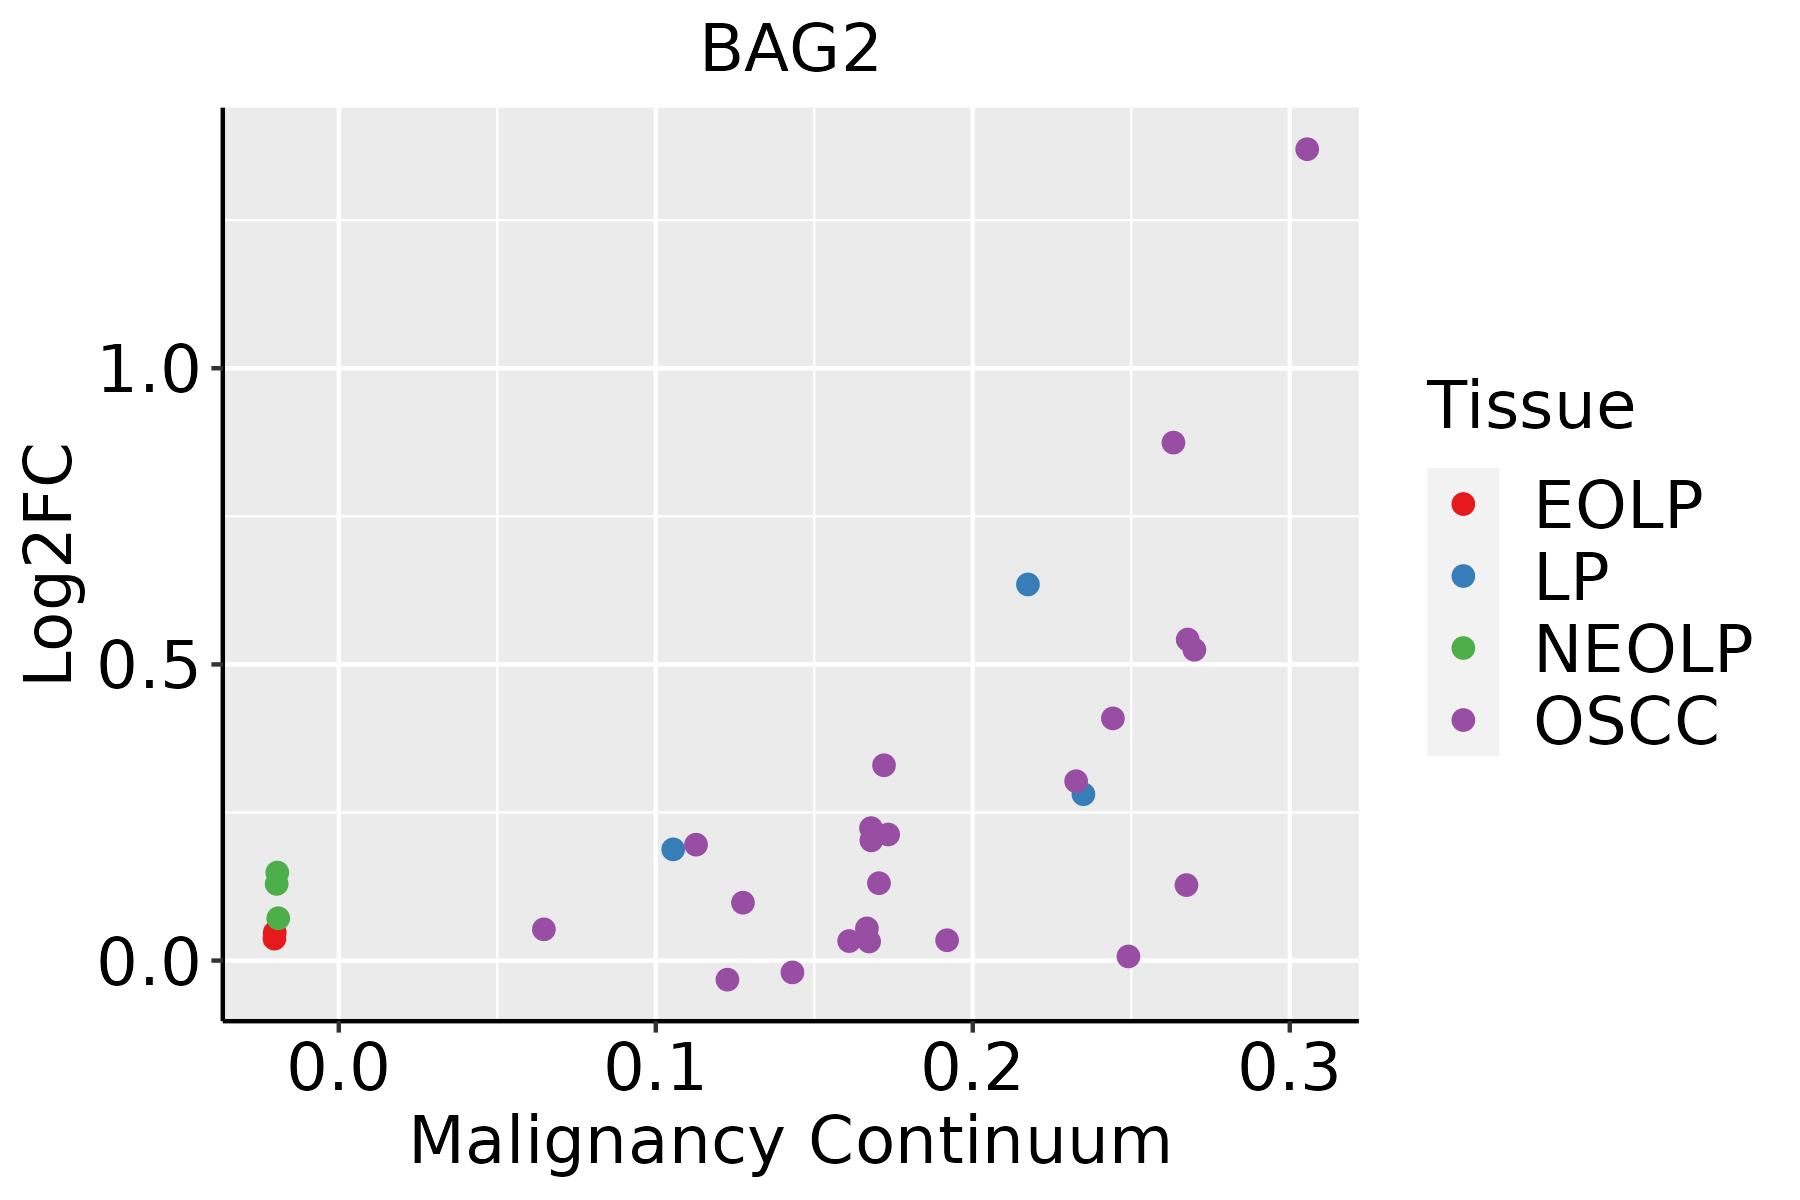 | EOLP: Erosive Oral lichen planus |
| LP: leukoplakia | ||
| NEOLP: Non-erosive oral lichen planus | ||
| OSCC: Oral squamous cell carcinoma | ||
| Thyroid | 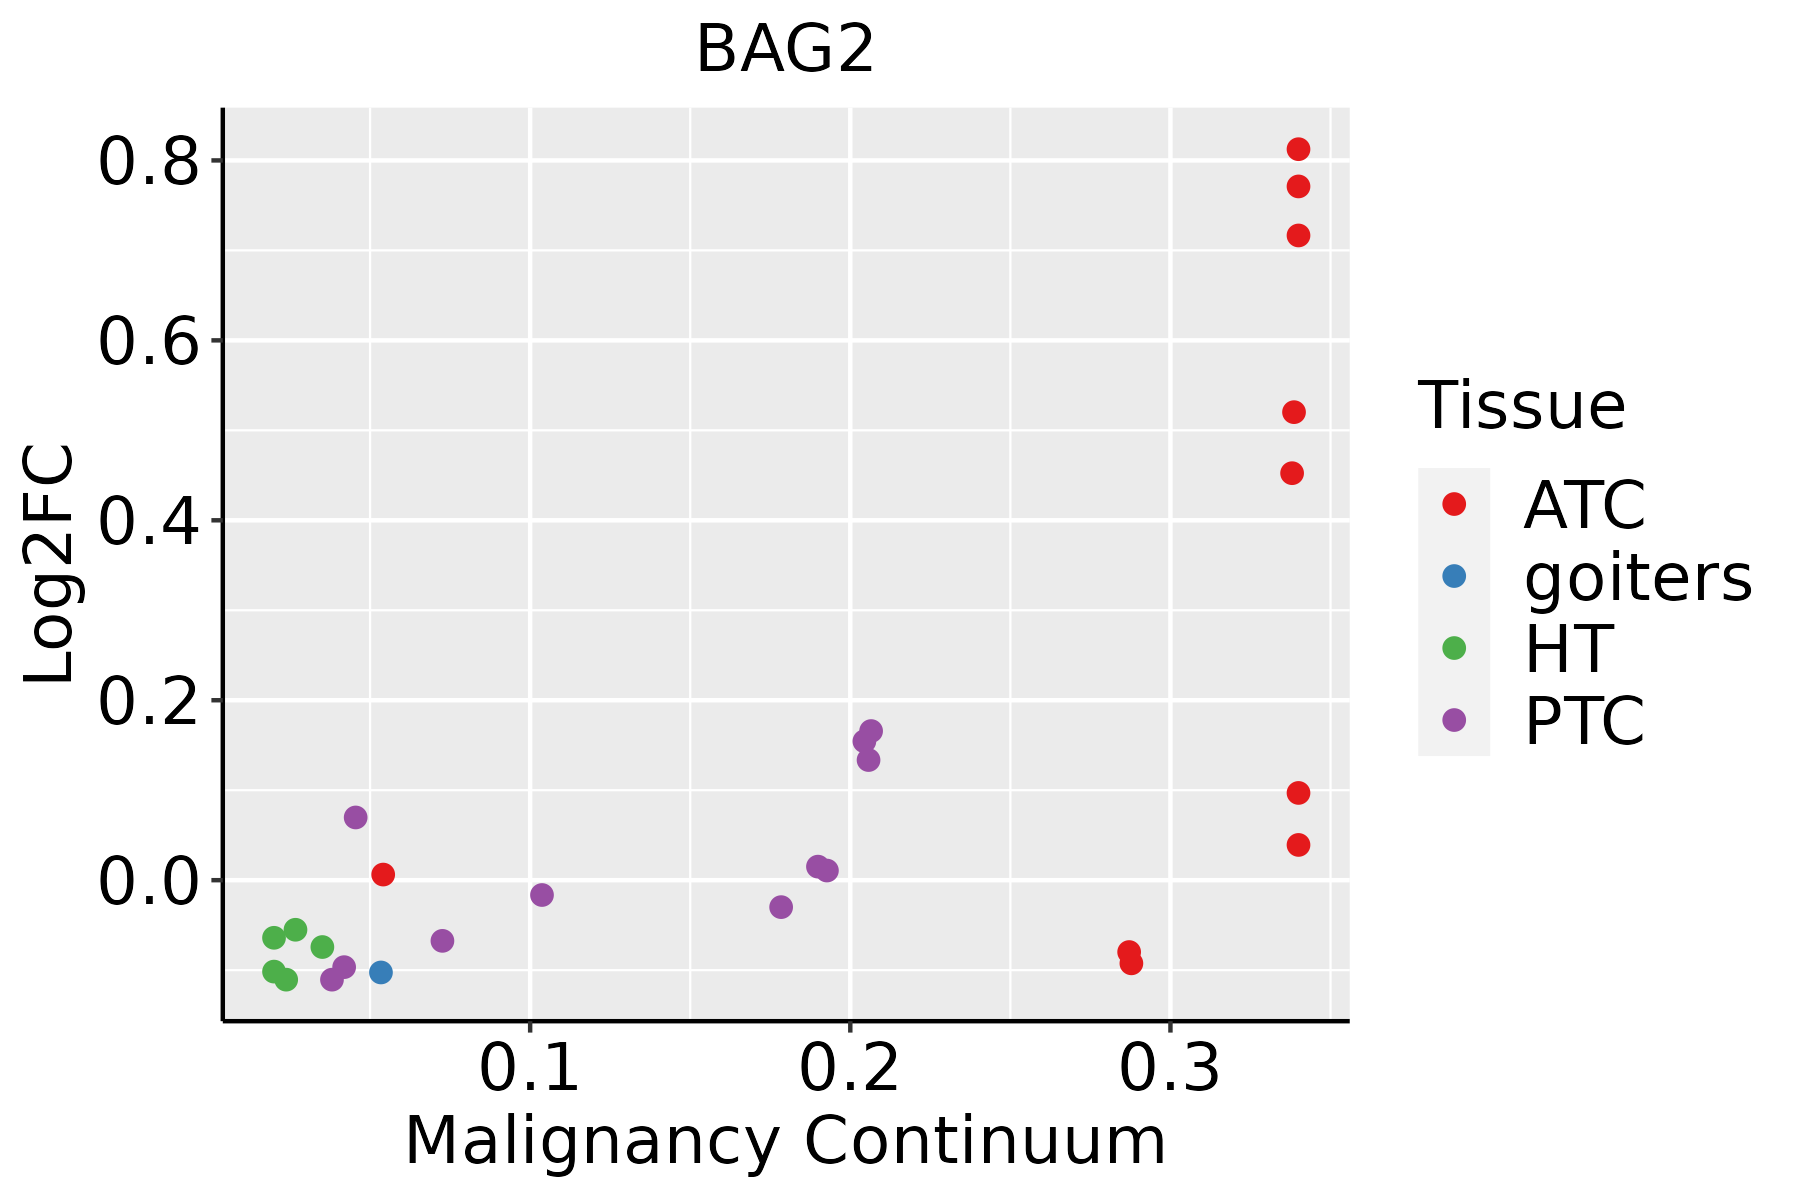 | ATC: Anaplastic thyroid cancer |
| HT: Hashimoto's thyroiditis | ||
| PTC: Papillary thyroid cancer |
| ∗log2FC in expression of this searched gene in stem-like cells from each diseased tissue sample relative to stem-like cells in normal samples in each tissue plotted against the malignancy continuum. Samples are colored based on if they are from different disease stage. |
Top |
Malignant transformation related pathway analysis |
| Find out the enriched GO biological processes and KEGG pathways involved in transition from healthy to precancer to cancer |
| Tissue | Disease Stage | Enriched GO biological Processes |
| Colorectum | AD |  |
| Colorectum | SER |  |
| Colorectum | MSS |  |
| Colorectum | MSI-H |  |
| Colorectum | FAP |  |
| ∗Top 15 enriched GO BP terms are showed in the bar plot of each disease state in each tissue. Each row represents a significant GO biological process which is colored according to the -log10(p.adjust). |
| Page: 1 2 3 4 5 6 7 8 9 |
| GO ID | Tissue | Disease Stage | Description | Gene Ratio | Bg Ratio | pvalue | p.adjust | Count |
| GO:0010498111 | Esophagus | ESCC | proteasomal protein catabolic process | 369/8552 | 490/18723 | 1.13e-41 | 1.80e-38 | 369 |
| GO:0042176111 | Esophagus | ESCC | regulation of protein catabolic process | 280/8552 | 391/18723 | 8.65e-26 | 2.39e-23 | 280 |
| GO:0031647111 | Esophagus | ESCC | regulation of protein stability | 223/8552 | 298/18723 | 5.76e-25 | 1.52e-22 | 223 |
| GO:0009896111 | Esophagus | ESCC | positive regulation of catabolic process | 332/8552 | 492/18723 | 4.36e-23 | 9.22e-21 | 332 |
| GO:0031331111 | Esophagus | ESCC | positive regulation of cellular catabolic process | 292/8552 | 427/18723 | 8.67e-22 | 1.53e-19 | 292 |
| GO:0006457110 | Esophagus | ESCC | protein folding | 163/8552 | 212/18723 | 1.13e-20 | 1.74e-18 | 163 |
| GO:1903320111 | Esophagus | ESCC | regulation of protein modification by small protein conjugation or removal | 181/8552 | 242/18723 | 1.80e-20 | 2.60e-18 | 181 |
| GO:1903362111 | Esophagus | ESCC | regulation of cellular protein catabolic process | 188/8552 | 255/18723 | 5.12e-20 | 6.62e-18 | 188 |
| GO:0051098111 | Esophagus | ESCC | regulation of binding | 251/8552 | 363/18723 | 6.73e-20 | 8.46e-18 | 251 |
| GO:0045862111 | Esophagus | ESCC | positive regulation of proteolysis | 256/8552 | 372/18723 | 7.88e-20 | 9.43e-18 | 256 |
| GO:1903050111 | Esophagus | ESCC | regulation of proteolysis involved in cellular protein catabolic process | 163/8552 | 221/18723 | 1.44e-17 | 1.27e-15 | 163 |
| GO:0061136111 | Esophagus | ESCC | regulation of proteasomal protein catabolic process | 142/8552 | 187/18723 | 2.40e-17 | 2.00e-15 | 142 |
| GO:0045732111 | Esophagus | ESCC | positive regulation of protein catabolic process | 167/8552 | 231/18723 | 1.47e-16 | 1.14e-14 | 167 |
| GO:0031396111 | Esophagus | ESCC | regulation of protein ubiquitination | 154/8552 | 210/18723 | 2.70e-16 | 2.04e-14 | 154 |
| GO:0050821111 | Esophagus | ESCC | protein stabilization | 140/8552 | 191/18723 | 6.50e-15 | 3.61e-13 | 140 |
| GO:1903364111 | Esophagus | ESCC | positive regulation of cellular protein catabolic process | 117/8552 | 155/18723 | 3.25e-14 | 1.66e-12 | 117 |
| GO:1901800110 | Esophagus | ESCC | positive regulation of proteasomal protein catabolic process | 91/8552 | 114/18723 | 6.74e-14 | 3.34e-12 | 91 |
| GO:1903052110 | Esophagus | ESCC | positive regulation of proteolysis involved in cellular protein catabolic process | 101/8552 | 133/18723 | 9.58e-13 | 4.19e-11 | 101 |
| GO:0051348111 | Esophagus | ESCC | negative regulation of transferase activity | 177/8552 | 268/18723 | 1.08e-11 | 4.00e-10 | 177 |
| GO:004339320 | Esophagus | ESCC | regulation of protein binding | 135/8552 | 196/18723 | 3.69e-11 | 1.22e-09 | 135 |
| Page: 1 2 3 4 5 6 7 8 9 10 |
| Pathway ID | Tissue | Disease Stage | Description | Gene Ratio | Bg Ratio | pvalue | p.adjust | qvalue | Count |
| hsa04141211 | Esophagus | ESCC | Protein processing in endoplasmic reticulum | 147/4205 | 174/8465 | 3.29e-22 | 1.10e-19 | 5.64e-20 | 147 |
| hsa04141310 | Esophagus | ESCC | Protein processing in endoplasmic reticulum | 147/4205 | 174/8465 | 3.29e-22 | 1.10e-19 | 5.64e-20 | 147 |
| hsa0414122 | Liver | HCC | Protein processing in endoplasmic reticulum | 146/4020 | 174/8465 | 7.34e-24 | 2.46e-21 | 1.37e-21 | 146 |
| hsa0414132 | Liver | HCC | Protein processing in endoplasmic reticulum | 146/4020 | 174/8465 | 7.34e-24 | 2.46e-21 | 1.37e-21 | 146 |
| hsa0414130 | Oral cavity | OSCC | Protein processing in endoplasmic reticulum | 143/3704 | 174/8465 | 6.82e-26 | 2.28e-23 | 1.16e-23 | 143 |
| hsa04141113 | Oral cavity | OSCC | Protein processing in endoplasmic reticulum | 143/3704 | 174/8465 | 6.82e-26 | 2.28e-23 | 1.16e-23 | 143 |
| hsa04141210 | Oral cavity | LP | Protein processing in endoplasmic reticulum | 113/2418 | 174/8465 | 8.74e-24 | 5.82e-22 | 3.76e-22 | 113 |
| hsa0414138 | Oral cavity | LP | Protein processing in endoplasmic reticulum | 113/2418 | 174/8465 | 8.74e-24 | 5.82e-22 | 3.76e-22 | 113 |
| Page: 1 |
Top |
Cell-cell communication analysis |
| Identification of potential cell-cell interactions between two cell types and their ligand-receptor pairs for different disease states |
| Ligand | Receptor | LRpair | Pathway | Tissue | Disease Stage |
| Page: 1 |
Top |
Single-cell gene regulatory network inference analysis |
| Find out the significant the regulons (TFs) and the target genes of each regulon across cell types for different disease states |
| TF | Cell Type | Tissue | Disease Stage | Target Gene | RSS | Regulon Activity |
| ∗The dot plots of a searched regulon are shown for all cell subpopulations in each disease state of each tissue based on the regulon specific score inferred using pySCENIC and by calculating the average expression. |
| Page: 1 |
Top |
Somatic mutation of malignant transformation related genes |
| Annotation of somatic variants for genes involved in malignant transformation |
| Hugo Symbol | Variant Class | Variant Classification | dbSNP RS | HGVSc | HGVSp | HGVSp Short | SWISSPROT | BIOTYPE | SIFT | PolyPhen | Tumor Sample Barcode | Tissue | Histology | Sex | Age | Stage | Therapy Types | Drugs | Outcome |
| BAG2 | SNV | Missense_Mutation | rs759501055 | c.431C>G | p.Ser144Cys | p.S144C | O95816 | protein_coding | deleterious(0.04) | probably_damaging(0.947) | TCGA-AC-A23H-01 | Breast | breast invasive carcinoma | Female | >=65 | I/II | Unknown | Unknown | PD |
| BAG2 | insertion | In_Frame_Ins | novel | c.384_385insCTTACT | p.Leu128_Gly129insLeuThr | p.L128_G129insLT | O95816 | protein_coding | TCGA-AN-A04C-01 | Breast | breast invasive carcinoma | Female | <65 | I/II | Unknown | Unknown | SD | ||
| BAG2 | insertion | Nonsense_Mutation | novel | c.385_386insCTCACAGTGTTAAGACTTGATTCAAGTCTTAACACTGT | p.Gly129AlafsTer7 | p.G129Afs*7 | O95816 | protein_coding | TCGA-AN-A04C-01 | Breast | breast invasive carcinoma | Female | <65 | I/II | Unknown | Unknown | SD | ||
| BAG2 | SNV | Missense_Mutation | c.355N>C | p.Glu119Gln | p.E119Q | O95816 | protein_coding | tolerated(0.05) | possibly_damaging(0.625) | TCGA-EK-A2PG-01 | Cervix | cervical & endocervical cancer | Female | >=65 | I/II | Unknown | Unknown | SD | |
| BAG2 | SNV | Missense_Mutation | c.631N>C | p.Asn211His | p.N211H | O95816 | protein_coding | deleterious_low_confidence(0.01) | benign(0.085) | TCGA-AA-3715-01 | Colorectum | colon adenocarcinoma | Male | >=65 | I/II | Unknown | Unknown | PD | |
| BAG2 | SNV | Missense_Mutation | novel | c.571T>G | p.Leu191Val | p.L191V | O95816 | protein_coding | deleterious_low_confidence(0.01) | benign(0.437) | TCGA-AA-A00O-01 | Colorectum | colon adenocarcinoma | Female | >=65 | III/IV | Unknown | Unknown | SD |
| BAG2 | SNV | Missense_Mutation | c.277A>G | p.Thr93Ala | p.T93A | O95816 | protein_coding | tolerated(0.41) | benign(0.031) | TCGA-AA-A02R-01 | Colorectum | colon adenocarcinoma | Female | >=65 | I/II | Unknown | Unknown | PD | |
| BAG2 | SNV | Missense_Mutation | rs765872537 | c.257N>A | p.Arg86His | p.R86H | O95816 | protein_coding | deleterious(0) | probably_damaging(0.998) | TCGA-AD-6889-01 | Colorectum | colon adenocarcinoma | Male | >=65 | I/II | Chemotherapy | xeloda | PD |
| BAG2 | SNV | Missense_Mutation | novel | c.301A>T | p.Ile101Phe | p.I101F | O95816 | protein_coding | deleterious(0.03) | benign(0.317) | TCGA-AM-5820-01 | Colorectum | colon adenocarcinoma | Female | <65 | I/II | Unknown | Unknown | SD |
| BAG2 | SNV | Missense_Mutation | novel | c.376N>A | p.Asp126Asn | p.D126N | O95816 | protein_coding | tolerated(0.1) | possibly_damaging(0.783) | TCGA-A5-A0G2-01 | Endometrium | uterine corpus endometrioid carcinoma | Female | <65 | III/IV | Unknown | Unknown | SD |
| Page: 1 2 |
Top |
Related drugs of malignant transformation related genes |
| Identification of chemicals and drugs interact with genes involved in malignant transfromation |
| (DGIdb 4.0) |
| Entrez ID | Symbol | Category | Interaction Types | Drug Claim Name | Drug Name | PMIDs |
| Page: 1 |

Copyright 2023-Present -The University of Texas Health Science Center at Houston |