
|
|||||
|
 | |
| |
| |
| |
| |
| |
|
Gene: BACH2 |
Gene summary for BACH2 |
| Gene information | Species | Human | Gene symbol | BACH2 | Gene ID | 60468 |
| Gene name | BTB domain and CNC homolog 2 | |
| Gene Alias | BTBD25 | |
| Cytomap | 6q15 | |
| Gene Type | protein-coding | GO ID | GO:0000122 | UniProtAcc | Q9BYV9 |
Top |
Malignant transformation analysis |
| Identification of the aberrant gene expression in precancerous and cancerous lesions by comparing the gene expression of stem-like cells in diseased tissues with normal stem cells |
| Entrez ID | Symbol | Replicates | Species | Organ | Tissue | Adj P-value | Log2FC | Malignancy |
| 60468 | BACH2 | RNA-P17T-P17T-4 | Human | Lung | IAC | 1.48e-03 | 5.89e-01 | 0.343 |
| 60468 | BACH2 | RNA-P17T-P17T-6 | Human | Lung | IAC | 1.13e-06 | 7.81e-01 | 0.3385 |
| 60468 | BACH2 | RNA-P17T-P17T-8 | Human | Lung | IAC | 1.55e-04 | 7.06e-01 | 0.3329 |
| 60468 | BACH2 | GSM5252131_BPH340PrSF_Via | Human | Prostate | BPH | 7.08e-05 | 2.52e-01 | -0.2126 |
| 60468 | BACH2 | GSM5252132_BPH389PrGF | Human | Prostate | BPH | 7.36e-03 | 3.54e-01 | -0.2247 |
| 60468 | BACH2 | 047563_1562-all-cells | Human | Prostate | BPH | 3.22e-63 | 1.17e+00 | 0.0791 |
| 60468 | BACH2 | 048752_1579-all-cells | Human | Prostate | BPH | 4.57e-95 | 1.50e+00 | 0.1008 |
| 60468 | BACH2 | 052095_1628-all-cells | Human | Prostate | BPH | 7.34e-45 | 1.04e+00 | 0.1032 |
| 60468 | BACH2 | 052097_1595-all-cells | Human | Prostate | BPH | 3.95e-92 | 1.53e+00 | 0.0972 |
| 60468 | BACH2 | 052099_1652-all-cells | Human | Prostate | BPH | 6.96e-72 | 1.49e+00 | 0.1038 |
| 60468 | BACH2 | P1_S1_AK | Human | Skin | AK | 6.91e-47 | 9.02e-01 | -0.3399 |
| 60468 | BACH2 | P2_S3_AK | Human | Skin | AK | 7.02e-34 | 7.18e-01 | -0.3287 |
| 60468 | BACH2 | P2_S4_SCCIS | Human | Skin | SCCIS | 1.32e-41 | 7.58e-01 | -0.3043 |
| 60468 | BACH2 | P3_S6_AK | Human | Skin | AK | 3.38e-13 | 4.68e-01 | -0.3256 |
| 60468 | BACH2 | P4_S8_cSCC | Human | Skin | cSCC | 6.04e-05 | 2.08e-01 | -0.3095 |
| Page: 1 |
| Tissue | Expression Dynamics | Abbreviation |
| Lung | 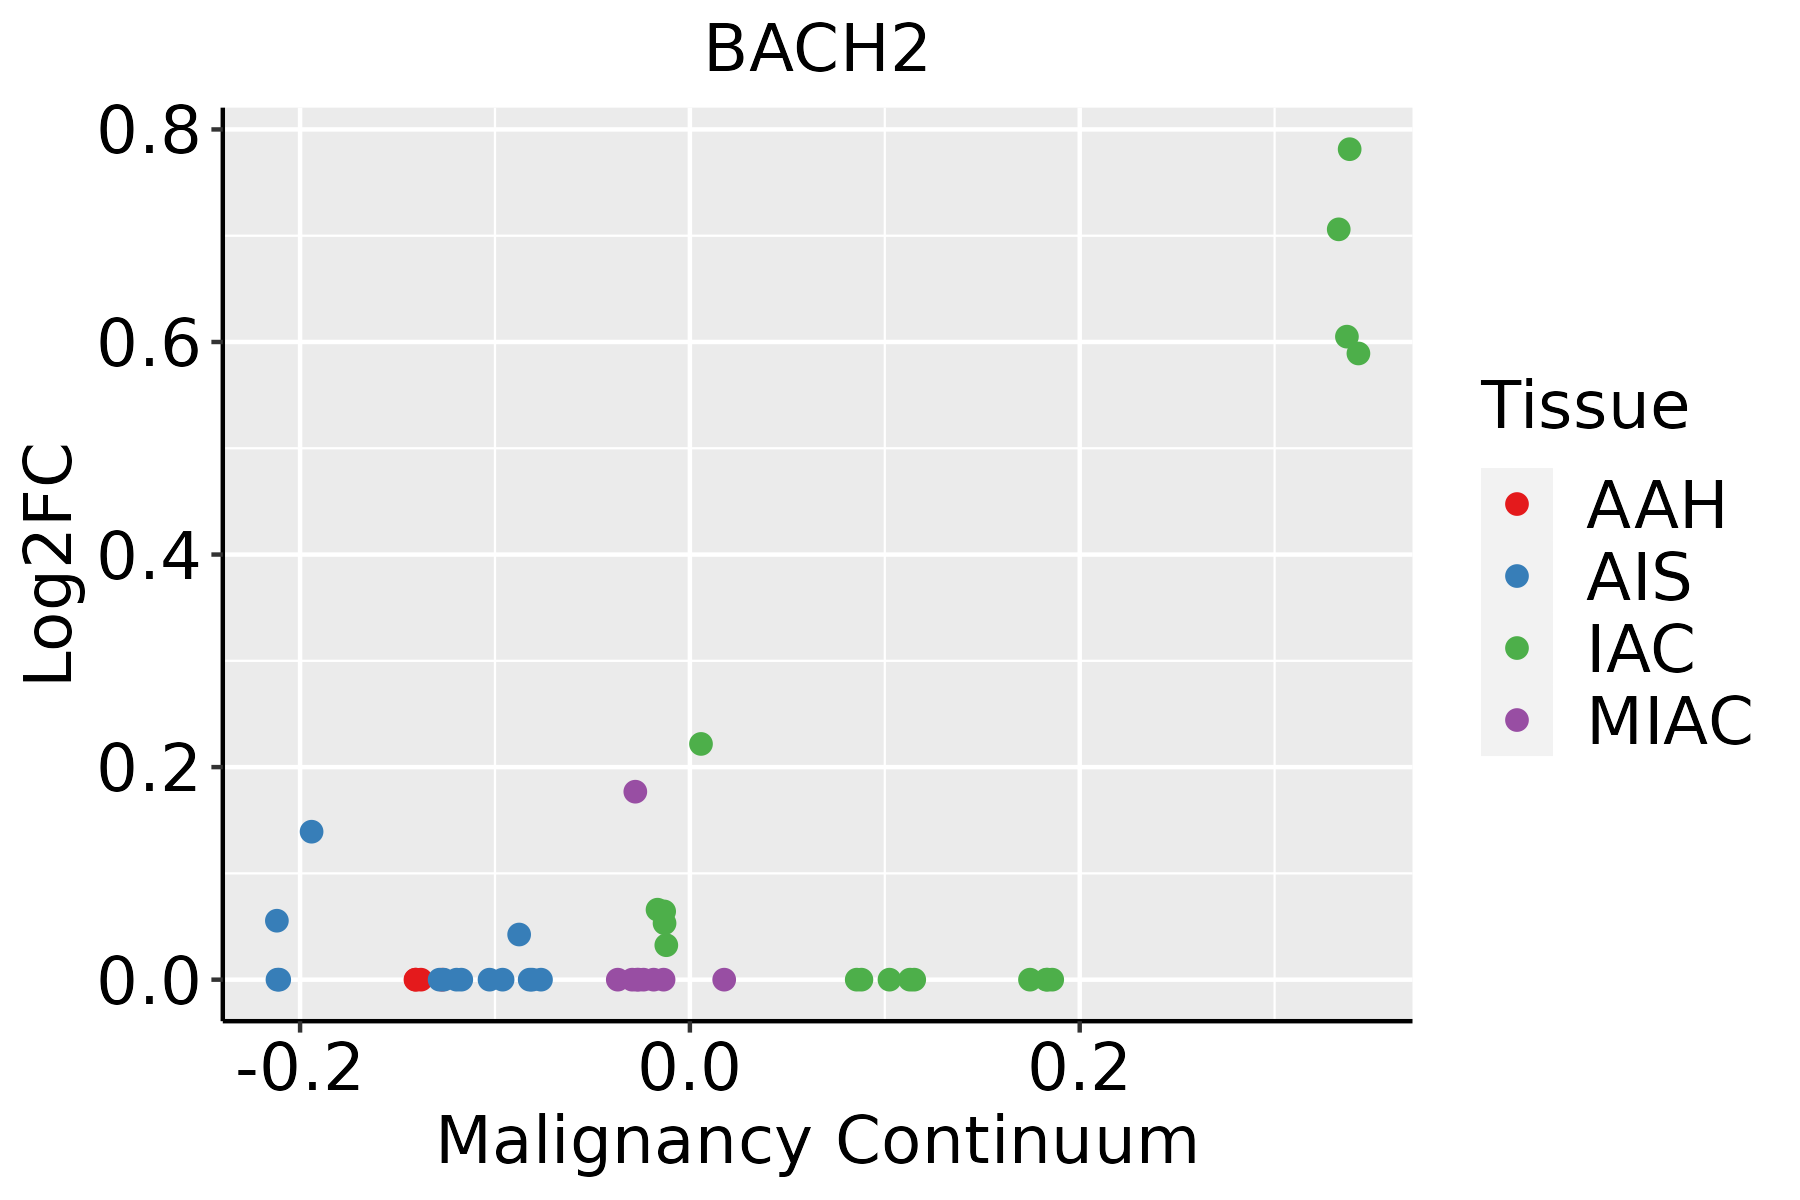 | AAH: Atypical adenomatous hyperplasia |
| AIS: Adenocarcinoma in situ | ||
| IAC: Invasive lung adenocarcinoma | ||
| MIA: Minimally invasive adenocarcinoma | ||
| Prostate |  | BPH: Benign Prostatic Hyperplasia |
| Skin | 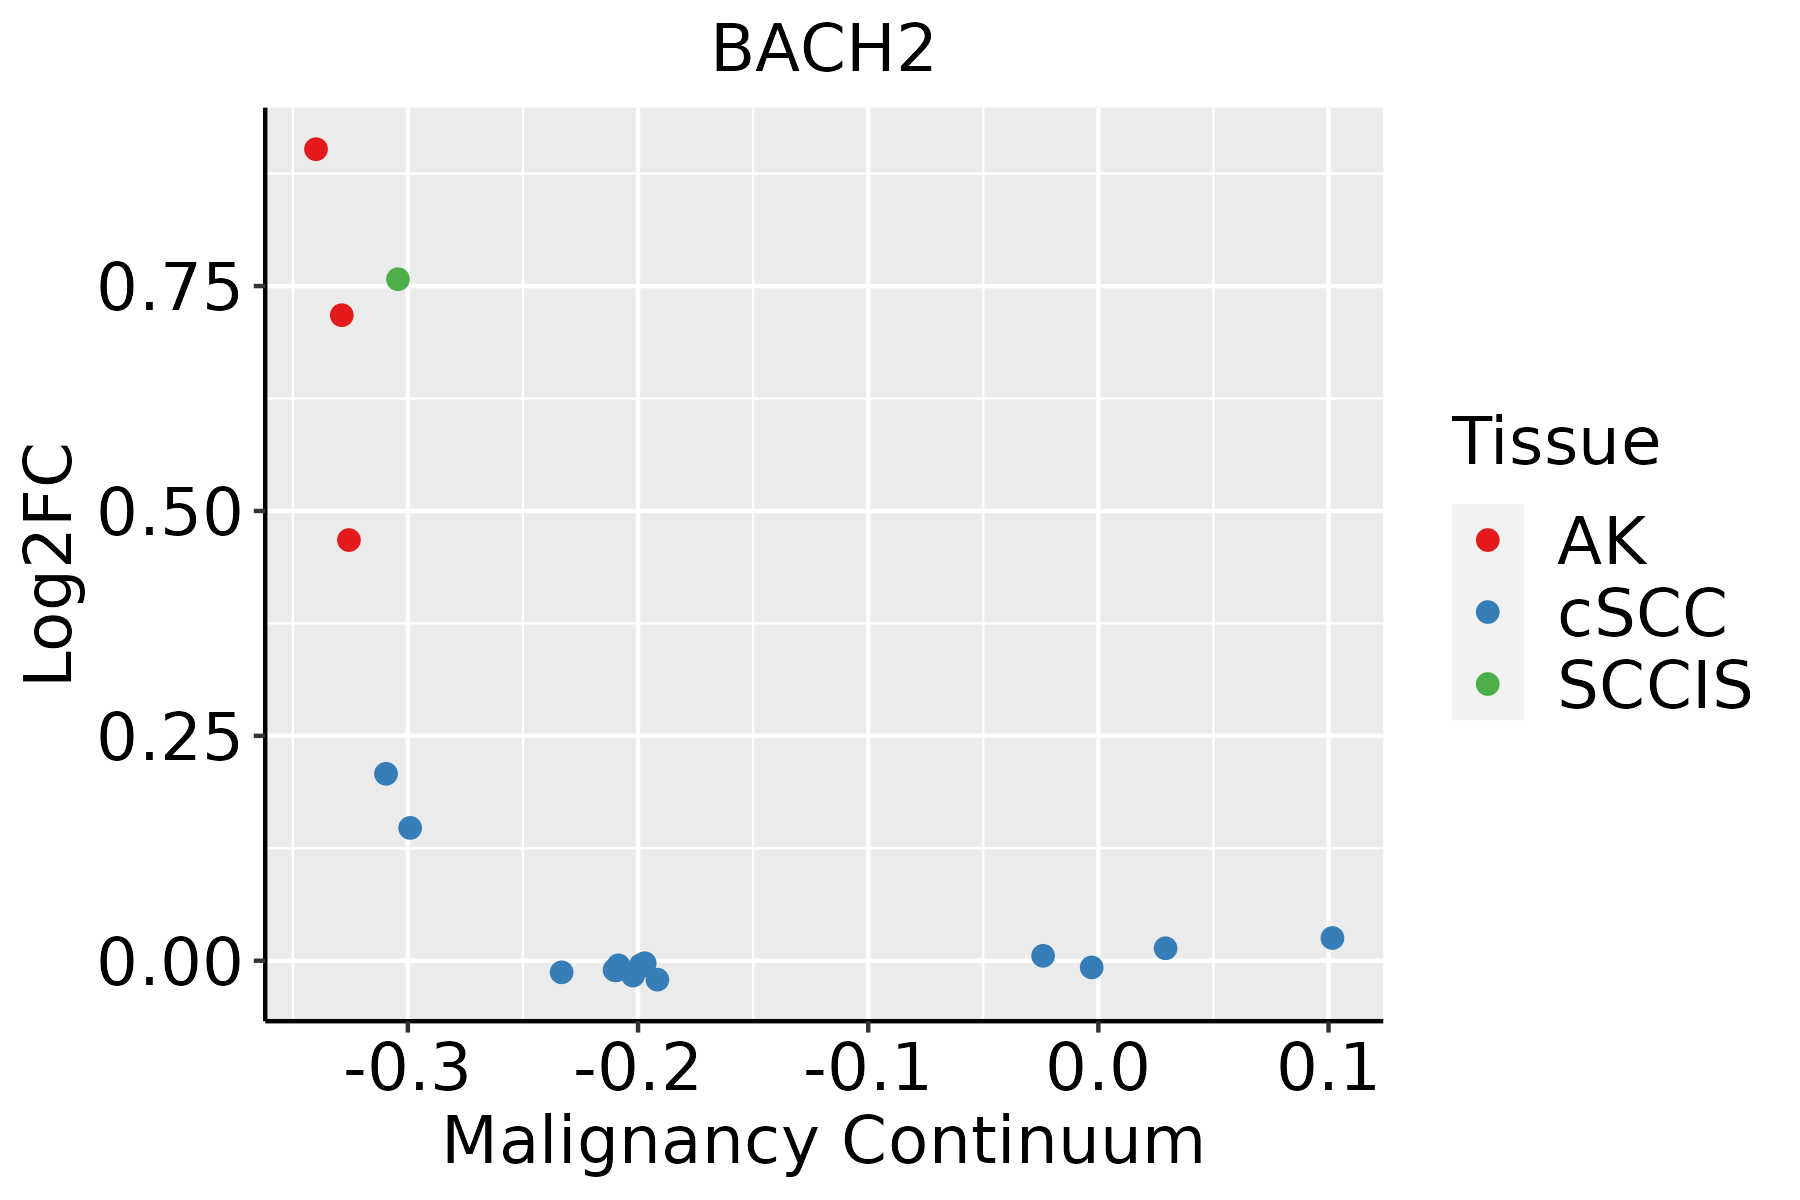 | AK: Actinic keratosis |
| cSCC: Cutaneous squamous cell carcinoma | ||
| SCCIS:squamous cell carcinoma in situ |
| ∗log2FC in expression of this searched gene in stem-like cells from each diseased tissue sample relative to stem-like cells in normal samples in each tissue plotted against the malignancy continuum. Samples are colored based on if they are from different disease stage. |
Top |
Malignant transformation related pathway analysis |
| Find out the enriched GO biological processes and KEGG pathways involved in transition from healthy to precancer to cancer |
| Tissue | Disease Stage | Enriched GO biological Processes |
| Colorectum | AD |  |
| Colorectum | SER |  |
| Colorectum | MSS |  |
| Colorectum | MSI-H |  |
| Colorectum | FAP |  |
| ∗Top 15 enriched GO BP terms are showed in the bar plot of each disease state in each tissue. Each row represents a significant GO biological process which is colored according to the -log10(p.adjust). |
| Page: 1 2 3 4 5 6 7 8 9 |
| GO ID | Tissue | Disease Stage | Description | Gene Ratio | Bg Ratio | pvalue | p.adjust | Count |
| GO:00069138 | Lung | IAC | nucleocytoplasmic transport | 63/2061 | 301/18723 | 3.50e-07 | 2.54e-05 | 63 |
| GO:00511698 | Lung | IAC | nuclear transport | 63/2061 | 301/18723 | 3.50e-07 | 2.54e-05 | 63 |
| GO:000691315 | Prostate | BPH | nucleocytoplasmic transport | 92/3107 | 301/18723 | 1.09e-09 | 4.84e-08 | 92 |
| GO:005116915 | Prostate | BPH | nuclear transport | 92/3107 | 301/18723 | 1.09e-09 | 4.84e-08 | 92 |
| GO:00511708 | Prostate | BPH | import into nucleus | 48/3107 | 159/18723 | 1.42e-05 | 1.85e-04 | 48 |
| GO:000691320 | Skin | AK | nucleocytoplasmic transport | 69/1910 | 301/18723 | 7.63e-11 | 1.29e-08 | 69 |
| GO:005116920 | Skin | AK | nuclear transport | 69/1910 | 301/18723 | 7.63e-11 | 1.29e-08 | 69 |
| GO:005117015 | Skin | AK | import into nucleus | 33/1910 | 159/18723 | 5.59e-05 | 8.47e-04 | 33 |
| GO:0006913111 | Skin | SCCIS | nucleocytoplasmic transport | 28/919 | 301/18723 | 9.23e-04 | 1.18e-02 | 28 |
| GO:0051169111 | Skin | SCCIS | nuclear transport | 28/919 | 301/18723 | 9.23e-04 | 1.18e-02 | 28 |
| GO:000691324 | Skin | cSCC | nucleocytoplasmic transport | 162/4864 | 301/18723 | 4.20e-25 | 1.10e-22 | 162 |
| GO:005116924 | Skin | cSCC | nuclear transport | 162/4864 | 301/18723 | 4.20e-25 | 1.10e-22 | 162 |
| GO:005117016 | Skin | cSCC | import into nucleus | 77/4864 | 159/18723 | 9.17e-10 | 3.58e-08 | 77 |
| Page: 1 |
| Pathway ID | Tissue | Disease Stage | Description | Gene Ratio | Bg Ratio | pvalue | p.adjust | qvalue | Count |
| Page: 1 |
Top |
Cell-cell communication analysis |
| Identification of potential cell-cell interactions between two cell types and their ligand-receptor pairs for different disease states |
| Ligand | Receptor | LRpair | Pathway | Tissue | Disease Stage |
| Page: 1 |
Top |
Single-cell gene regulatory network inference analysis |
| Find out the significant the regulons (TFs) and the target genes of each regulon across cell types for different disease states |
| TF | Cell Type | Tissue | Disease Stage | Target Gene | RSS | Regulon Activity |
| BACH2 | BN | Breast | Healthy | NEIL1,TCL1A,BCL7A, etc. | 4.88e-02 |  |
| BACH2 | MAST | Breast | IDC | NEIL1,TCL1A,BCL7A, etc. | 4.16e-02 |  |
| BACH2 | TH17 | Breast | IDC | NEIL1,TCL1A,BCL7A, etc. | 3.38e-02 | |
| BACH2 | MYOFIB | Cervix | ADJ | ZDHHC14,FNBP1,GAB2, etc. | 3.81e-01 |  |
| BACH2 | MSC | Cervix | CC | ZDHHC14,FNBP1,GAB2, etc. | 4.94e-01 |  |
| BACH2 | STM | Esophagus | ADJ | RAC2,CREB5,RNF122, etc. | 4.63e-01 |  |
| BACH2 | HEP | Liver | Healthy | TCF7L2,PRKCE,HDAC4, etc. | 6.63e-01 |  |
| BACH2 | LYMEND | Liver | Cirrhotic | ESR1,AIG1,DST, etc. | 4.00e-01 |  |
| BACH2 | LYMEND | Liver | Healthy | ESR1,AIG1,DST, etc. | 1.40e-01 | |
| BACH2 | LYMEND | Liver | NAFLD | ESR1,AIG1,DST, etc. | 1.35e-01 |  |
| ∗The dot plots of a searched regulon are shown for all cell subpopulations in each disease state of each tissue based on the regulon specific score inferred using pySCENIC and by calculating the average expression. |
| Page: 1 2 3 4 |
Top |
Somatic mutation of malignant transformation related genes |
| Annotation of somatic variants for genes involved in malignant transformation |
| Hugo Symbol | Variant Class | Variant Classification | dbSNP RS | HGVSc | HGVSp | HGVSp Short | SWISSPROT | BIOTYPE | SIFT | PolyPhen | Tumor Sample Barcode | Tissue | Histology | Sex | Age | Stage | Therapy Types | Drugs | Outcome |
| BACH2 | SNV | Missense_Mutation | c.238G>C | p.Glu80Gln | p.E80Q | Q9BYV9 | protein_coding | deleterious(0.05) | benign(0.066) | TCGA-3C-AALI-01 | Breast | breast invasive carcinoma | Female | <65 | I/II | Unspecific | Poly E | Complete Response | |
| BACH2 | SNV | Missense_Mutation | c.1593N>G | p.Asp531Glu | p.D531E | Q9BYV9 | protein_coding | tolerated(0.1) | probably_damaging(0.995) | TCGA-A2-A04U-01 | Breast | breast invasive carcinoma | Female | <65 | I/II | Chemotherapy | adriamycin | SD | |
| BACH2 | SNV | Missense_Mutation | rs375103380 | c.2321N>T | p.Ala774Val | p.A774V | Q9BYV9 | protein_coding | tolerated(0.29) | benign(0.028) | TCGA-A8-A06O-01 | Breast | breast invasive carcinoma | Female | <65 | I/II | Hormone Therapy | letrozole | SD |
| BACH2 | SNV | Missense_Mutation | rs576225753 | c.1586N>T | p.Ala529Val | p.A529V | Q9BYV9 | protein_coding | deleterious(0.04) | probably_damaging(0.996) | TCGA-AR-A1AV-01 | Breast | breast invasive carcinoma | Male | >=65 | I/II | Chemotherapy | cytoxan | SD |
| BACH2 | SNV | Missense_Mutation | novel | c.929N>C | p.Asp310Ala | p.D310A | Q9BYV9 | protein_coding | deleterious(0.03) | benign(0.141) | TCGA-BH-A0HY-01 | Breast | breast invasive carcinoma | Female | <65 | I/II | Hormone Therapy | taxotere | CR |
| BACH2 | SNV | Missense_Mutation | c.194N>T | p.Ala65Val | p.A65V | Q9BYV9 | protein_coding | tolerated(0.2) | benign(0.013) | TCGA-BH-A0W5-01 | Breast | breast invasive carcinoma | Female | >=65 | I/II | Hormone Therapy | arimidex | CR | |
| BACH2 | SNV | Missense_Mutation | c.923N>C | p.Glu308Ala | p.E308A | Q9BYV9 | protein_coding | tolerated(0.14) | benign(0.007) | TCGA-BH-A18S-01 | Breast | breast invasive carcinoma | Female | >=65 | I/II | Unknown | Unknown | SD | |
| BACH2 | SNV | Missense_Mutation | novel | c.110N>A | p.Cys37Tyr | p.C37Y | Q9BYV9 | protein_coding | deleterious(0) | probably_damaging(1) | TCGA-BH-A1F8-01 | Breast | breast invasive carcinoma | Female | >=65 | III/IV | Unknown | Unknown | PD |
| BACH2 | SNV | Missense_Mutation | c.2152N>A | p.Gln718Lys | p.Q718K | Q9BYV9 | protein_coding | tolerated(0.33) | benign(0.197) | TCGA-BH-A42U-01 | Breast | breast invasive carcinoma | Female | >=65 | I/II | Unknown | Unknown | SD | |
| BACH2 | SNV | Missense_Mutation | c.92G>A | p.Arg31Gln | p.R31Q | Q9BYV9 | protein_coding | deleterious(0) | probably_damaging(0.929) | TCGA-D8-A1XJ-01 | Breast | breast invasive carcinoma | Female | >=65 | III/IV | Hormone Therapy | tamoxiphen | SD |
| Page: 1 2 3 4 5 6 7 8 9 10 11 12 13 14 15 |
Top |
Related drugs of malignant transformation related genes |
| Identification of chemicals and drugs interact with genes involved in malignant transfromation |
| (DGIdb 4.0) |
| Entrez ID | Symbol | Category | Interaction Types | Drug Claim Name | Drug Name | PMIDs |
| Page: 1 |

Copyright 2023-Present -The University of Texas Health Science Center at Houston |