Schematic overview of the cellular and molecular mechanisms involved in the cancer progression, including the proposed cellular and molecular mechanisms in cancer cells trajectory. AT1: alveolar type 1 cells; AT2: alveolar type 2 cells; AAH: atypical adenomatous hyperplasia; AIS: adenocarcinoma in situ; MIA: minimally invasive adenocarcinoma; IA: invasive adenocarcinoma; EMT: epithelial-mesenchymal transition

Home

Download

Statistics

Help

Contact

Center for Computational Systems Medicine
leaf

Gene summary

leaf

Malignant transformation analysis

leaf

Malignant transformation related pathway analysis

leaf

Cell-cell communication analysis

leaf

Single-cell gene regulatory network inference analysis

leaf

Somatic mutation of malignant transformation related genes

leaf

Related drugs of malignant transformation related genes

Gene: BACH1

Gene summary for BACH1

check button Gene summary.

Gene informationSpeciesHuman
Gene symbol

BACH1

Gene ID

571

Gene nameBTB domain and CNC homolog 1
Gene AliasBACH-1
Cytomap21q21.3
Gene Typeprotein-coding
GO ID

GO:0000082

UniProtAcc

O14867


Top

Malignant transformation analysis

check button Identification of the aberrant gene expression in precancerous and cancerous lesions by comparing the gene expression of stem-like cells in diseased tissues with normal stem cells
check button Malignant transformation involving gene list.
Entrez IDSymbolReplicatesSpeciesOrganTissueAdj P-valueLog2FCMalignancy
571BACH1LZE4THumanEsophagusESCC1.88e-132.91e-010.0811
571BACH1LZE7THumanEsophagusESCC1.50e-043.73e-010.0667
571BACH1LZE8THumanEsophagusESCC3.48e-064.21e-020.067
571BACH1LZE20THumanEsophagusESCC8.14e-121.80e-010.0662
571BACH1LZE22THumanEsophagusESCC7.59e-052.49e-010.068
571BACH1LZE24THumanEsophagusESCC9.67e-088.11e-020.0596
571BACH1LZE6THumanEsophagusESCC2.42e-061.34e-010.0845
571BACH1P1T-EHumanEsophagusESCC1.54e-112.88e-010.0875
571BACH1P2T-EHumanEsophagusESCC2.29e-111.66e-010.1177
571BACH1P4T-EHumanEsophagusESCC1.05e-163.06e-010.1323
571BACH1P5T-EHumanEsophagusESCC8.96e-161.49e-010.1327
571BACH1P8T-EHumanEsophagusESCC5.09e-138.00e-020.0889
571BACH1P9T-EHumanEsophagusESCC1.54e-161.23e-010.1131
571BACH1P10T-EHumanEsophagusESCC2.61e-162.29e-010.116
571BACH1P11T-EHumanEsophagusESCC1.06e-115.56e-010.1426
571BACH1P12T-EHumanEsophagusESCC1.42e-112.03e-010.1122
571BACH1P15T-EHumanEsophagusESCC2.26e-181.85e-010.1149
571BACH1P16T-EHumanEsophagusESCC1.01e-171.25e-010.1153
571BACH1P17T-EHumanEsophagusESCC5.24e-033.81e-010.1278
571BACH1P20T-EHumanEsophagusESCC1.34e-091.11e-010.1124
Page: 1 2 3 4 5 6 7 

check button Transcriptomic changes along malignancy continuum.
TissueExpression DynamicsAbbreviation
EsophagusThe image shows the transcriptomic changes along malignancy continuum.log2FC in expression of this searched gene in stem-like cells from each diseased tissue sample relative to stem-like cells in normal samples in each tissue plotted against the malignancy continuum. Samples are colored based on if they are from different disease stage.
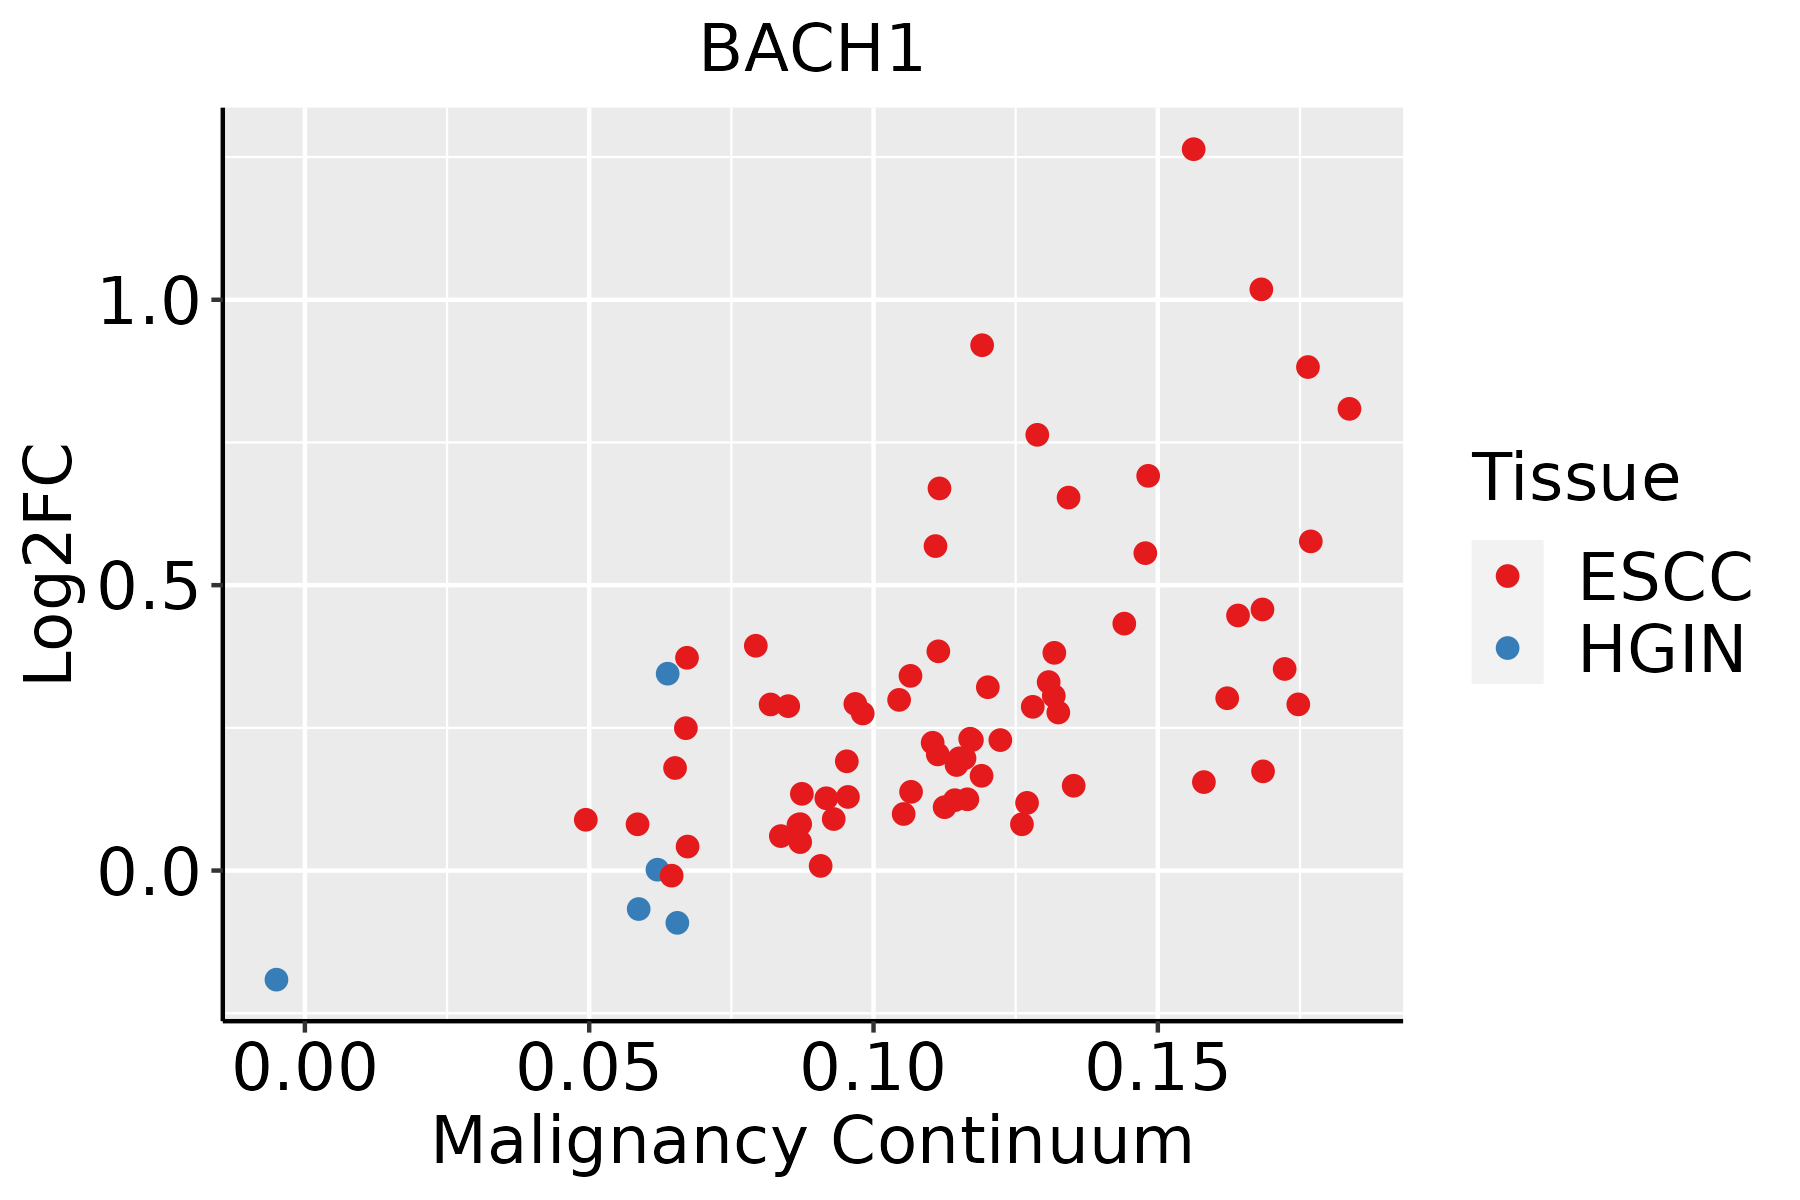
ESCC: Esophageal squamous cell carcinoma
HGIN: High-grade intraepithelial neoplasias
LGIN: Low-grade intraepithelial neoplasias
LiverThe image shows the transcriptomic changes along malignancy continuum.log2FC in expression of this searched gene in stem-like cells from each diseased tissue sample relative to stem-like cells in normal samples in each tissue plotted against the malignancy continuum. Samples are colored based on if they are from different disease stage.
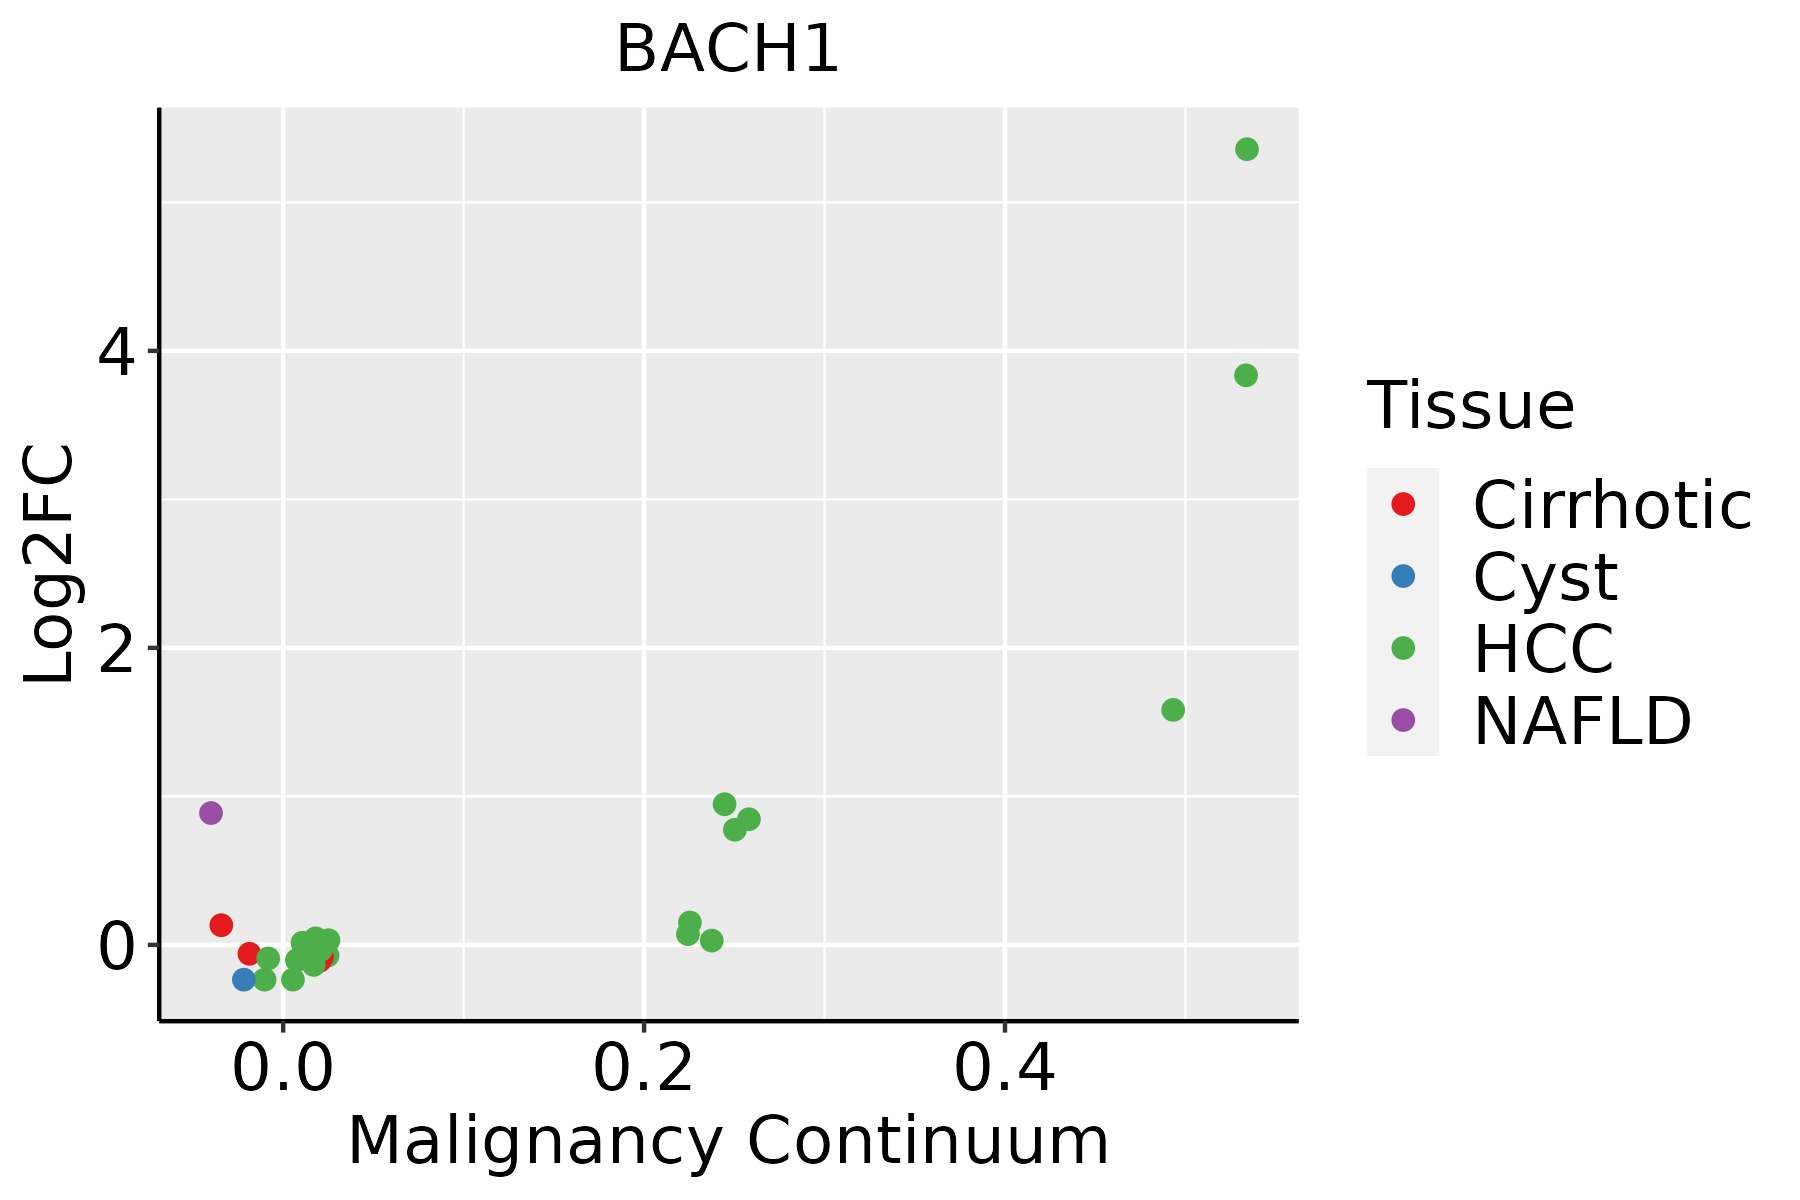
HCC: Hepatocellular carcinoma
NAFLD: Non-alcoholic fatty liver disease
LungThe image shows the transcriptomic changes along malignancy continuum.log2FC in expression of this searched gene in stem-like cells from each diseased tissue sample relative to stem-like cells in normal samples in each tissue plotted against the malignancy continuum. Samples are colored based on if they are from different disease stage.AAH: Atypical adenomatous hyperplasia
AIS: Adenocarcinoma in situ
IAC: Invasive lung adenocarcinoma
MIA: Minimally invasive adenocarcinoma
Oral CavityThe image shows the transcriptomic changes along malignancy continuum.log2FC in expression of this searched gene in stem-like cells from each diseased tissue sample relative to stem-like cells in normal samples in each tissue plotted against the malignancy continuum. Samples are colored based on if they are from different disease stage.EOLP: Erosive Oral lichen planus
LP: leukoplakia
NEOLP: Non-erosive oral lichen planus
OSCC: Oral squamous cell carcinoma
ProstateThe image shows the transcriptomic changes along malignancy continuum.log2FC in expression of this searched gene in stem-like cells from each diseased tissue sample relative to stem-like cells in normal samples in each tissue plotted against the malignancy continuum. Samples are colored based on if they are from different disease stage.
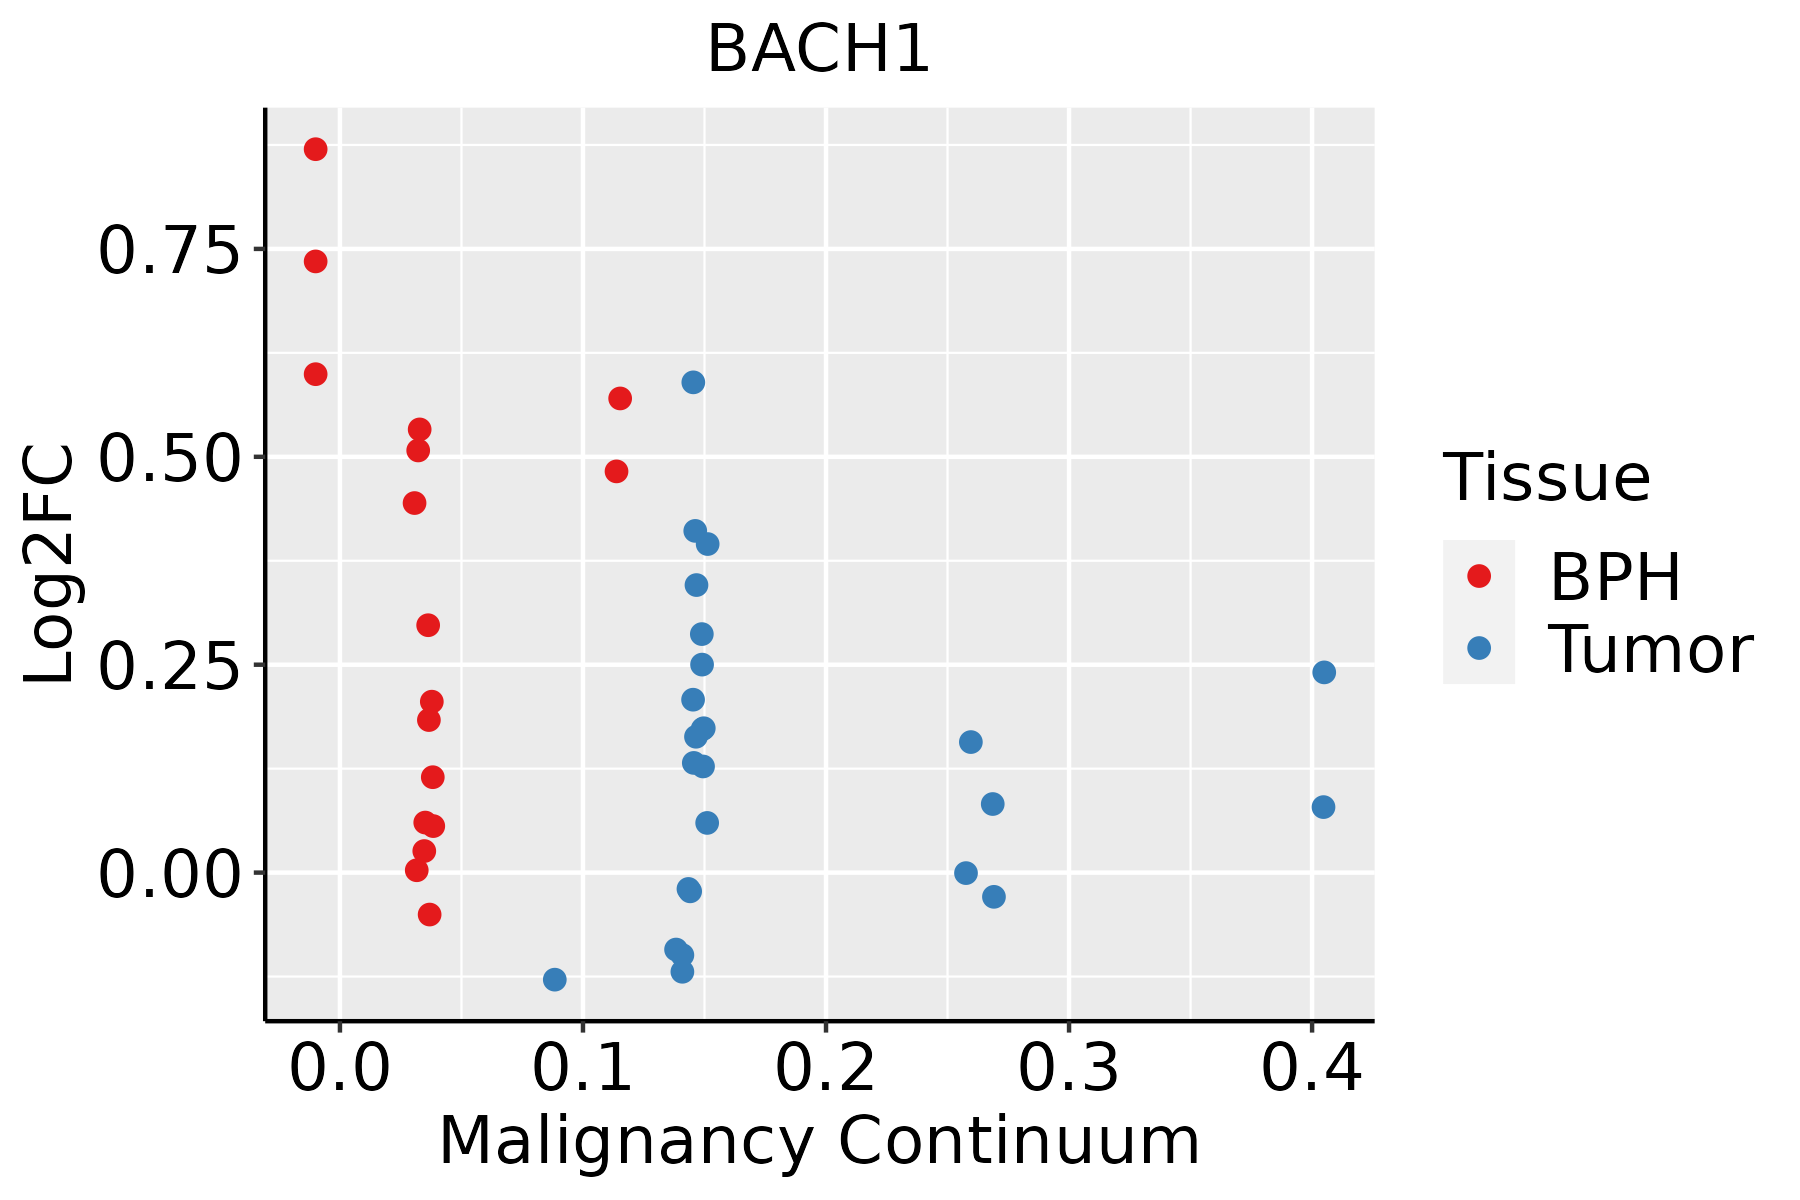
BPH: Benign Prostatic Hyperplasia
SkinThe image shows the transcriptomic changes along malignancy continuum.log2FC in expression of this searched gene in stem-like cells from each diseased tissue sample relative to stem-like cells in normal samples in each tissue plotted against the malignancy continuum. Samples are colored based on if they are from different disease stage.
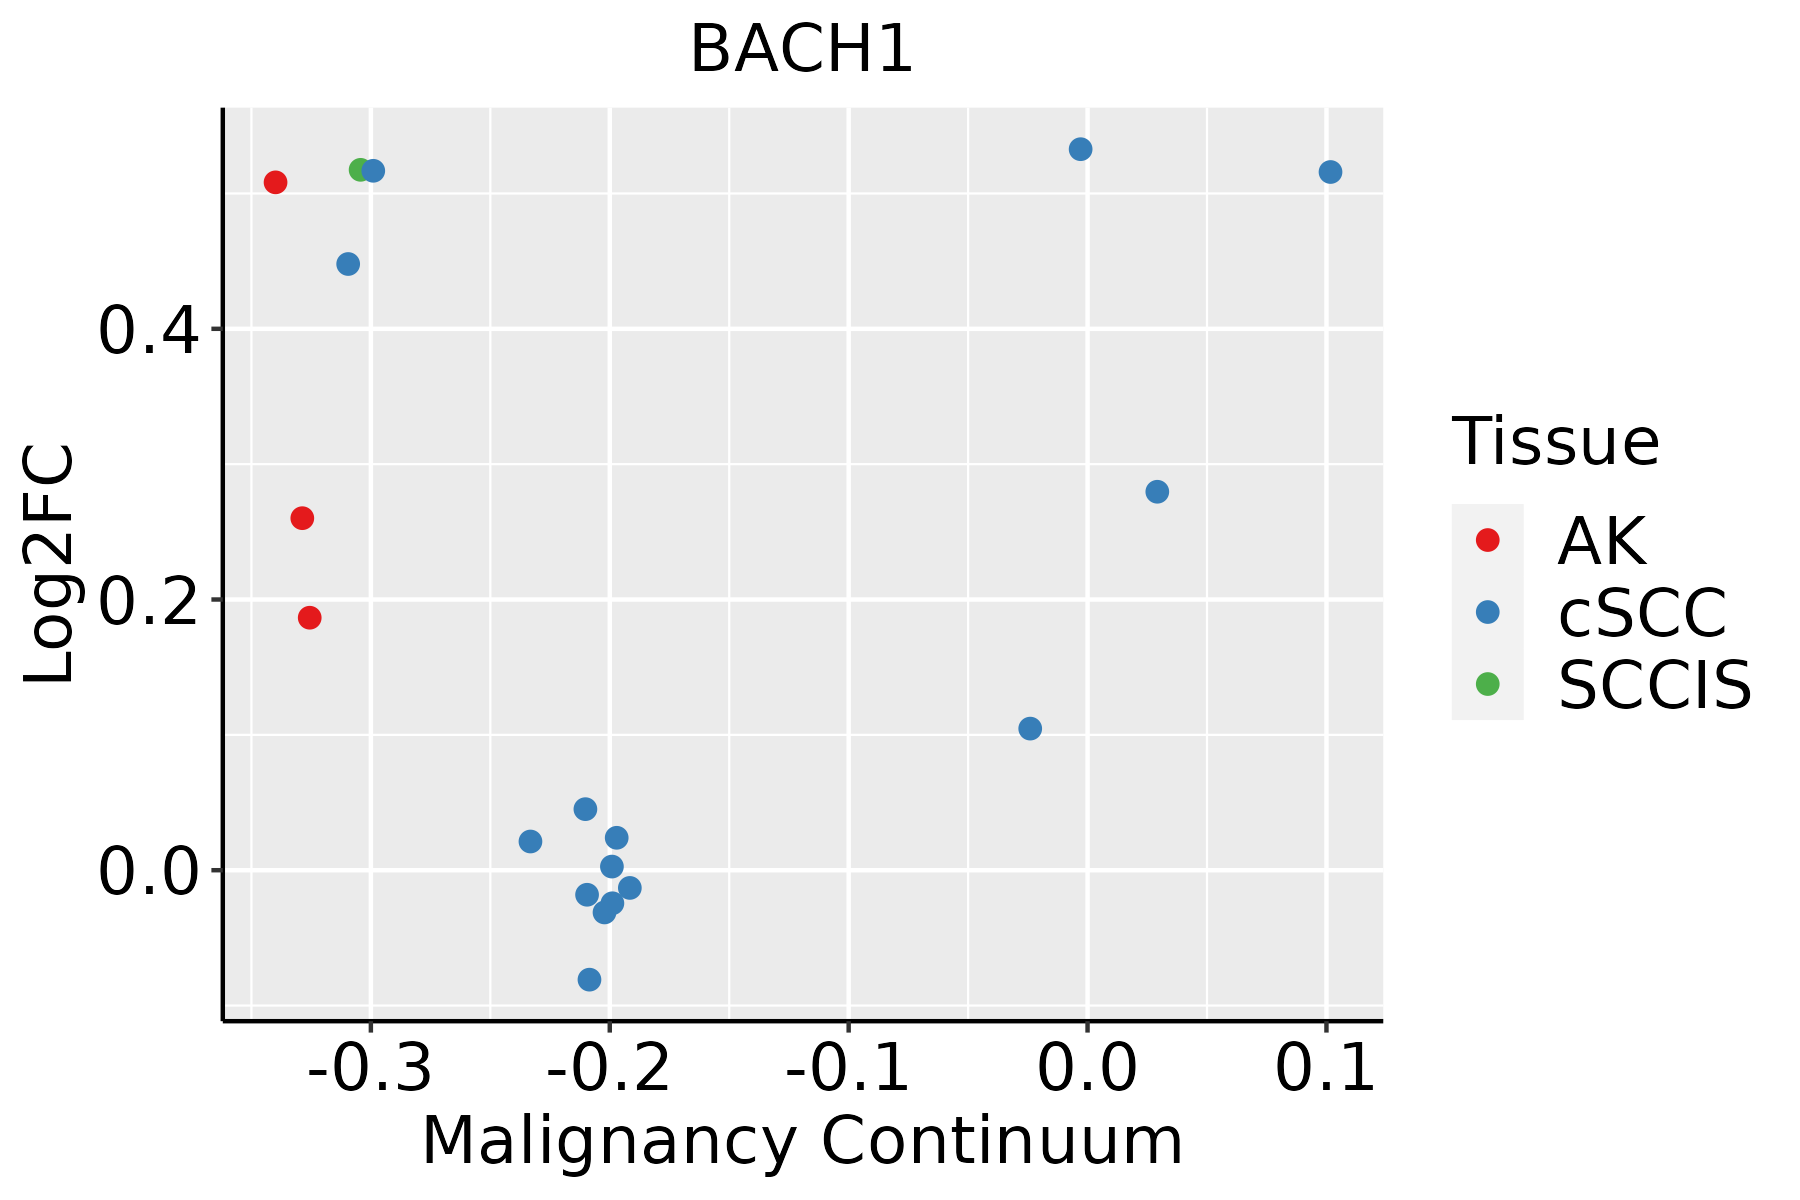
AK: Actinic keratosis
cSCC: Cutaneous squamous cell carcinoma
SCCIS:squamous cell carcinoma in situ
ThyroidThe image shows the transcriptomic changes along malignancy continuum.log2FC in expression of this searched gene in stem-like cells from each diseased tissue sample relative to stem-like cells in normal samples in each tissue plotted against the malignancy continuum. Samples are colored based on if they are from different disease stage.
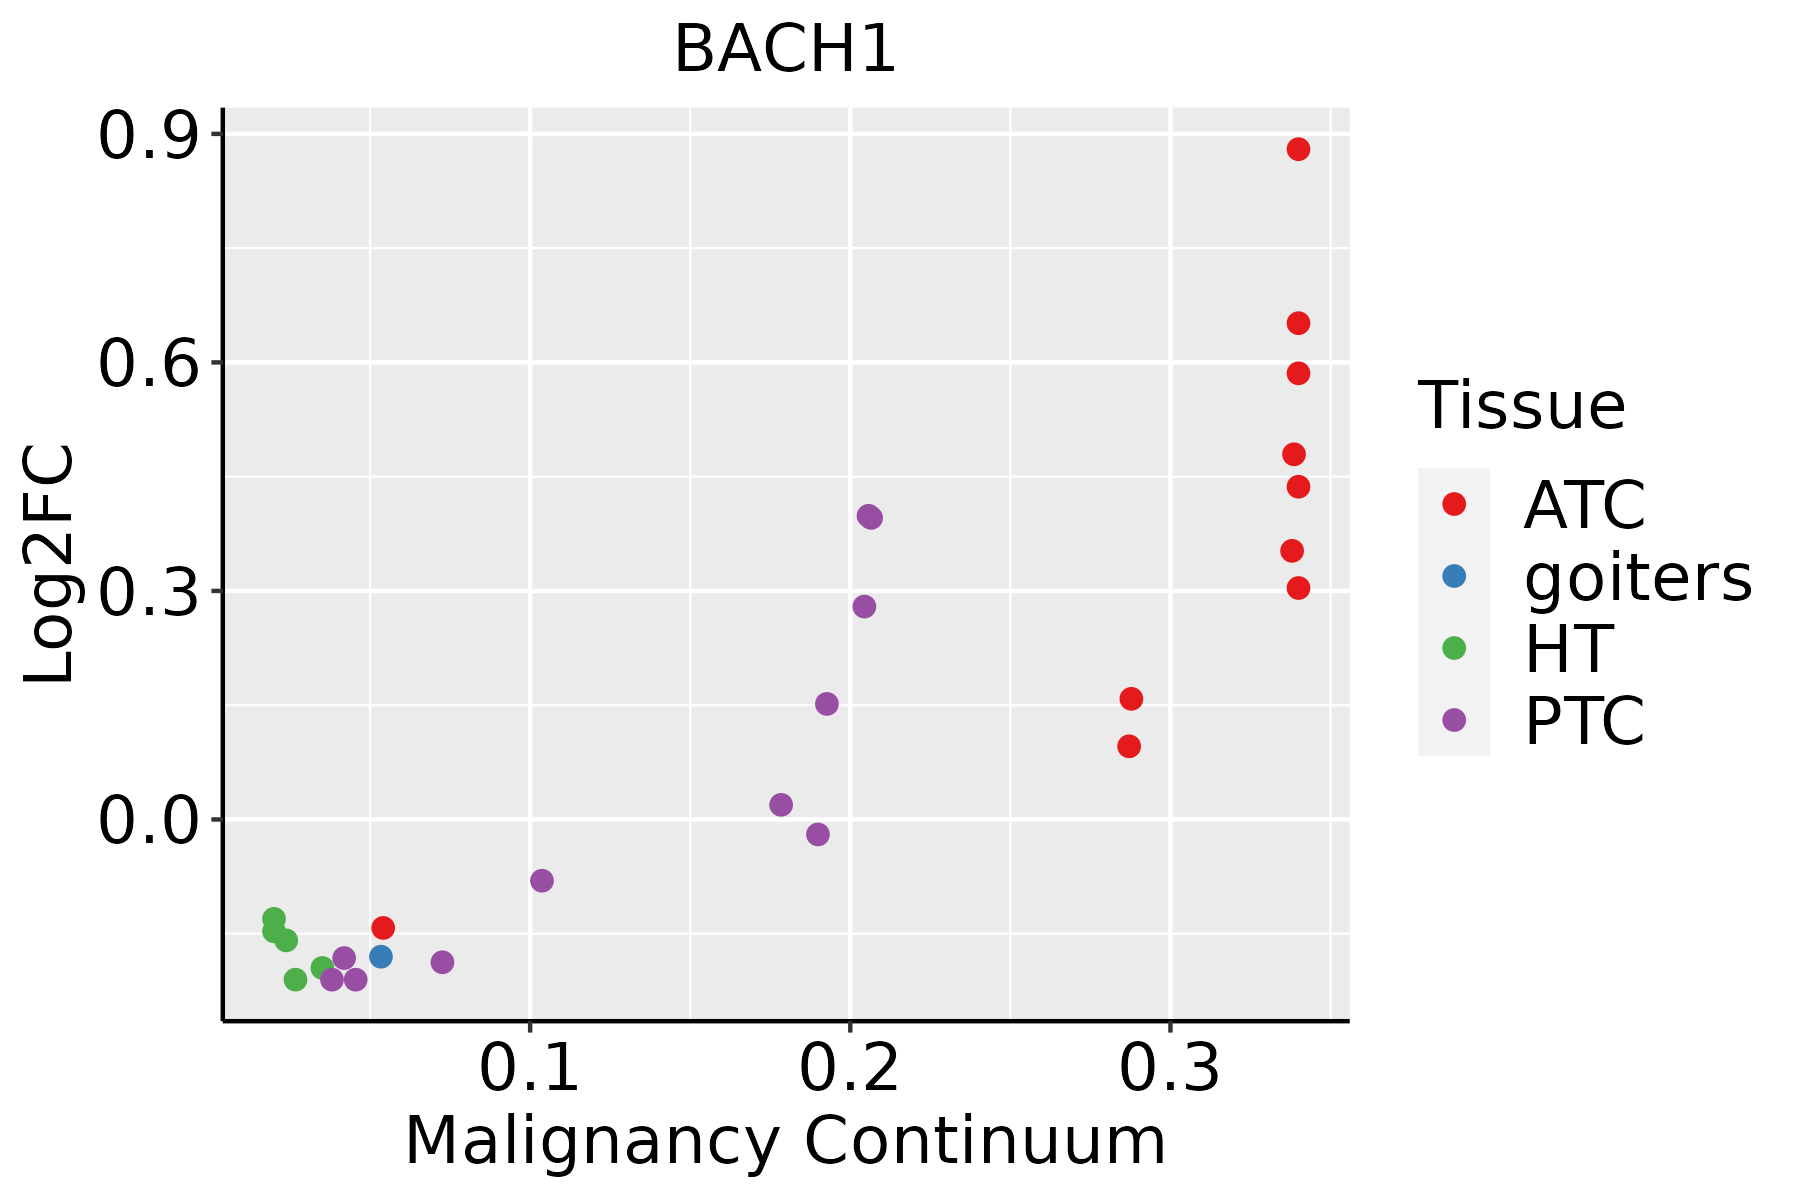
ATC: Anaplastic thyroid cancer
HT: Hashimoto's thyroiditis
PTC: Papillary thyroid cancer
∗log2FC in expression of this searched gene in stem-like cells from each diseased tissue sample relative to stem-like cells in normal samples in each tissue plotted against the malignancy continuum. Samples are colored based on if they are from different disease stage.

Top

Malignant transformation related pathway analysis

check buttonFind out the enriched GO biological processes and KEGG pathways involved in transition from healthy to precancer to cancer
check button Figure of enriched GO biological processes.
TissueDisease StageEnriched GO biological Processes
ColorectumADGO analysis - Figure of enriched GO biological processes: Top 15 enriched GO BP terms are showed in the bar plot of each disease state in each tissue. Each row represents a significant GO biological process which is colored according to the -log10(p.adjust).
ColorectumSERGO analysis - Figure of enriched GO biological processes: Top 15 enriched GO BP terms are showed in the bar plot of each disease state in each tissue. Each row represents a significant GO biological process which is colored according to the -log10(p.adjust).
ColorectumMSSGO analysis - Figure of enriched GO biological processes: Top 15 enriched GO BP terms are showed in the bar plot of each disease state in each tissue. Each row represents a significant GO biological process which is colored according to the -log10(p.adjust).
ColorectumMSI-HGO analysis - Figure of enriched GO biological processes: Top 15 enriched GO BP terms are showed in the bar plot of each disease state in each tissue. Each row represents a significant GO biological process which is colored according to the -log10(p.adjust).
ColorectumFAPGO analysis - Figure of enriched GO biological processes: Top 15 enriched GO BP terms are showed in the bar plot of each disease state in each tissue. Each row represents a significant GO biological process which is colored according to the -log10(p.adjust).
∗Top 15 enriched GO BP terms are showed in the bar plot of each disease state in each tissue. Each row represents a significant GO biological process which is colored according to the -log10(p.adjust).
Page: 1 2 3 4 5 6 7 8 9 

check button Enriched GO biological processes.
GO IDTissueDisease StageDescriptionGene RatioBg Ratiopvaluep.adjustCount
GO:004477216EsophagusESCCmitotic cell cycle phase transition281/8552424/187234.63e-184.45e-16281
GO:0070482111EsophagusESCCresponse to oxygen levels218/8552347/187236.91e-112.17e-09218
GO:0043618111EsophagusESCCregulation of transcription from RNA polymerase II promoter in response to stress42/855247/187233.91e-101.05e-0842
GO:0043620111EsophagusESCCregulation of DNA-templated transcription in response to stress46/855253/187235.17e-101.33e-0846
GO:0036293111EsophagusESCCresponse to decreased oxygen levels201/8552322/187238.37e-102.04e-08201
GO:0001666111EsophagusESCCresponse to hypoxia192/8552307/187231.59e-093.69e-08192
GO:00448394EsophagusESCCcell cycle G2/M phase transition103/8552148/187233.09e-096.67e-08103
GO:00000864EsophagusESCCG2/M transition of mitotic cell cycle96/8552137/187236.00e-091.23e-0796
GO:0071453110EsophagusESCCcellular response to oxygen levels114/8552177/187233.63e-075.06e-06114
GO:000008214EsophagusESCCG1/S transition of mitotic cell cycle134/8552214/187234.04e-075.55e-06134
GO:0036294110EsophagusESCCcellular response to decreased oxygen levels105/8552161/187234.20e-075.73e-06105
GO:004484314EsophagusESCCcell cycle G1/S phase transition148/8552241/187235.68e-077.48e-06148
GO:007145616EsophagusESCCcellular response to hypoxia97/8552151/187233.12e-063.51e-0597
GO:00614184EsophagusESCCregulation of transcription from RNA polymerase II promoter in response to hypoxia13/855213/187233.75e-053.04e-0413
GO:0044772LiverNAFLDmitotic cell cycle phase transition67/1882424/187231.25e-042.39e-0367
GO:0044843LiverNAFLDcell cycle G1/S phase transition43/1882241/187231.40e-042.63e-0343
GO:0000082LiverNAFLDG1/S transition of mitotic cell cycle39/1882214/187231.78e-043.14e-0339
GO:00436207LiverNAFLDregulation of DNA-templated transcription in response to stress14/188253/187235.66e-047.59e-0314
GO:00436187LiverNAFLDregulation of transcription from RNA polymerase II promoter in response to stress11/188247/187235.92e-034.47e-0211
GO:00447722LiverHCCmitotic cell cycle phase transition240/7958424/187232.47e-096.84e-08240
Page: 1 2 3 4 5 6 7 8 9 

check button Enriched KEGG pathways.
Pathway IDTissueDisease StageDescriptionGene RatioBg Ratiopvaluep.adjustqvalueCount
Page: 1 

Top

Cell-cell communication analysis

check buttonIdentification of potential cell-cell interactions between two cell types and their ligand-receptor pairs for different disease states
LigandReceptorLRpairPathwayTissueDisease Stage
Page: 1 

Top

Single-cell gene regulatory network inference analysis

check buttonFind out the significant the regulons (TFs) and the target genes of each regulon across cell types for different disease states
TFCell TypeTissueDisease StageTarget GeneRSSRegulon Activity
BACH1SMCCervixHealthyCYTOR,ARID5B,AC016831.1, etc.8.36e-01The dot plots of a searched regulon are shown for all cell subpopulations in each disease state of each tissue based on the regulon specific score inferred using pySCENIC and by calculating the average expression.
BACH1MSCPancreasADJRELN,GRIK1,MIR4435-2HG, etc.6.41e-03The dot plots of a searched regulon are shown for all cell subpopulations in each disease state of each tissue based on the regulon specific score inferred using pySCENIC and by calculating the average expression.
BACH1MSCPancreasPDACRELN,GRIK1,MIR4435-2HG, etc.1.06e-01The dot plots of a searched regulon are shown for all cell subpopulations in each disease state of each tissue based on the regulon specific score inferred using pySCENIC and by calculating the average expression.
BACH1INMONProstateADJAQP9,THBS1,TNIP3, etc.1.69e-01The dot plots of a searched regulon are shown for all cell subpopulations in each disease state of each tissue based on the regulon specific score inferred using pySCENIC and by calculating the average expression.
BACH1INMONProstateBPHAQP9,THBS1,TNIP3, etc.2.27e-01The dot plots of a searched regulon are shown for all cell subpopulations in each disease state of each tissue based on the regulon specific score inferred using pySCENIC and by calculating the average expression.
BACH1INMONProstateHealthyAQP9,THBS1,TNIP3, etc.2.03e-01The dot plots of a searched regulon are shown for all cell subpopulations in each disease state of each tissue based on the regulon specific score inferred using pySCENIC and by calculating the average expression.
BACH1INMONProstateTumorAQP9,THBS1,TNIP3, etc.1.58e-01The dot plots of a searched regulon are shown for all cell subpopulations in each disease state of each tissue based on the regulon specific score inferred using pySCENIC and by calculating the average expression.
BACH1BASSkinAKSH3RF2,DIP2B,ROBO1, etc.2.19e-01The dot plots of a searched regulon are shown for all cell subpopulations in each disease state of each tissue based on the regulon specific score inferred using pySCENIC and by calculating the average expression.
∗The dot plots of a searched regulon are shown for all cell subpopulations in each disease state of each tissue based on the regulon specific score inferred using pySCENIC and by calculating the average expression.
Page: 1 

Top

Somatic mutation of malignant transformation related genes

check buttonAnnotation of somatic variants for genes involved in malignant transformation
Hugo SymbolVariant ClassVariant ClassificationdbSNP RSHGVScHGVSpHGVSp ShortSWISSPROTBIOTYPESIFTPolyPhenTumor Sample BarcodeTissueHistologySexAgeStageTherapy TypesDrugsOutcome
BACH1SNVMissense_Mutationc.1220N>Ap.Ser407Asnp.S407NO14867protein_codingtolerated(0.46)benign(0.003)TCGA-AN-A0AK-01Breastbreast invasive carcinomaFemale>=65I/IIUnknownUnknownSD
BACH1SNVMissense_Mutationc.1262C>Tp.Ala421Valp.A421VO14867protein_codingtolerated(0.33)benign(0.007)TCGA-AR-A1AQ-01Breastbreast invasive carcinomaFemale<65I/IIChemotherapydoxorubicinSD
BACH1insertionIn_Frame_Insnovelc.1395_1396insGTATCAp.Ser465_Thr466insValSerp.S465_T466insVSO14867protein_codingTCGA-A2-A0D1-01Breastbreast invasive carcinomaFemale>=65I/IIChemotherapytaxotereSD
BACH1insertionNonsense_Mutationnovelc.1397_1398insAGGTGACAGTTAAAGGATTTGAACCTTTAATp.Leu467GlyfsTer4p.L467Gfs*4O14867protein_codingTCGA-A2-A0D1-01Breastbreast invasive carcinomaFemale>=65I/IIChemotherapytaxotereSD
BACH1insertionNonsense_Mutationnovelc.605_606insATCACTTTTAAAAATCTGAATCTTTAAAACTTTTACTGTTAGGAAp.Ser202delinsArgSerLeuLeuLysIleTerIlePheLysThrPheThrValArgAsnp.S202delinsRSLLKI*IFKTFTVRNO14867protein_codingTCGA-A8-A06X-01Breastbreast invasive carcinomaFemale>=65I/IIUnknownUnknownSD
BACH1insertionNonsense_Mutationnovelc.517_518insAGAGAGATATGp.Phe173Terp.F173*O14867protein_codingTCGA-AR-A0U0-01Breastbreast invasive carcinomaFemale>=65I/IIUnknownUnknownSD
BACH1SNVMissense_Mutationc.1946N>Tp.Ser649Leup.S649LO14867protein_codingtolerated(0.1)benign(0.212)TCGA-DG-A2KH-01Cervixcervical & endocervical cancerFemale<65I/IIUnknownUnknownSD
BACH1SNVMissense_Mutationc.965C>Gp.Ser322Cysp.S322CO14867protein_codingdeleterious(0.01)possibly_damaging(0.533)TCGA-EK-A2H0-01Cervixcervical & endocervical cancerFemale<65I/IIChemotherapycisplatinCR
BACH1SNVMissense_Mutationc.1756N>Ap.Glu586Lysp.E586KO14867protein_codingdeleterious(0)probably_damaging(0.916)TCGA-EK-A2PI-01Cervixcervical & endocervical cancerFemale<65III/IVUnknownUnknownSD
BACH1SNVMissense_Mutationrs748491382c.1298C>Gp.Ser433Cysp.S433CO14867protein_codingdeleterious(0)possibly_damaging(0.751)TCGA-FU-A40J-01Cervixcervical & endocervical cancerFemale<65III/IVChemotherapycarboplatinCR
Page: 1 2 3 4 5 6 7 8 9 10 11 12 

Top

Related drugs of malignant transformation related genes

check buttonIdentification of chemicals and drugs interact with genes involved in malignant transfromation
(DGIdb 4.0)
Entrez IDSymbolCategoryInteraction TypesDrug Claim NameDrug NamePMIDs
571BACH1DNA REPAIR, TRANSCRIPTION FACTORisoniazidISONIAZID22341855,29036176
Page: 1