
|
|||||
|
 | |
| |
| |
| |
| |
| |
|
Gene: BABAM1 |
Gene summary for BABAM1 |
| Gene information | Species | Human | Gene symbol | BABAM1 | Gene ID | 29086 |
| Gene name | BRISC and BRCA1 A complex member 1 | |
| Gene Alias | C19orf62 | |
| Cytomap | 19p13.11 | |
| Gene Type | protein-coding | GO ID | GO:0000075 | UniProtAcc | A0A024R7L2 |
Top |
Malignant transformation analysis |
| Identification of the aberrant gene expression in precancerous and cancerous lesions by comparing the gene expression of stem-like cells in diseased tissues with normal stem cells |
| Entrez ID | Symbol | Replicates | Species | Organ | Tissue | Adj P-value | Log2FC | Malignancy |
| 29086 | BABAM1 | GSM4909282 | Human | Breast | IDC | 1.18e-02 | 3.11e-01 | -0.0288 |
| 29086 | BABAM1 | GSM4909285 | Human | Breast | IDC | 9.67e-23 | 6.12e-01 | 0.21 |
| 29086 | BABAM1 | GSM4909287 | Human | Breast | IDC | 2.80e-02 | 1.76e-01 | 0.2057 |
| 29086 | BABAM1 | GSM4909290 | Human | Breast | IDC | 1.04e-15 | 4.38e-01 | 0.2096 |
| 29086 | BABAM1 | GSM4909291 | Human | Breast | IDC | 9.01e-04 | 2.57e-01 | 0.1753 |
| 29086 | BABAM1 | GSM4909296 | Human | Breast | IDC | 1.04e-02 | 5.49e-02 | 0.1524 |
| 29086 | BABAM1 | GSM4909297 | Human | Breast | IDC | 2.90e-06 | -1.77e-02 | 0.1517 |
| 29086 | BABAM1 | GSM4909308 | Human | Breast | IDC | 6.16e-13 | 3.37e-01 | 0.158 |
| 29086 | BABAM1 | GSM4909311 | Human | Breast | IDC | 1.16e-16 | -1.52e-01 | 0.1534 |
| 29086 | BABAM1 | GSM4909312 | Human | Breast | IDC | 2.34e-03 | 2.66e-02 | 0.1552 |
| 29086 | BABAM1 | GSM4909319 | Human | Breast | IDC | 4.42e-22 | -4.77e-02 | 0.1563 |
| 29086 | BABAM1 | GSM4909320 | Human | Breast | IDC | 4.17e-16 | 6.50e-01 | 0.1575 |
| 29086 | BABAM1 | GSM4909321 | Human | Breast | IDC | 6.98e-33 | 6.94e-01 | 0.1559 |
| 29086 | BABAM1 | brca2 | Human | Breast | Precancer | 7.13e-03 | 2.04e-01 | -0.024 |
| 29086 | BABAM1 | DCIS2 | Human | Breast | DCIS | 5.90e-28 | -4.26e-03 | 0.0085 |
| 29086 | BABAM1 | HTA11_3410_2000001011 | Human | Colorectum | AD | 4.08e-27 | 4.97e-01 | 0.0155 |
| 29086 | BABAM1 | HTA11_2487_2000001011 | Human | Colorectum | SER | 2.43e-18 | 4.84e-01 | -0.1808 |
| 29086 | BABAM1 | HTA11_2951_2000001011 | Human | Colorectum | AD | 2.49e-08 | 3.89e-01 | 0.0216 |
| 29086 | BABAM1 | HTA11_1938_2000001011 | Human | Colorectum | AD | 2.05e-20 | 5.98e-01 | -0.0811 |
| 29086 | BABAM1 | HTA11_78_2000001011 | Human | Colorectum | AD | 7.41e-14 | 3.25e-01 | -0.1088 |
| Page: 1 2 3 4 5 6 7 8 9 10 |
| Tissue | Expression Dynamics | Abbreviation |
| Breast | 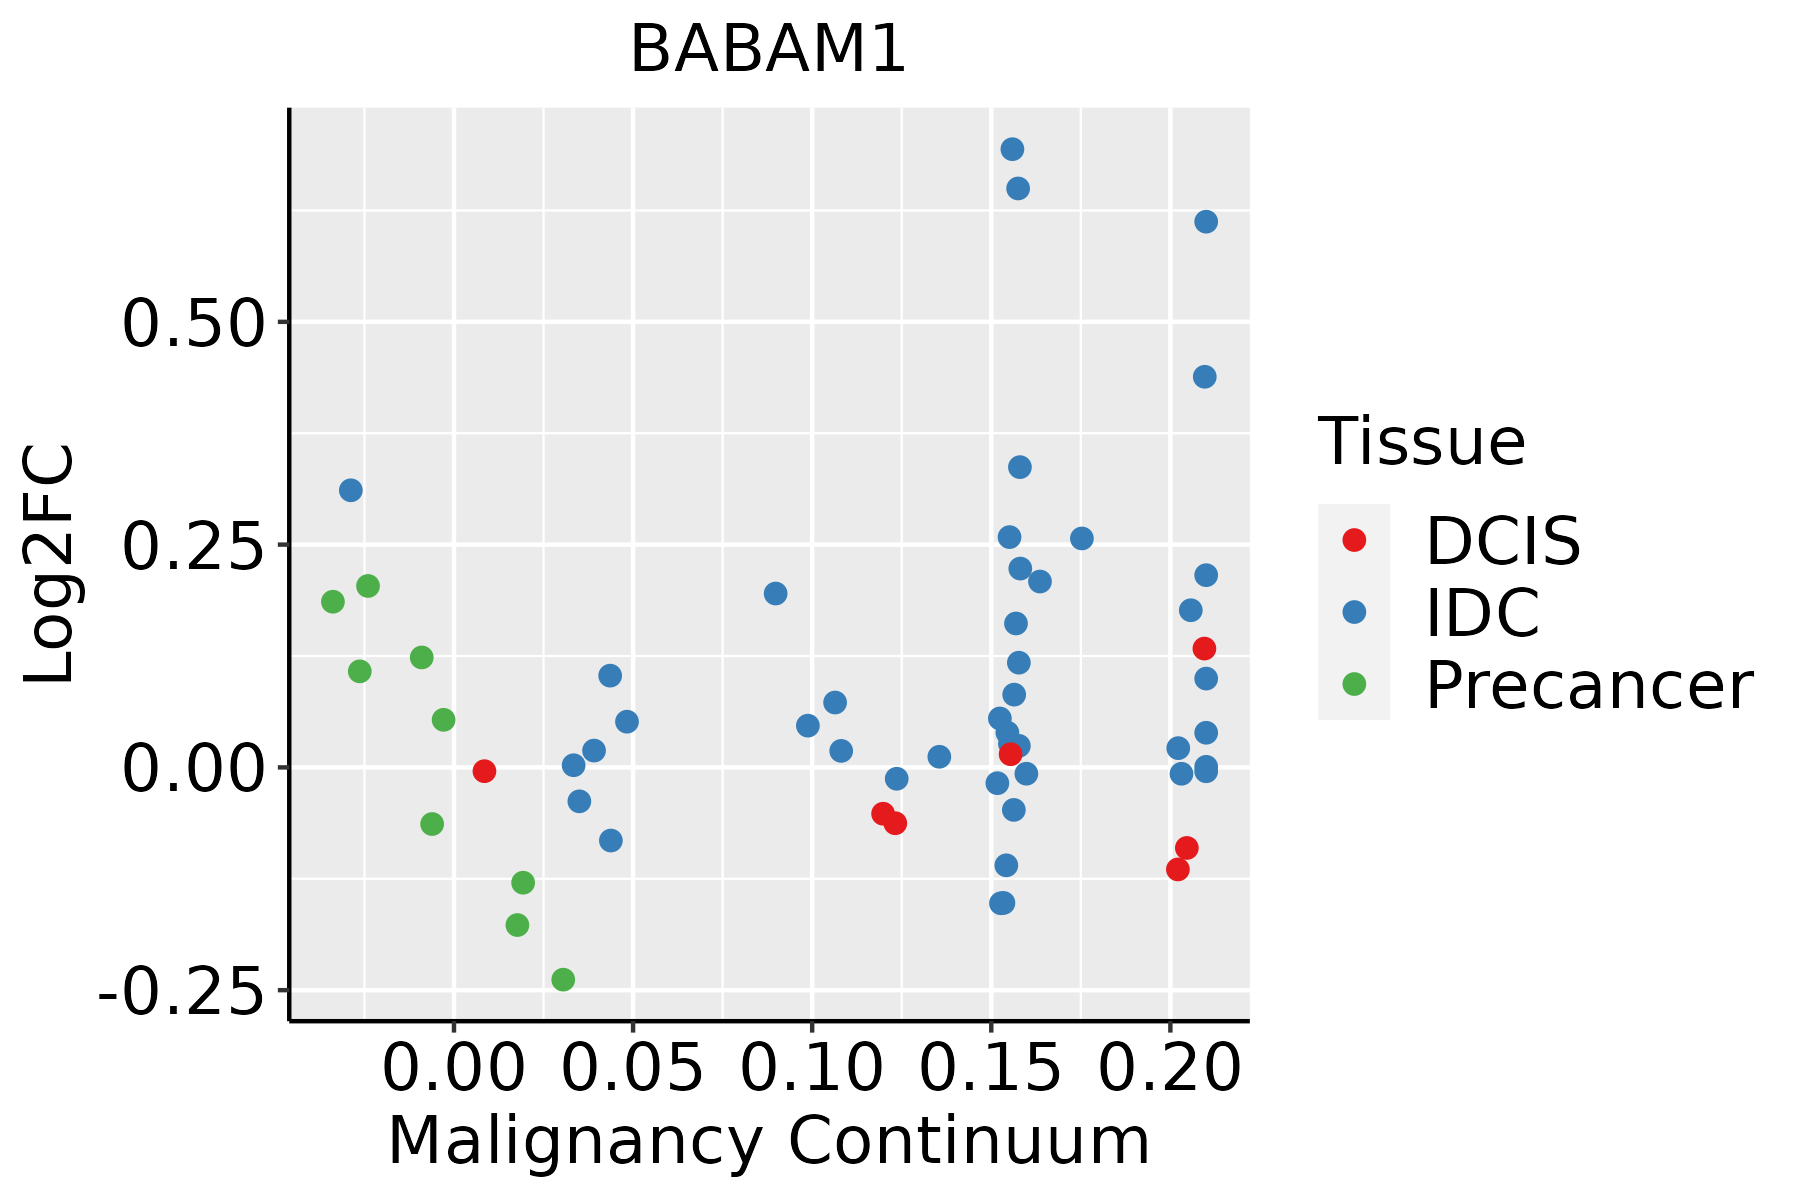 | IDC: Invasive ductal carcinoma |
| DCIS: Ductal carcinoma in situ | ||
| Precancer(BRCA1-mut): Precancerous lesion from BRCA1 mutation carriers | ||
| Colorectum (GSE201348) |  | FAP: Familial adenomatous polyposis |
| CRC: Colorectal cancer | ||
| Colorectum (HTA11) | 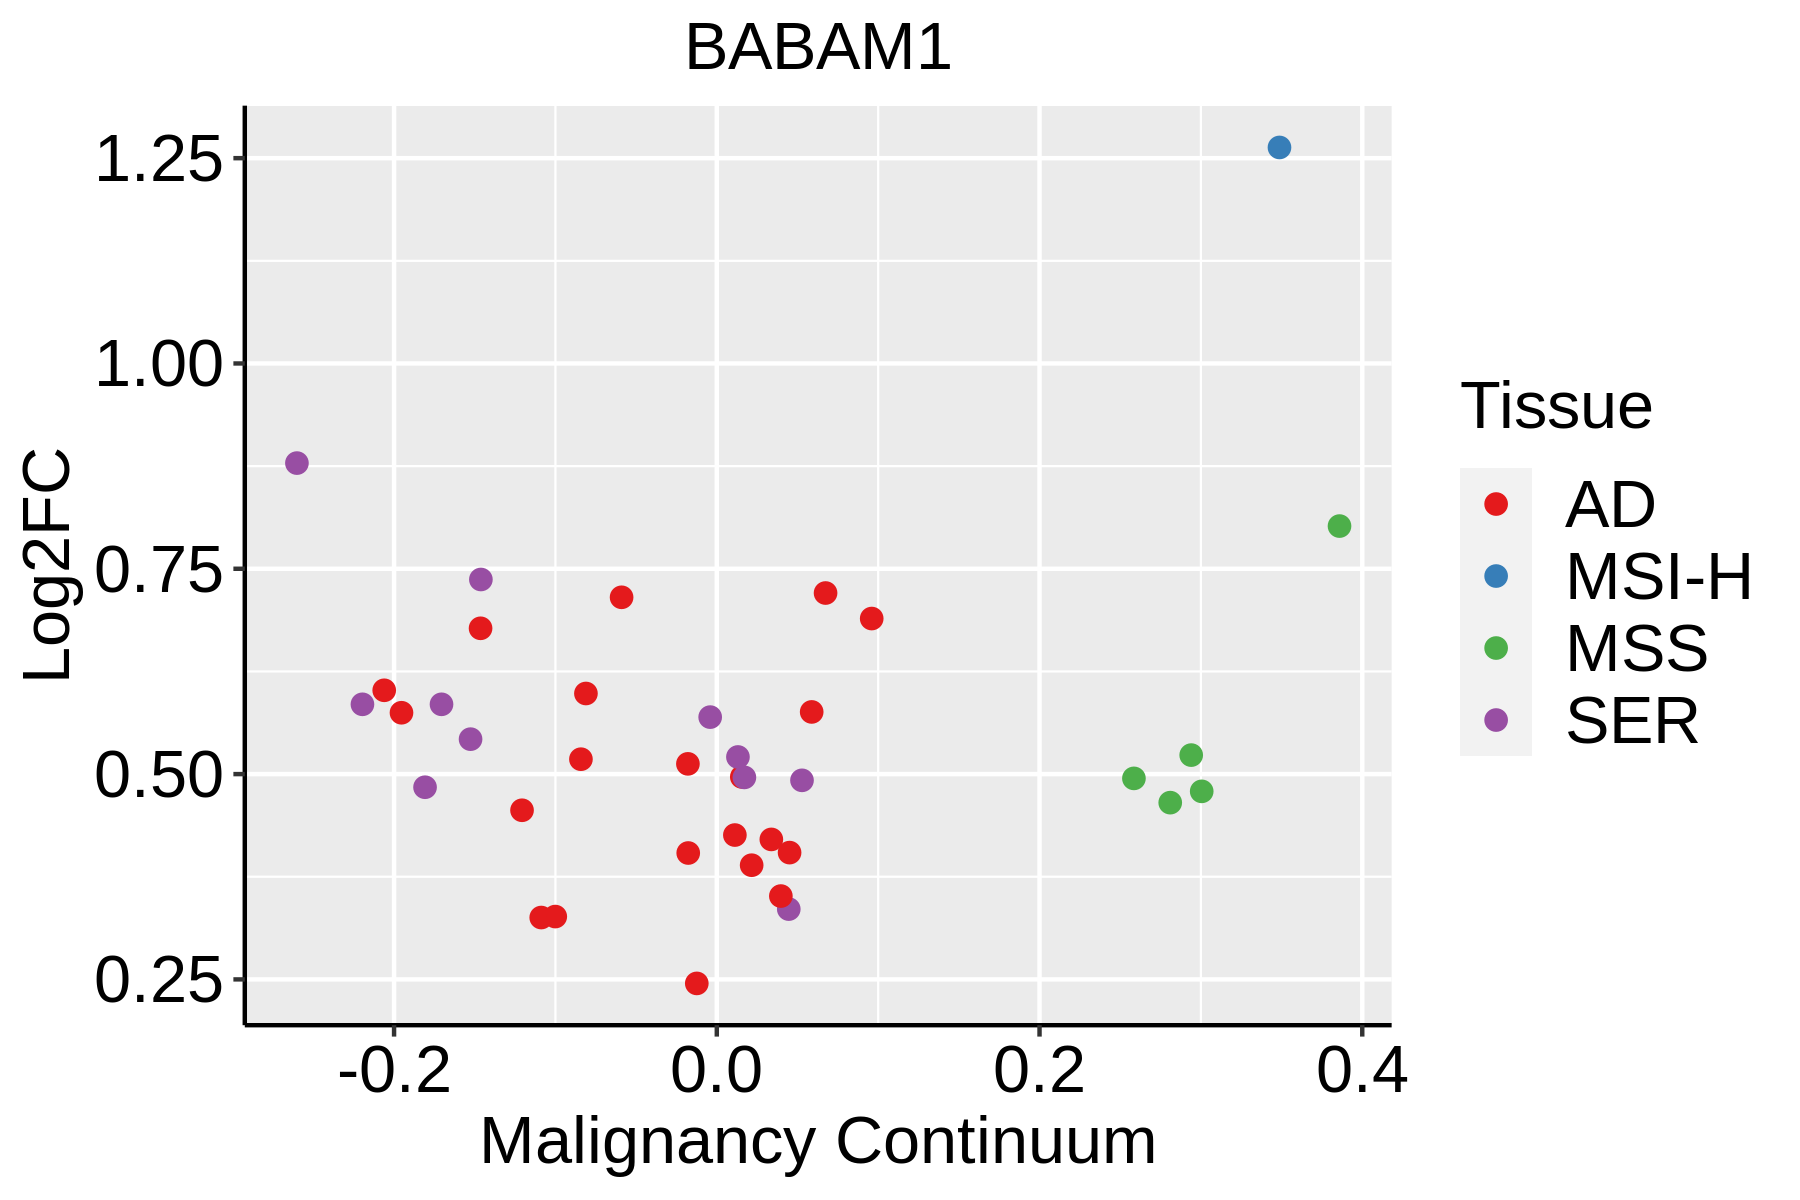 | AD: Adenomas |
| SER: Sessile serrated lesions | ||
| MSI-H: Microsatellite-high colorectal cancer | ||
| MSS: Microsatellite stable colorectal cancer | ||
| Esophagus | 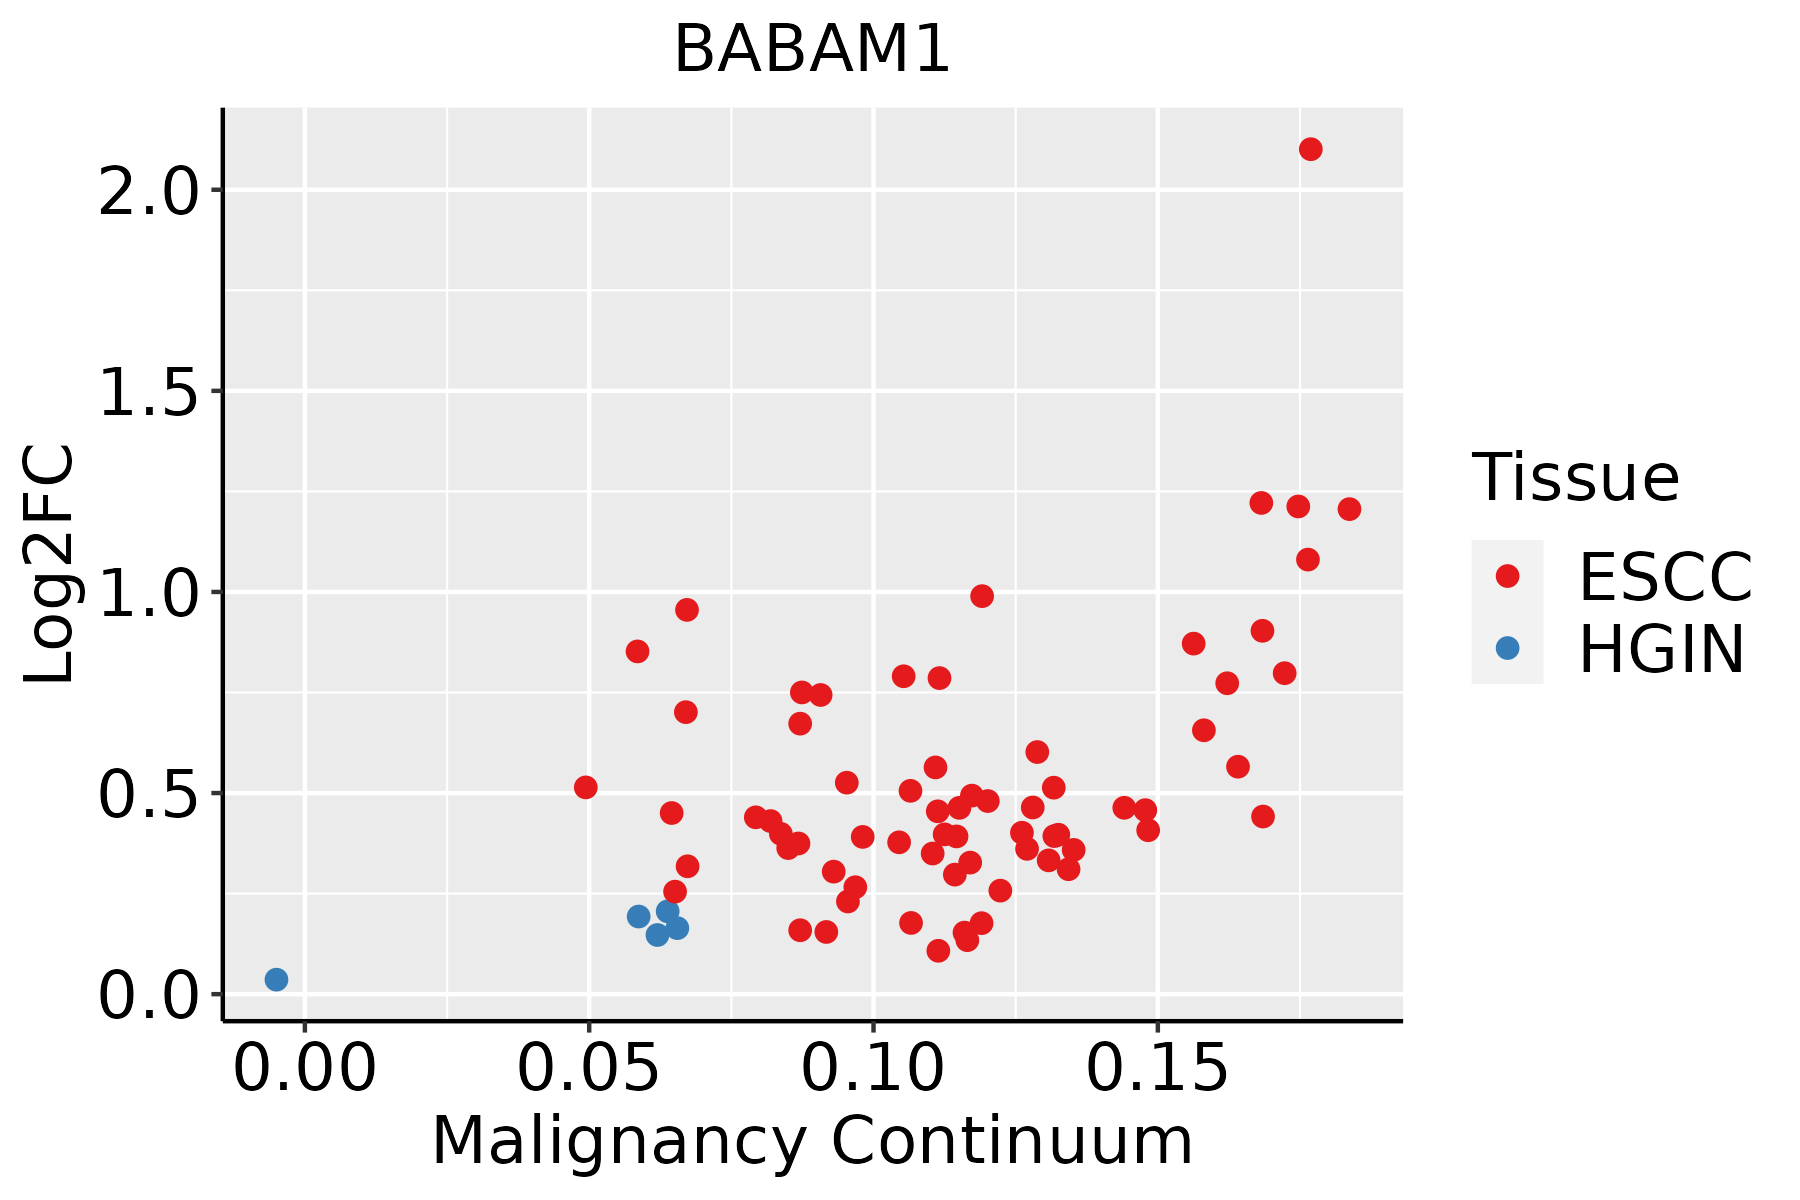 | ESCC: Esophageal squamous cell carcinoma |
| HGIN: High-grade intraepithelial neoplasias | ||
| LGIN: Low-grade intraepithelial neoplasias | ||
| Liver | 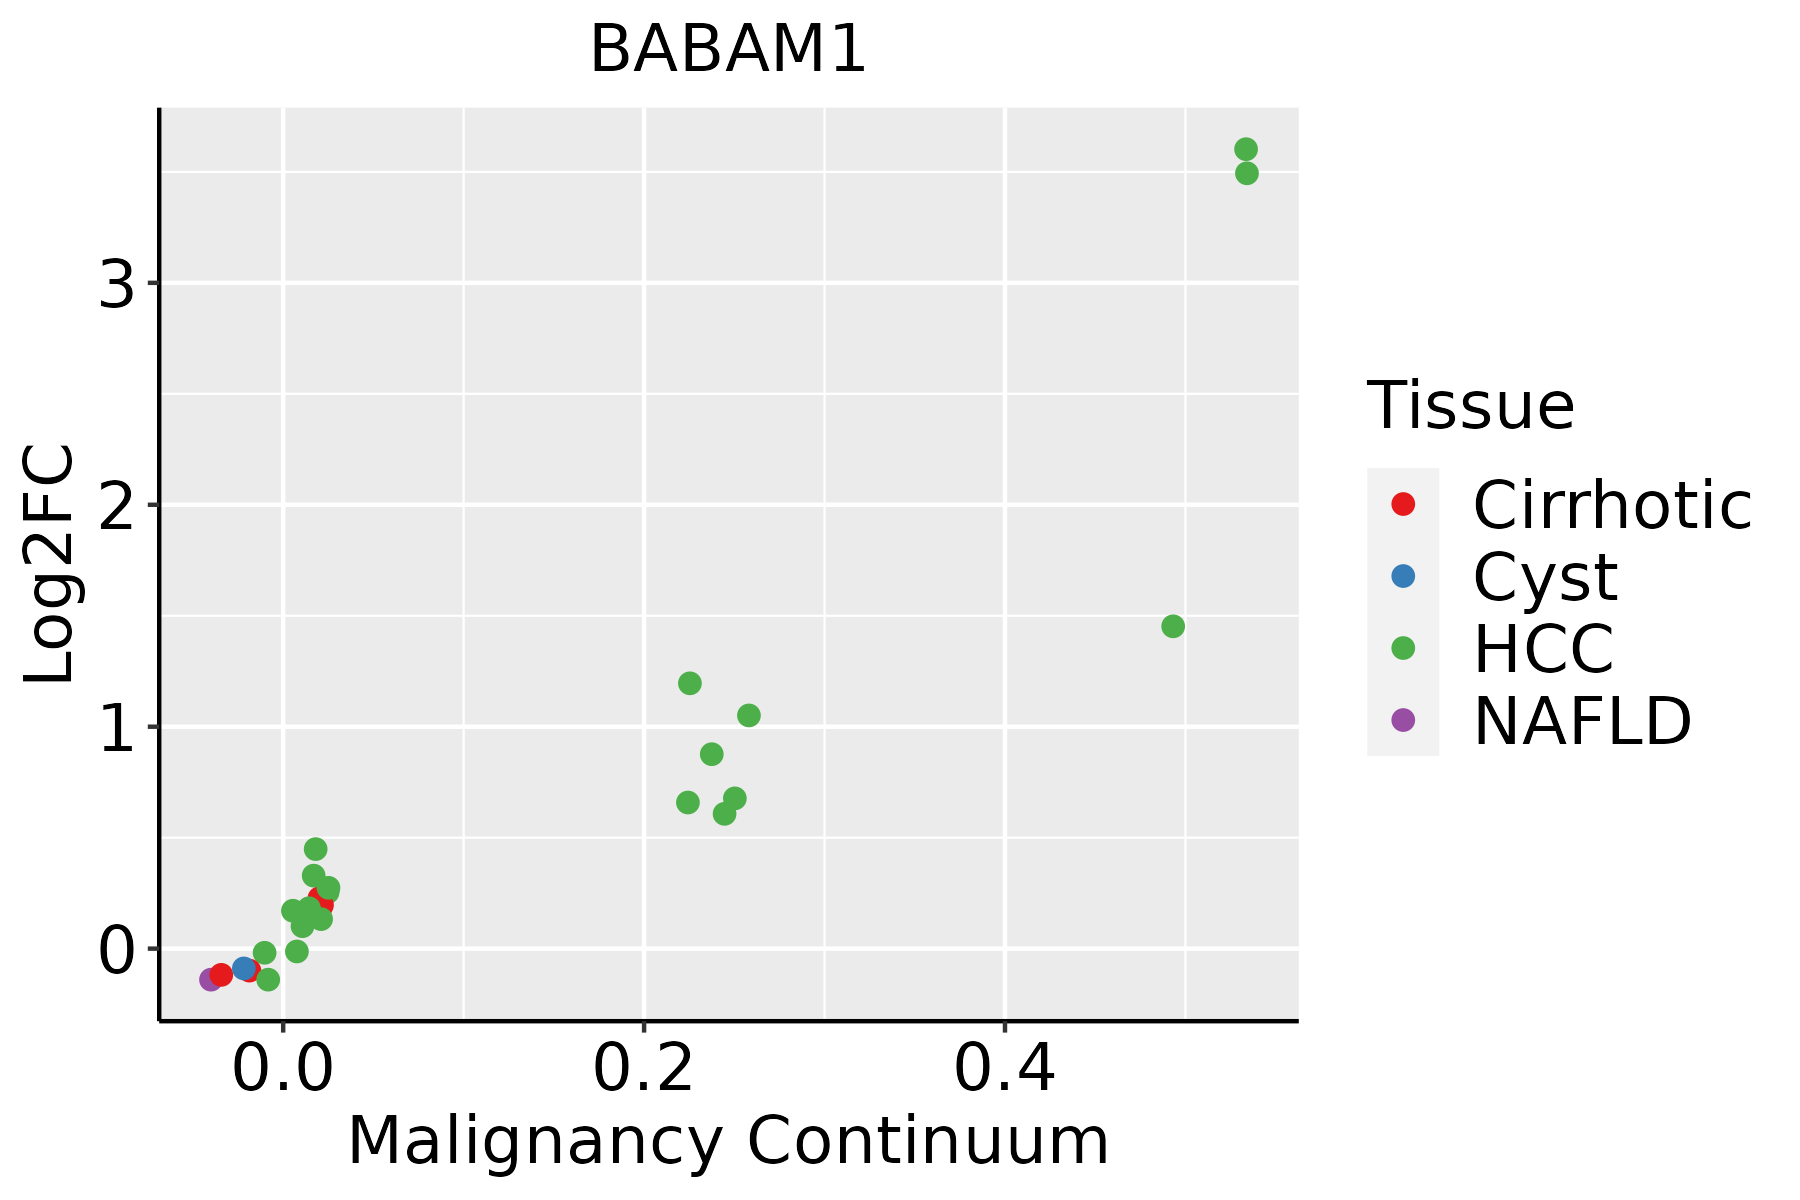 | HCC: Hepatocellular carcinoma |
| NAFLD: Non-alcoholic fatty liver disease | ||
| Oral Cavity |  | EOLP: Erosive Oral lichen planus |
| LP: leukoplakia | ||
| NEOLP: Non-erosive oral lichen planus | ||
| OSCC: Oral squamous cell carcinoma | ||
| Skin | 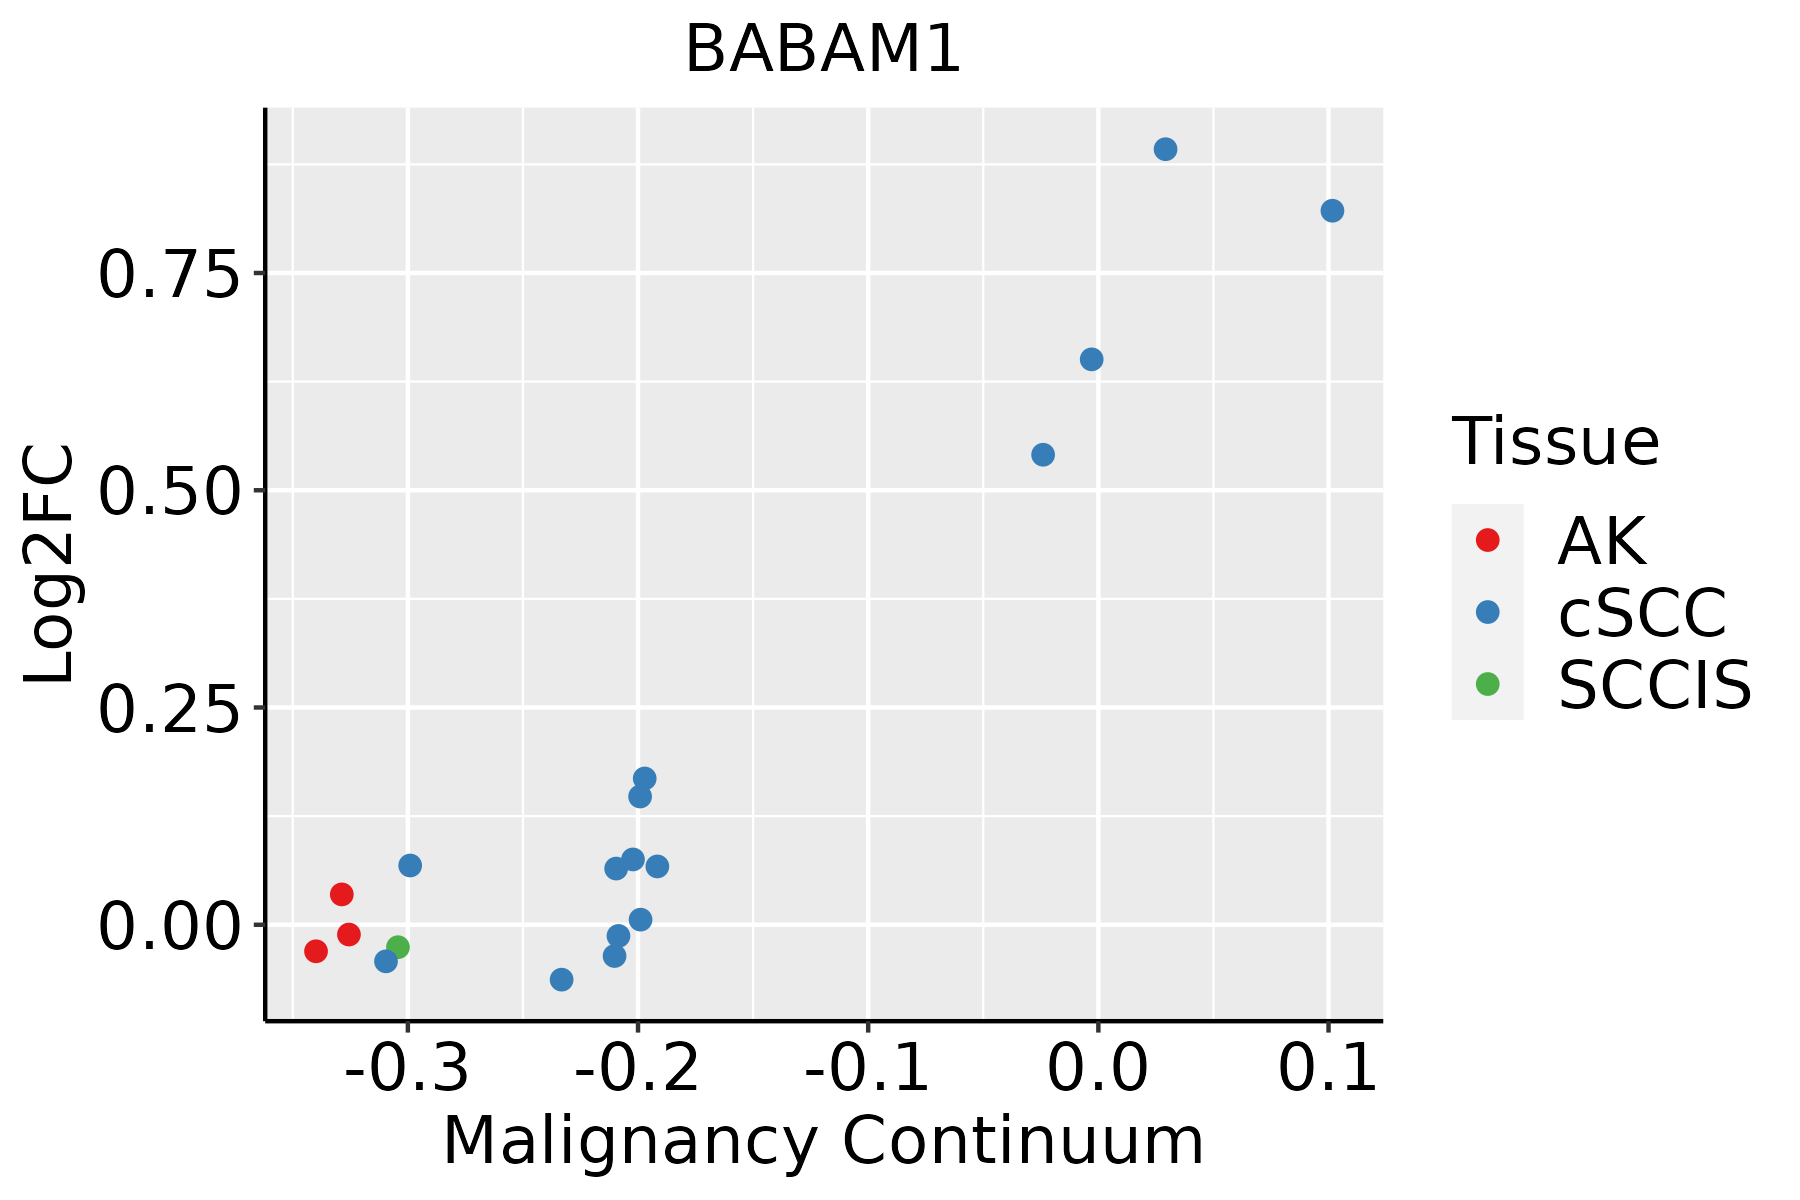 | AK: Actinic keratosis |
| cSCC: Cutaneous squamous cell carcinoma | ||
| SCCIS:squamous cell carcinoma in situ | ||
| Thyroid | 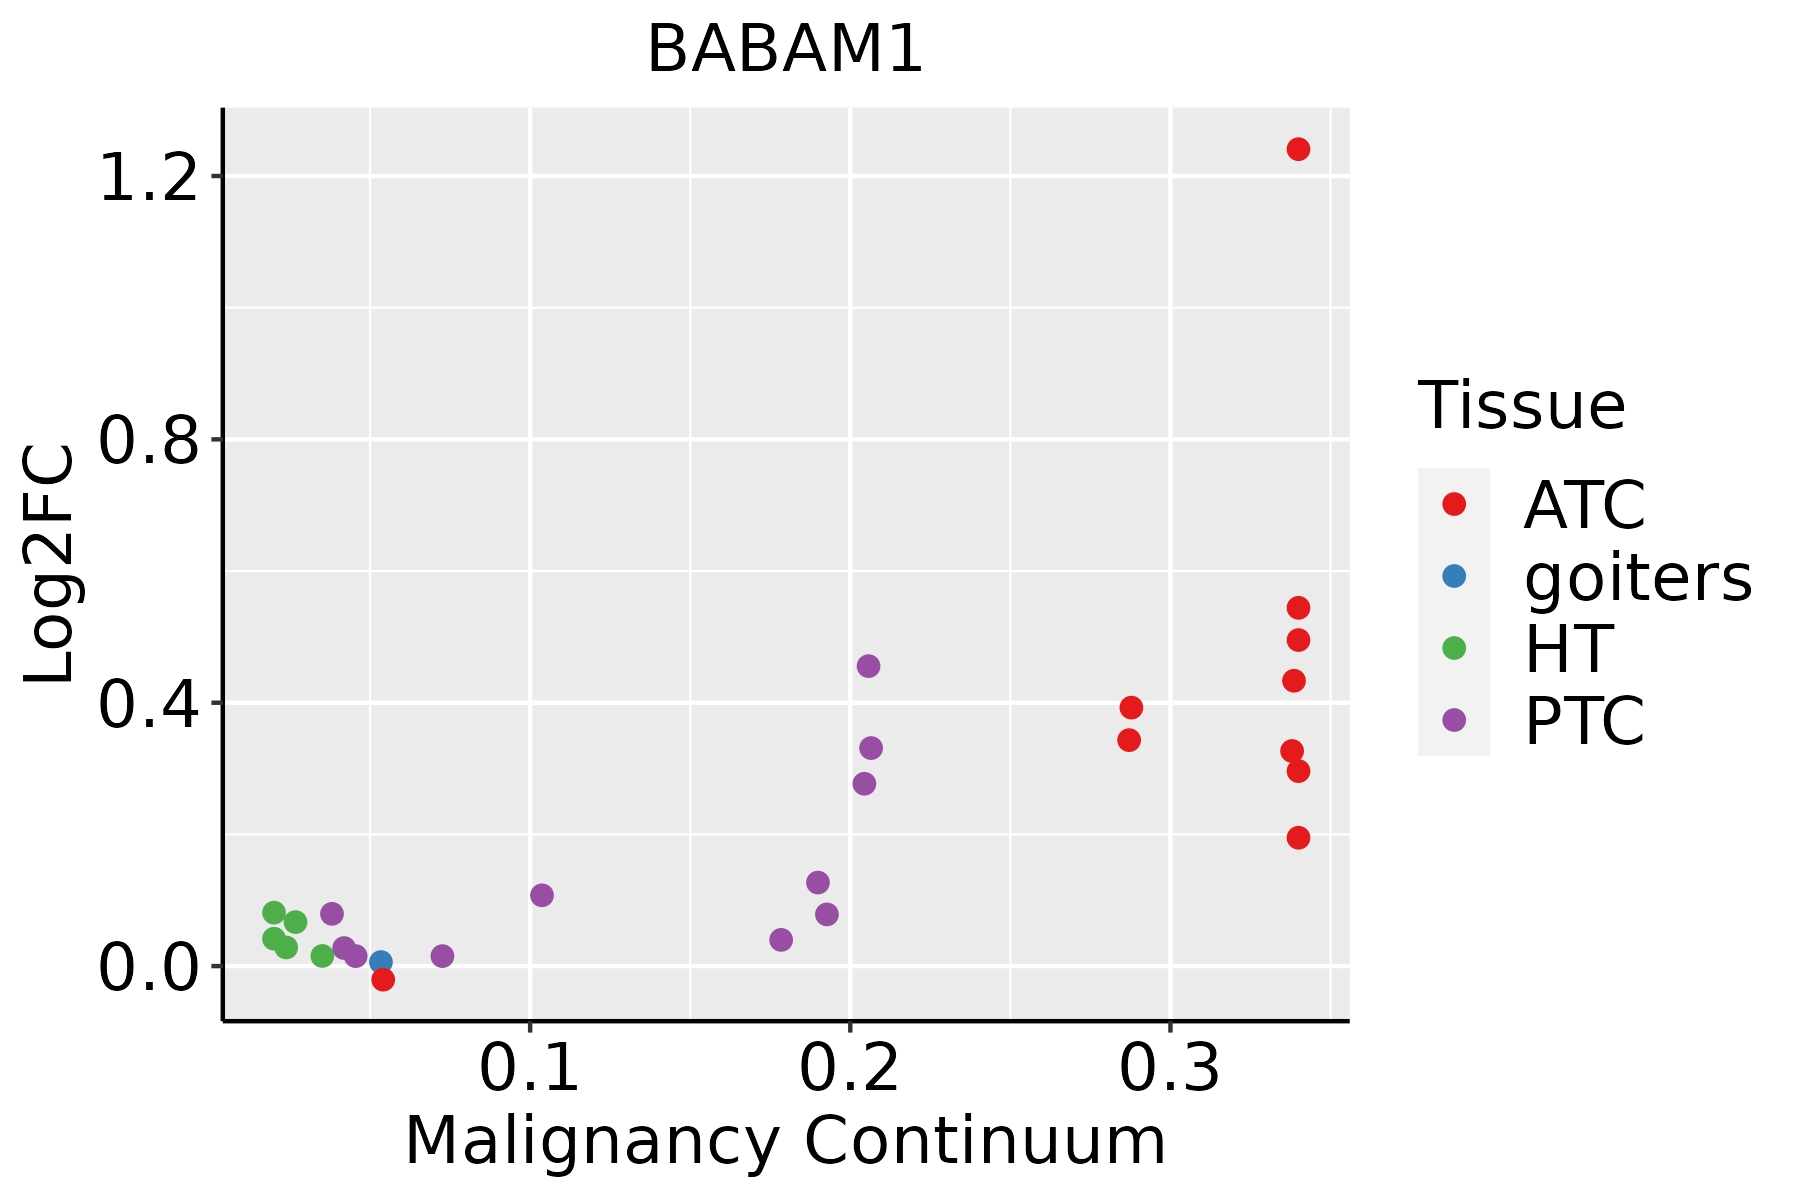 | ATC: Anaplastic thyroid cancer |
| HT: Hashimoto's thyroiditis | ||
| PTC: Papillary thyroid cancer |
| ∗log2FC in expression of this searched gene in stem-like cells from each diseased tissue sample relative to stem-like cells in normal samples in each tissue plotted against the malignancy continuum. Samples are colored based on if they are from different disease stage. |
Top |
Malignant transformation related pathway analysis |
| Find out the enriched GO biological processes and KEGG pathways involved in transition from healthy to precancer to cancer |
| Tissue | Disease Stage | Enriched GO biological Processes |
| Colorectum | AD |  |
| Colorectum | SER |  |
| Colorectum | MSS |  |
| Colorectum | MSI-H |  |
| Colorectum | FAP |  |
| ∗Top 15 enriched GO BP terms are showed in the bar plot of each disease state in each tissue. Each row represents a significant GO biological process which is colored according to the -log10(p.adjust). |
| Page: 1 2 3 4 5 6 7 8 9 |
| GO ID | Tissue | Disease Stage | Description | Gene Ratio | Bg Ratio | pvalue | p.adjust | Count |
| GO:00093148 | Breast | Precancer | response to radiation | 47/1080 | 456/18723 | 8.39e-05 | 1.62e-03 | 47 |
| GO:00102125 | Breast | Precancer | response to ionizing radiation | 21/1080 | 148/18723 | 1.19e-04 | 2.13e-03 | 21 |
| GO:00510548 | Breast | Precancer | positive regulation of DNA metabolic process | 23/1080 | 201/18723 | 1.34e-03 | 1.41e-02 | 23 |
| GO:20010208 | Breast | Precancer | regulation of response to DNA damage stimulus | 24/1080 | 219/18723 | 1.93e-03 | 1.87e-02 | 24 |
| GO:001021213 | Breast | IDC | response to ionizing radiation | 28/1434 | 148/18723 | 6.85e-06 | 2.09e-04 | 28 |
| GO:000931412 | Breast | IDC | response to radiation | 62/1434 | 456/18723 | 6.91e-06 | 2.10e-04 | 62 |
| GO:200102013 | Breast | IDC | regulation of response to DNA damage stimulus | 30/1434 | 219/18723 | 1.36e-03 | 1.40e-02 | 30 |
| GO:00073465 | Breast | IDC | regulation of mitotic cell cycle | 51/1434 | 457/18723 | 4.30e-03 | 3.35e-02 | 51 |
| GO:000931422 | Breast | DCIS | response to radiation | 62/1390 | 456/18723 | 2.56e-06 | 8.87e-05 | 62 |
| GO:001021223 | Breast | DCIS | response to ionizing radiation | 28/1390 | 148/18723 | 3.79e-06 | 1.16e-04 | 28 |
| GO:200102023 | Breast | DCIS | regulation of response to DNA damage stimulus | 30/1390 | 219/18723 | 8.32e-04 | 9.47e-03 | 30 |
| GO:000734612 | Breast | DCIS | regulation of mitotic cell cycle | 52/1390 | 457/18723 | 1.38e-03 | 1.43e-02 | 52 |
| GO:00447724 | Breast | DCIS | mitotic cell cycle phase transition | 46/1390 | 424/18723 | 6.16e-03 | 4.39e-02 | 46 |
| GO:0051052 | Colorectum | AD | regulation of DNA metabolic process | 116/3918 | 359/18723 | 2.47e-07 | 1.00e-05 | 116 |
| GO:0051054 | Colorectum | AD | positive regulation of DNA metabolic process | 73/3918 | 201/18723 | 3.27e-07 | 1.29e-05 | 73 |
| GO:2001020 | Colorectum | AD | regulation of response to DNA damage stimulus | 71/3918 | 219/18723 | 4.38e-05 | 7.65e-04 | 71 |
| GO:0006325 | Colorectum | AD | chromatin organization | 119/3918 | 409/18723 | 4.85e-05 | 8.33e-04 | 119 |
| GO:2001022 | Colorectum | AD | positive regulation of response to DNA damage stimulus | 36/3918 | 105/18723 | 1.02e-03 | 9.47e-03 | 36 |
| GO:0006282 | Colorectum | AD | regulation of DNA repair | 42/3918 | 130/18723 | 1.57e-03 | 1.32e-02 | 42 |
| GO:0007346 | Colorectum | AD | regulation of mitotic cell cycle | 119/3918 | 457/18723 | 4.60e-03 | 3.14e-02 | 119 |
| Page: 1 2 3 4 5 6 7 8 9 10 11 12 13 14 |
| Pathway ID | Tissue | Disease Stage | Description | Gene Ratio | Bg Ratio | pvalue | p.adjust | qvalue | Count |
| Page: 1 |
Top |
Cell-cell communication analysis |
| Identification of potential cell-cell interactions between two cell types and their ligand-receptor pairs for different disease states |
| Ligand | Receptor | LRpair | Pathway | Tissue | Disease Stage |
| Page: 1 |
Top |
Single-cell gene regulatory network inference analysis |
| Find out the significant the regulons (TFs) and the target genes of each regulon across cell types for different disease states |
| TF | Cell Type | Tissue | Disease Stage | Target Gene | RSS | Regulon Activity |
| ∗The dot plots of a searched regulon are shown for all cell subpopulations in each disease state of each tissue based on the regulon specific score inferred using pySCENIC and by calculating the average expression. |
| Page: 1 |
Top |
Somatic mutation of malignant transformation related genes |
| Annotation of somatic variants for genes involved in malignant transformation |
| Hugo Symbol | Variant Class | Variant Classification | dbSNP RS | HGVSc | HGVSp | HGVSp Short | SWISSPROT | BIOTYPE | SIFT | PolyPhen | Tumor Sample Barcode | Tissue | Histology | Sex | Age | Stage | Therapy Types | Drugs | Outcome |
| BABAM1 | SNV | Missense_Mutation | novel | c.530N>T | p.Ser177Phe | p.S177F | Q9NWV8 | protein_coding | tolerated(0.05) | benign(0.221) | TCGA-2W-A8YY-01 | Cervix | cervical & endocervical cancer | Female | <65 | I/II | Chemotherapy | cisplatin | CR |
| BABAM1 | SNV | Missense_Mutation | novel | c.554N>C | p.Gly185Ala | p.G185A | Q9NWV8 | protein_coding | tolerated(0.2) | benign(0.015) | TCGA-A6-3808-01 | Colorectum | colon adenocarcinoma | Male | >=65 | I/II | Unknown | Unknown | SD |
| BABAM1 | SNV | Missense_Mutation | c.491N>A | p.Arg164His | p.R164H | Q9NWV8 | protein_coding | deleterious(0.04) | probably_damaging(0.954) | TCGA-CM-4752-01 | Colorectum | colon adenocarcinoma | Male | <65 | I/II | Unknown | Unknown | SD | |
| BABAM1 | SNV | Missense_Mutation | rs375274426 | c.655N>T | p.Arg219Cys | p.R219C | Q9NWV8 | protein_coding | deleterious(0) | probably_damaging(1) | TCGA-DM-A0XD-01 | Colorectum | colon adenocarcinoma | Male | >=65 | I/II | Unknown | Unknown | PD |
| BABAM1 | SNV | Missense_Mutation | c.59N>T | p.Ser20Leu | p.S20L | Q9NWV8 | protein_coding | tolerated_low_confidence(0.48) | benign(0) | TCGA-F4-6808-01 | Colorectum | colon adenocarcinoma | Female | <65 | I/II | Unknown | Unknown | SD | |
| BABAM1 | SNV | Missense_Mutation | rs758526214 | c.77G>A | p.Arg26His | p.R26H | Q9NWV8 | protein_coding | tolerated_low_confidence(0.1) | benign(0.001) | TCGA-A5-A0G1-01 | Endometrium | uterine corpus endometrioid carcinoma | Female | >=65 | I/II | Unknown | Unknown | SD |
| BABAM1 | SNV | Missense_Mutation | rs765161255 | c.524C>T | p.Thr175Met | p.T175M | Q9NWV8 | protein_coding | deleterious(0.01) | probably_damaging(0.999) | TCGA-A5-A0G2-01 | Endometrium | uterine corpus endometrioid carcinoma | Female | <65 | III/IV | Unknown | Unknown | SD |
| BABAM1 | SNV | Missense_Mutation | c.526N>A | p.Ala176Thr | p.A176T | Q9NWV8 | protein_coding | tolerated(0.55) | benign(0.234) | TCGA-AX-A0J1-01 | Endometrium | uterine corpus endometrioid carcinoma | Female | >=65 | I/II | Unknown | Unknown | SD | |
| BABAM1 | SNV | Missense_Mutation | novel | c.400N>G | p.Thr134Ala | p.T134A | Q9NWV8 | protein_coding | tolerated(0.17) | possibly_damaging(0.731) | TCGA-AX-A2HJ-01 | Endometrium | uterine corpus endometrioid carcinoma | Female | <65 | I/II | Unknown | Unknown | SD |
| BABAM1 | SNV | Missense_Mutation | novel | c.850C>A | p.Leu284Met | p.L284M | Q9NWV8 | protein_coding | tolerated(0.15) | benign(0.073) | TCGA-B5-A3FA-01 | Endometrium | uterine corpus endometrioid carcinoma | Female | >=65 | I/II | Unknown | Unknown | SD |
| Page: 1 2 |
Top |
Related drugs of malignant transformation related genes |
| Identification of chemicals and drugs interact with genes involved in malignant transfromation |
| (DGIdb 4.0) |
| Entrez ID | Symbol | Category | Interaction Types | Drug Claim Name | Drug Name | PMIDs |
| Page: 1 |

Copyright 2023-Present -The University of Texas Health Science Center at Houston |