
|
|||||
|
 | |
| |
| |
| |
| |
| |
|
Gene: BAAT |
Gene summary for BAAT |
| Gene information | Species | Human | Gene symbol | BAAT | Gene ID | 570 |
| Gene name | bile acid-CoA:amino acid N-acyltransferase | |
| Gene Alias | BACAT | |
| Cytomap | 9q31.1 | |
| Gene Type | protein-coding | GO ID | GO:0001889 | UniProtAcc | Q14032 |
Top |
Malignant transformation analysis |
| Identification of the aberrant gene expression in precancerous and cancerous lesions by comparing the gene expression of stem-like cells in diseased tissues with normal stem cells |
| Entrez ID | Symbol | Replicates | Species | Organ | Tissue | Adj P-value | Log2FC | Malignancy |
| 570 | BAAT | NAFLD1 | Human | Liver | NAFLD | 9.23e-19 | 1.51e+00 | -0.04 |
| 570 | BAAT | S41 | Human | Liver | Cirrhotic | 1.39e-07 | 7.91e-01 | -0.0343 |
| 570 | BAAT | S43 | Human | Liver | Cirrhotic | 2.35e-06 | -8.81e-03 | -0.0187 |
| 570 | BAAT | S44 | Human | Liver | HCC | 1.78e-02 | 4.27e-01 | -0.0083 |
| 570 | BAAT | HCC1_Meng | Human | Liver | HCC | 6.90e-48 | -3.39e-01 | 0.0246 |
| 570 | BAAT | HCC2_Meng | Human | Liver | HCC | 8.77e-14 | -4.63e-01 | 0.0107 |
| 570 | BAAT | cirrhotic1 | Human | Liver | Cirrhotic | 1.45e-13 | -1.02e-01 | 0.0202 |
| 570 | BAAT | cirrhotic2 | Human | Liver | Cirrhotic | 2.02e-12 | -1.51e-02 | 0.0201 |
| 570 | BAAT | cirrhotic3 | Human | Liver | Cirrhotic | 8.62e-03 | -1.90e-01 | 0.0215 |
| 570 | BAAT | HCC1 | Human | Liver | HCC | 2.56e-12 | 4.19e+00 | 0.5336 |
| 570 | BAAT | HCC2 | Human | Liver | HCC | 3.61e-34 | 5.53e+00 | 0.5341 |
| 570 | BAAT | Pt13.a | Human | Liver | HCC | 3.51e-07 | 1.38e-01 | 0.021 |
| 570 | BAAT | Pt13.b | Human | Liver | HCC | 9.61e-17 | 2.77e-01 | 0.0251 |
| 570 | BAAT | Pt14.b | Human | Liver | HCC | 5.02e-09 | 3.04e-01 | 0.018 |
| 570 | BAAT | Pt14.d | Human | Liver | HCC | 1.02e-02 | -7.43e-02 | 0.0143 |
| 570 | BAAT | S027 | Human | Liver | HCC | 2.00e-08 | 1.52e+00 | 0.2446 |
| 570 | BAAT | S028 | Human | Liver | HCC | 3.19e-27 | 1.63e+00 | 0.2503 |
| 570 | BAAT | S029 | Human | Liver | HCC | 2.15e-21 | 1.83e+00 | 0.2581 |
| Page: 1 |
| Tissue | Expression Dynamics | Abbreviation |
| Liver | 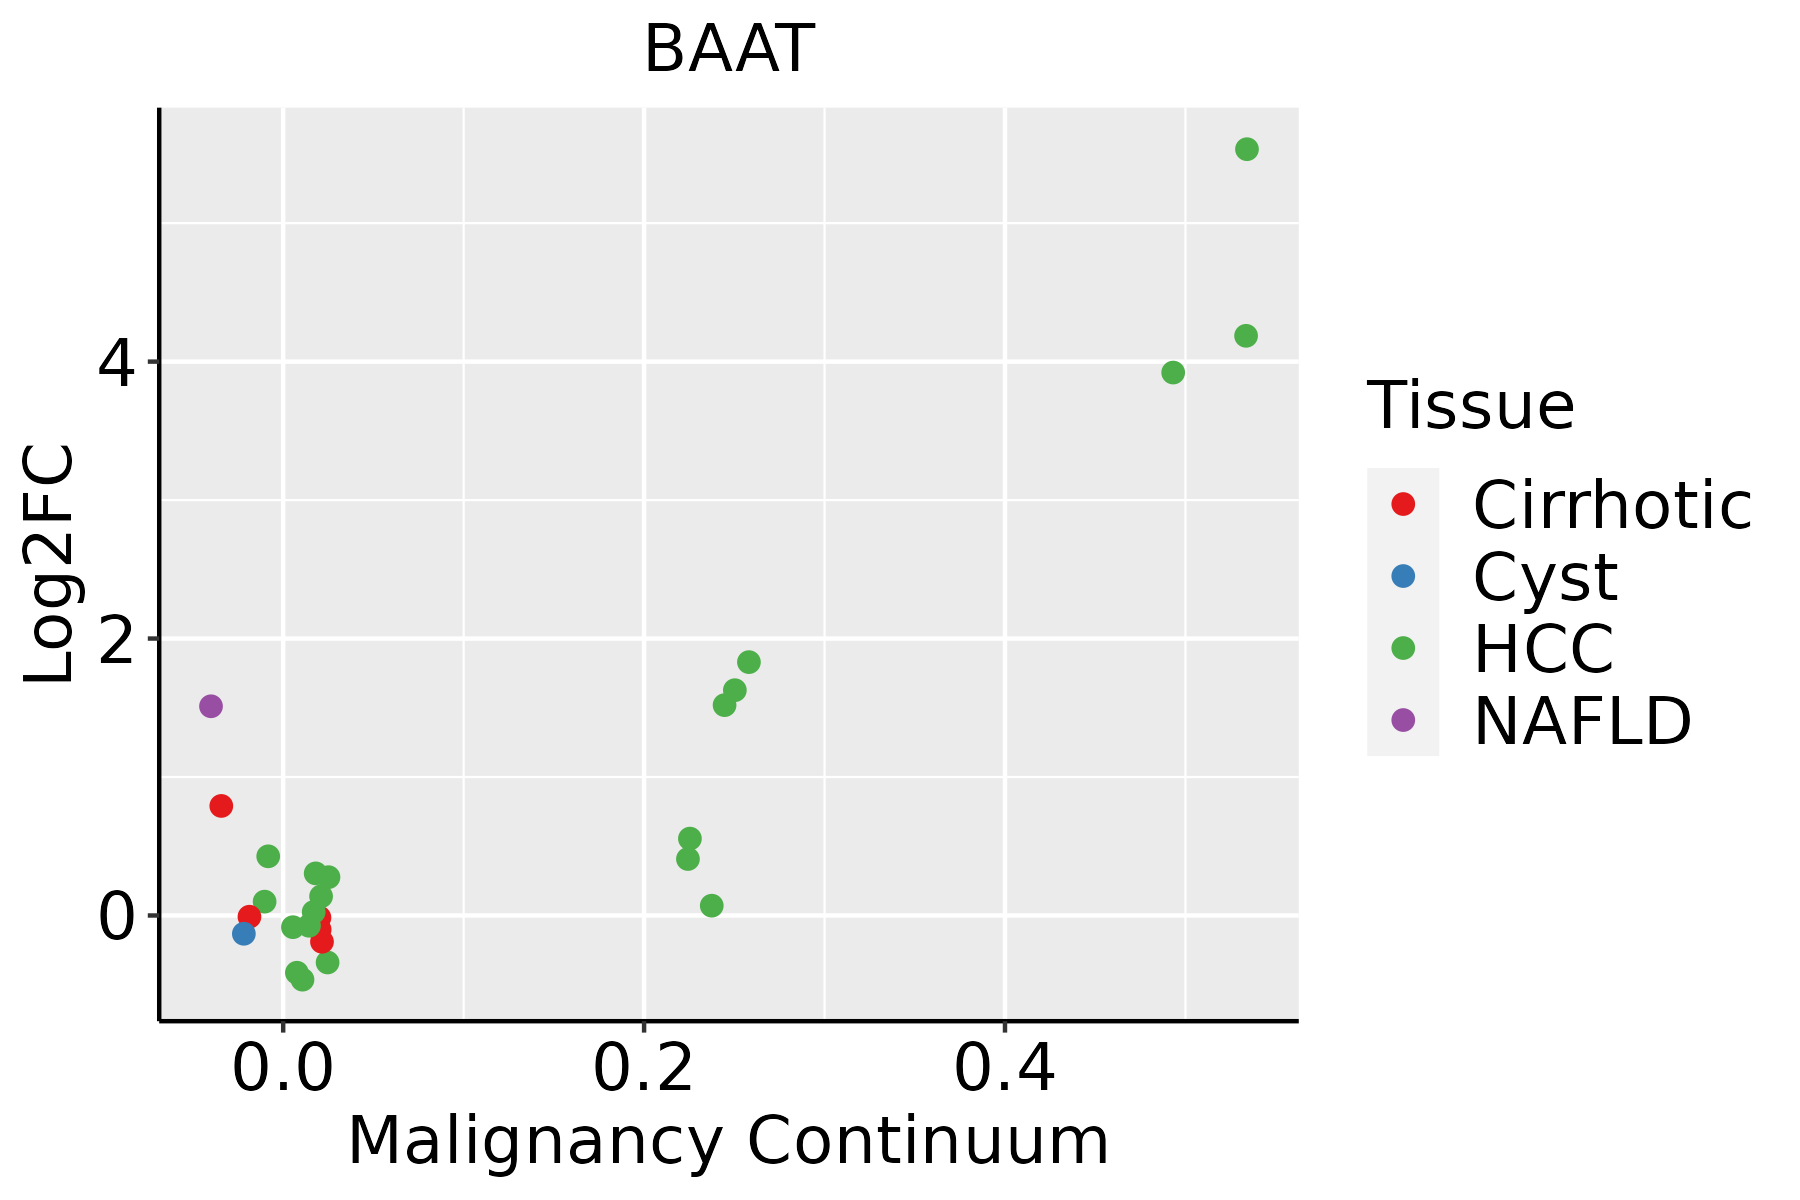 | HCC: Hepatocellular carcinoma |
| NAFLD: Non-alcoholic fatty liver disease |
| ∗log2FC in expression of this searched gene in stem-like cells from each diseased tissue sample relative to stem-like cells in normal samples in each tissue plotted against the malignancy continuum. Samples are colored based on if they are from different disease stage. |
Top |
Malignant transformation related pathway analysis |
| Find out the enriched GO biological processes and KEGG pathways involved in transition from healthy to precancer to cancer |
| Tissue | Disease Stage | Enriched GO biological Processes |
| Colorectum | AD |  |
| Colorectum | SER |  |
| Colorectum | MSS |  |
| Colorectum | MSI-H |  |
| Colorectum | FAP |  |
| ∗Top 15 enriched GO BP terms are showed in the bar plot of each disease state in each tissue. Each row represents a significant GO biological process which is colored according to the -log10(p.adjust). |
| Page: 1 2 3 4 5 6 7 8 9 |
| GO ID | Tissue | Disease Stage | Description | Gene Ratio | Bg Ratio | pvalue | p.adjust | Count |
| GO:00066316 | Liver | NAFLD | fatty acid metabolic process | 92/1882 | 390/18723 | 3.38e-15 | 3.29e-12 | 92 |
| GO:00160535 | Liver | NAFLD | organic acid biosynthetic process | 77/1882 | 316/18723 | 1.03e-13 | 6.69e-11 | 77 |
| GO:00463945 | Liver | NAFLD | carboxylic acid biosynthetic process | 75/1882 | 314/18723 | 6.37e-13 | 3.39e-10 | 75 |
| GO:00082023 | Liver | NAFLD | steroid metabolic process | 69/1882 | 319/18723 | 5.90e-10 | 1.28e-07 | 69 |
| GO:00065203 | Liver | NAFLD | cellular amino acid metabolic process | 63/1882 | 284/18723 | 1.14e-09 | 2.17e-07 | 63 |
| GO:19016053 | Liver | NAFLD | alpha-amino acid metabolic process | 46/1882 | 195/18723 | 2.74e-08 | 2.86e-06 | 46 |
| GO:00610087 | Liver | NAFLD | hepaticobiliary system development | 38/1882 | 150/18723 | 5.94e-08 | 5.42e-06 | 38 |
| GO:0008206 | Liver | NAFLD | bile acid metabolic process | 19/1882 | 49/18723 | 9.82e-08 | 7.76e-06 | 19 |
| GO:00018897 | Liver | NAFLD | liver development | 37/1882 | 147/18723 | 1.06e-07 | 8.12e-06 | 37 |
| GO:00092596 | Liver | NAFLD | ribonucleotide metabolic process | 72/1882 | 385/18723 | 1.51e-07 | 1.09e-05 | 72 |
| GO:00196936 | Liver | NAFLD | ribose phosphate metabolic process | 73/1882 | 396/18723 | 2.23e-07 | 1.53e-05 | 73 |
| GO:00091177 | Liver | NAFLD | nucleotide metabolic process | 85/1882 | 489/18723 | 3.31e-07 | 2.18e-05 | 85 |
| GO:00723303 | Liver | NAFLD | monocarboxylic acid biosynthetic process | 46/1882 | 214/18723 | 5.06e-07 | 3.07e-05 | 46 |
| GO:00067537 | Liver | NAFLD | nucleoside phosphate metabolic process | 85/1882 | 497/18723 | 6.69e-07 | 3.83e-05 | 85 |
| GO:00725217 | Liver | NAFLD | purine-containing compound metabolic process | 74/1882 | 416/18723 | 7.73e-07 | 4.27e-05 | 74 |
| GO:00091507 | Liver | NAFLD | purine ribonucleotide metabolic process | 67/1882 | 368/18723 | 1.10e-06 | 5.44e-05 | 67 |
| GO:00061637 | Liver | NAFLD | purine nucleotide metabolic process | 70/1882 | 396/18723 | 1.93e-06 | 8.23e-05 | 70 |
| GO:0006699 | Liver | NAFLD | bile acid biosynthetic process | 14/1882 | 36/18723 | 4.59e-06 | 1.75e-04 | 14 |
| GO:00067904 | Liver | NAFLD | sulfur compound metabolic process | 58/1882 | 339/18723 | 3.79e-05 | 9.38e-04 | 58 |
| GO:00311003 | Liver | NAFLD | animal organ regeneration | 20/1882 | 76/18723 | 4.33e-05 | 1.06e-03 | 20 |
| Page: 1 2 3 4 5 |
| Pathway ID | Tissue | Disease Stage | Description | Gene Ratio | Bg Ratio | pvalue | p.adjust | qvalue | Count |
| hsa00120 | Liver | NAFLD | Primary bile acid biosynthesis | 9/1043 | 17/8465 | 6.10e-05 | 1.33e-03 | 1.07e-03 | 9 |
| hsa04146 | Liver | NAFLD | Peroxisome | 19/1043 | 82/8465 | 4.37e-03 | 4.10e-02 | 3.30e-02 | 19 |
| hsa049762 | Liver | NAFLD | Bile secretion | 20/1043 | 89/8465 | 5.08e-03 | 4.43e-02 | 3.57e-02 | 20 |
| hsa001201 | Liver | NAFLD | Primary bile acid biosynthesis | 9/1043 | 17/8465 | 6.10e-05 | 1.33e-03 | 1.07e-03 | 9 |
| hsa041461 | Liver | NAFLD | Peroxisome | 19/1043 | 82/8465 | 4.37e-03 | 4.10e-02 | 3.30e-02 | 19 |
| hsa0497611 | Liver | NAFLD | Bile secretion | 20/1043 | 89/8465 | 5.08e-03 | 4.43e-02 | 3.57e-02 | 20 |
| hsa041462 | Liver | Cirrhotic | Peroxisome | 36/2530 | 82/8465 | 4.79e-03 | 1.74e-02 | 1.07e-02 | 36 |
| hsa041463 | Liver | Cirrhotic | Peroxisome | 36/2530 | 82/8465 | 4.79e-03 | 1.74e-02 | 1.07e-02 | 36 |
| hsa041464 | Liver | HCC | Peroxisome | 58/4020 | 82/8465 | 1.57e-05 | 1.05e-04 | 5.85e-05 | 58 |
| hsa010402 | Liver | HCC | Biosynthesis of unsaturated fatty acids | 19/4020 | 27/8465 | 1.37e-02 | 3.33e-02 | 1.85e-02 | 19 |
| hsa041465 | Liver | HCC | Peroxisome | 58/4020 | 82/8465 | 1.57e-05 | 1.05e-04 | 5.85e-05 | 58 |
| hsa010403 | Liver | HCC | Biosynthesis of unsaturated fatty acids | 19/4020 | 27/8465 | 1.37e-02 | 3.33e-02 | 1.85e-02 | 19 |
| Page: 1 |
Top |
Cell-cell communication analysis |
| Identification of potential cell-cell interactions between two cell types and their ligand-receptor pairs for different disease states |
| Ligand | Receptor | LRpair | Pathway | Tissue | Disease Stage |
| Page: 1 |
Top |
Single-cell gene regulatory network inference analysis |
| Find out the significant the regulons (TFs) and the target genes of each regulon across cell types for different disease states |
| TF | Cell Type | Tissue | Disease Stage | Target Gene | RSS | Regulon Activity |
| ∗The dot plots of a searched regulon are shown for all cell subpopulations in each disease state of each tissue based on the regulon specific score inferred using pySCENIC and by calculating the average expression. |
| Page: 1 |
Top |
Somatic mutation of malignant transformation related genes |
| Annotation of somatic variants for genes involved in malignant transformation |
| Hugo Symbol | Variant Class | Variant Classification | dbSNP RS | HGVSc | HGVSp | HGVSp Short | SWISSPROT | BIOTYPE | SIFT | PolyPhen | Tumor Sample Barcode | Tissue | Histology | Sex | Age | Stage | Therapy Types | Drugs | Outcome |
| BAAT | SNV | Missense_Mutation | rs745550591 | c.43N>A | p.Glu15Lys | p.E15K | Q14032 | protein_coding | deleterious(0.01) | possibly_damaging(0.883) | TCGA-A8-A09G-01 | Breast | breast invasive carcinoma | Female | >=65 | III/IV | Unknown | Unknown | SD |
| BAAT | SNV | Missense_Mutation | novel | c.1211N>T | p.Arg404Ile | p.R404I | Q14032 | protein_coding | tolerated(0.06) | possibly_damaging(0.447) | TCGA-AN-A046-01 | Breast | breast invasive carcinoma | Female | >=65 | I/II | Unknown | Unknown | SD |
| BAAT | SNV | Missense_Mutation | novel | c.920N>A | p.Ser307Asn | p.S307N | Q14032 | protein_coding | tolerated(0.62) | benign(0.007) | TCGA-AR-A0U0-01 | Breast | breast invasive carcinoma | Female | >=65 | I/II | Unknown | Unknown | SD |
| BAAT | SNV | Missense_Mutation | c.286N>A | p.Val96Met | p.V96M | Q14032 | protein_coding | deleterious(0.01) | probably_damaging(1) | TCGA-BH-A0HF-01 | Breast | breast invasive carcinoma | Female | >=65 | I/II | Hormone Therapy | arimidex | SD | |
| BAAT | insertion | Frame_Shift_Ins | novel | c.902_903insTAAGAAG | p.Thr302LysfsTer15 | p.T302Kfs*15 | Q14032 | protein_coding | TCGA-A2-A04V-01 | Breast | breast invasive carcinoma | Female | <65 | I/II | Chemotherapy | cytoxan | PD | ||
| BAAT | insertion | Nonsense_Mutation | novel | c.921_922insTAATA | p.Gln308Ter | p.Q308* | Q14032 | protein_coding | TCGA-AR-A0U0-01 | Breast | breast invasive carcinoma | Female | >=65 | I/II | Unknown | Unknown | SD | ||
| BAAT | SNV | Missense_Mutation | c.169G>C | p.Glu57Gln | p.E57Q | Q14032 | protein_coding | tolerated(0.1) | probably_damaging(0.96) | TCGA-C5-A2LX-01 | Cervix | cervical & endocervical cancer | Female | <65 | I/II | Chemotherapy | cisplatin | SD | |
| BAAT | SNV | Missense_Mutation | c.12N>C | p.Leu4Phe | p.L4F | Q14032 | protein_coding | deleterious(0.01) | probably_damaging(0.937) | TCGA-EK-A2RC-01 | Cervix | cervical & endocervical cancer | Female | <65 | I/II | Unknown | Unknown | SD | |
| BAAT | SNV | Missense_Mutation | c.1140N>C | p.Leu380Phe | p.L380F | Q14032 | protein_coding | tolerated(0.13) | benign(0.015) | TCGA-IR-A3LL-01 | Cervix | cervical & endocervical cancer | Female | <65 | I/II | Chemotherapy | cisplatin | CR | |
| BAAT | SNV | Missense_Mutation | novel | c.276G>C | p.Leu92Phe | p.L92F | Q14032 | protein_coding | deleterious(0.02) | benign(0.086) | TCGA-VS-A9V5-01 | Cervix | cervical & endocervical cancer | Female | <65 | I/II | Chemotherapy | carboplatin | PD |
| Page: 1 2 3 4 5 6 7 |
Top |
Related drugs of malignant transformation related genes |
| Identification of chemicals and drugs interact with genes involved in malignant transfromation |
| (DGIdb 4.0) |
| Entrez ID | Symbol | Category | Interaction Types | Drug Claim Name | Drug Name | PMIDs |
| Page: 1 |

Copyright 2023-Present -The University of Texas Health Science Center at Houston |