
|
|||||
|
 | |
| |
| |
| |
| |
| |
|
Gene: BAALC |
Gene summary for BAALC |
| Gene information | Species | Human | Gene symbol | BAALC | Gene ID | 79870 |
| Gene name | BAALC binder of MAP3K1 and KLF4 | |
| Gene Alias | BAALC | |
| Cytomap | 8q22.3 | |
| Gene Type | protein-coding | GO ID | GO:0005575 | UniProtAcc | Q8WXS3 |
Top |
Malignant transformation analysis |
| Identification of the aberrant gene expression in precancerous and cancerous lesions by comparing the gene expression of stem-like cells in diseased tissues with normal stem cells |
| Entrez ID | Symbol | Replicates | Species | Organ | Tissue | Adj P-value | Log2FC | Malignancy |
| 79870 | BAALC | LZE5T | Human | Esophagus | ESCC | 1.54e-04 | 3.08e-01 | 0.0514 |
| 79870 | BAALC | LZE24T | Human | Esophagus | ESCC | 8.26e-28 | 9.02e-01 | 0.0596 |
| 79870 | BAALC | LZE21T | Human | Esophagus | ESCC | 1.37e-06 | 4.08e-01 | 0.0655 |
| 79870 | BAALC | P4T-E | Human | Esophagus | ESCC | 1.36e-04 | 2.16e-01 | 0.1323 |
| 79870 | BAALC | P8T-E | Human | Esophagus | ESCC | 5.57e-40 | 8.18e-01 | 0.0889 |
| 79870 | BAALC | P9T-E | Human | Esophagus | ESCC | 5.22e-18 | 5.47e-01 | 0.1131 |
| 79870 | BAALC | P10T-E | Human | Esophagus | ESCC | 5.57e-40 | 8.85e-01 | 0.116 |
| 79870 | BAALC | P12T-E | Human | Esophagus | ESCC | 4.17e-05 | 1.56e-01 | 0.1122 |
| 79870 | BAALC | P16T-E | Human | Esophagus | ESCC | 3.75e-03 | 1.13e-01 | 0.1153 |
| 79870 | BAALC | P19T-E | Human | Esophagus | ESCC | 5.57e-05 | 4.05e-01 | 0.1662 |
| 79870 | BAALC | P22T-E | Human | Esophagus | ESCC | 6.56e-15 | 3.54e-01 | 0.1236 |
| 79870 | BAALC | P26T-E | Human | Esophagus | ESCC | 3.41e-36 | 9.39e-01 | 0.1276 |
| 79870 | BAALC | P28T-E | Human | Esophagus | ESCC | 3.97e-04 | 1.90e-01 | 0.1149 |
| 79870 | BAALC | P30T-E | Human | Esophagus | ESCC | 4.44e-04 | 3.80e-01 | 0.137 |
| 79870 | BAALC | P31T-E | Human | Esophagus | ESCC | 8.96e-45 | 1.33e+00 | 0.1251 |
| 79870 | BAALC | P32T-E | Human | Esophagus | ESCC | 4.31e-06 | 2.47e-01 | 0.1666 |
| 79870 | BAALC | P36T-E | Human | Esophagus | ESCC | 3.71e-09 | 4.81e-01 | 0.1187 |
| 79870 | BAALC | P37T-E | Human | Esophagus | ESCC | 4.28e-02 | 1.08e-01 | 0.1371 |
| 79870 | BAALC | P39T-E | Human | Esophagus | ESCC | 7.31e-14 | 4.08e-01 | 0.0894 |
| 79870 | BAALC | P42T-E | Human | Esophagus | ESCC | 5.83e-09 | 4.97e-01 | 0.1175 |
| Page: 1 2 |
| Tissue | Expression Dynamics | Abbreviation |
| Esophagus | 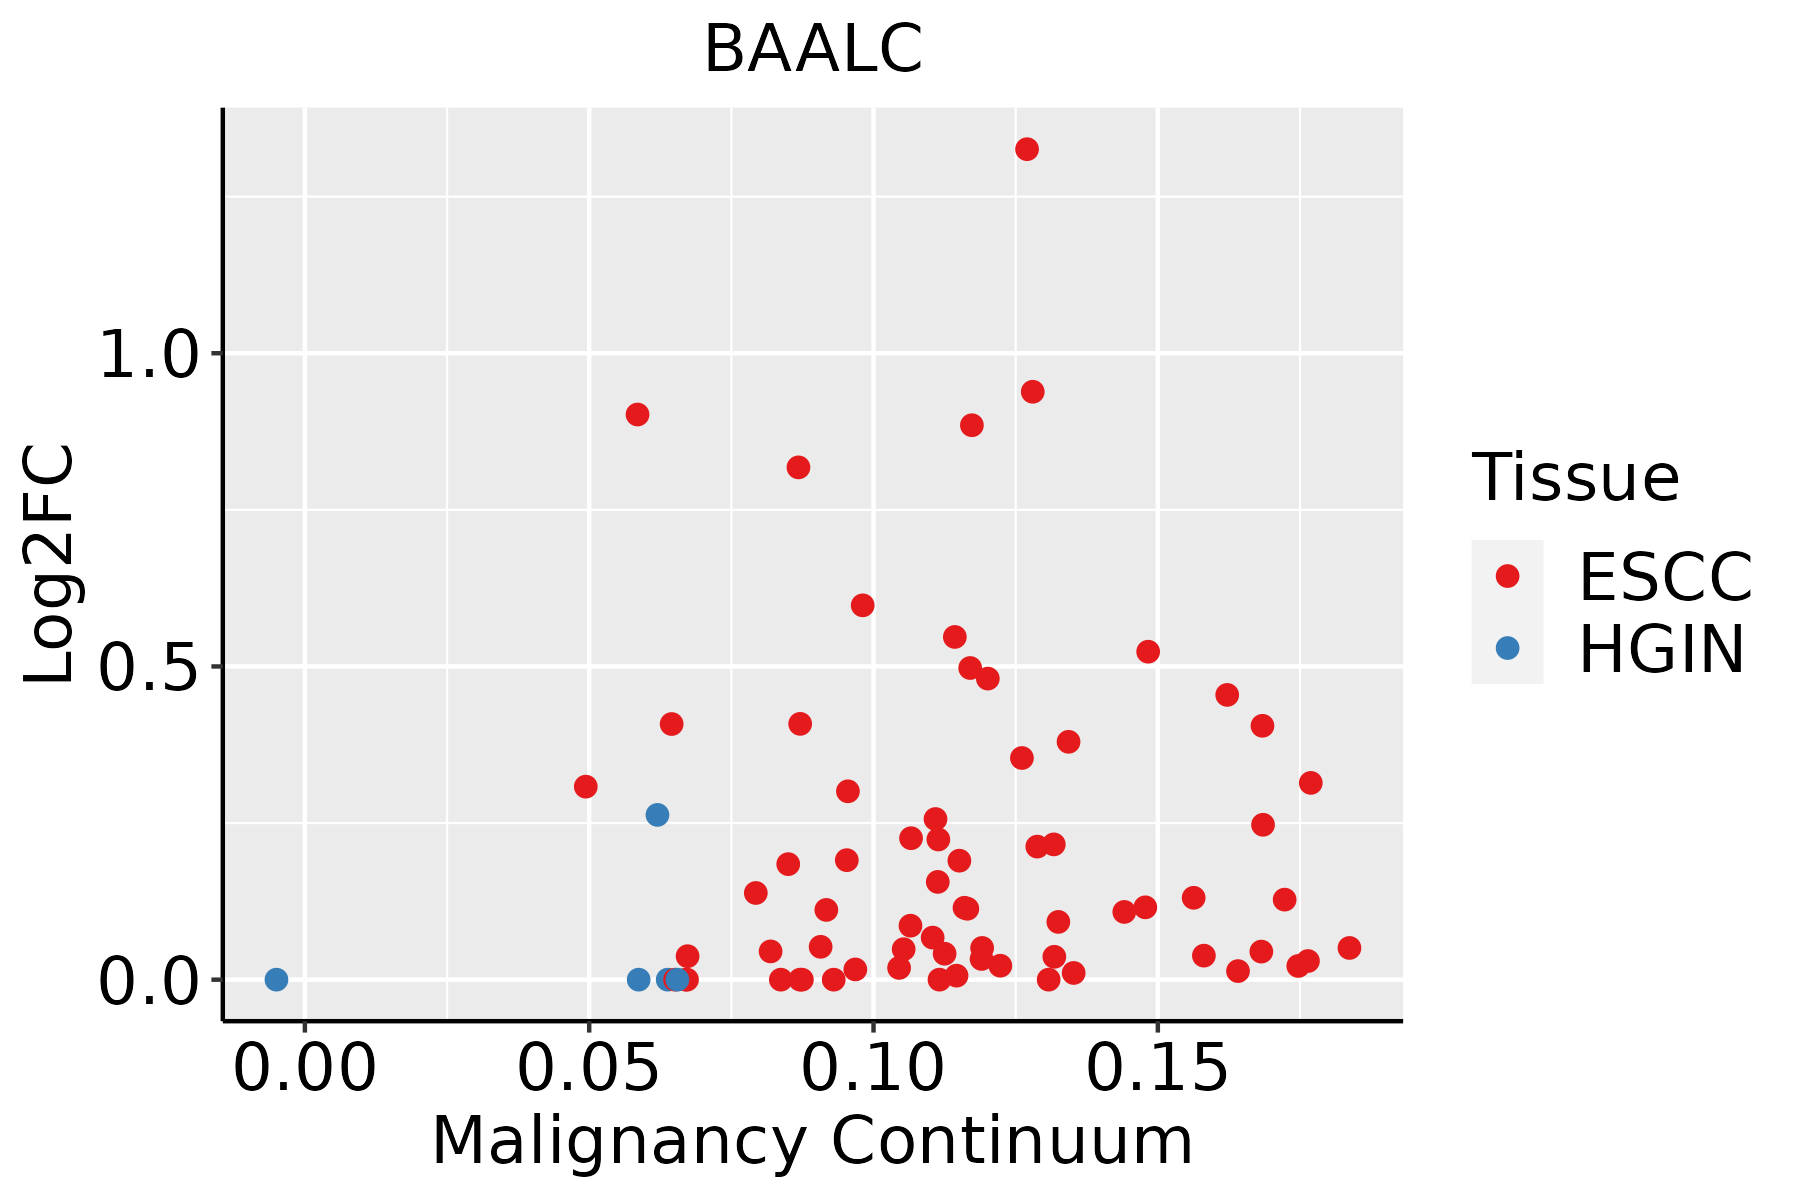 | ESCC: Esophageal squamous cell carcinoma |
| HGIN: High-grade intraepithelial neoplasias | ||
| LGIN: Low-grade intraepithelial neoplasias | ||
| Oral Cavity | 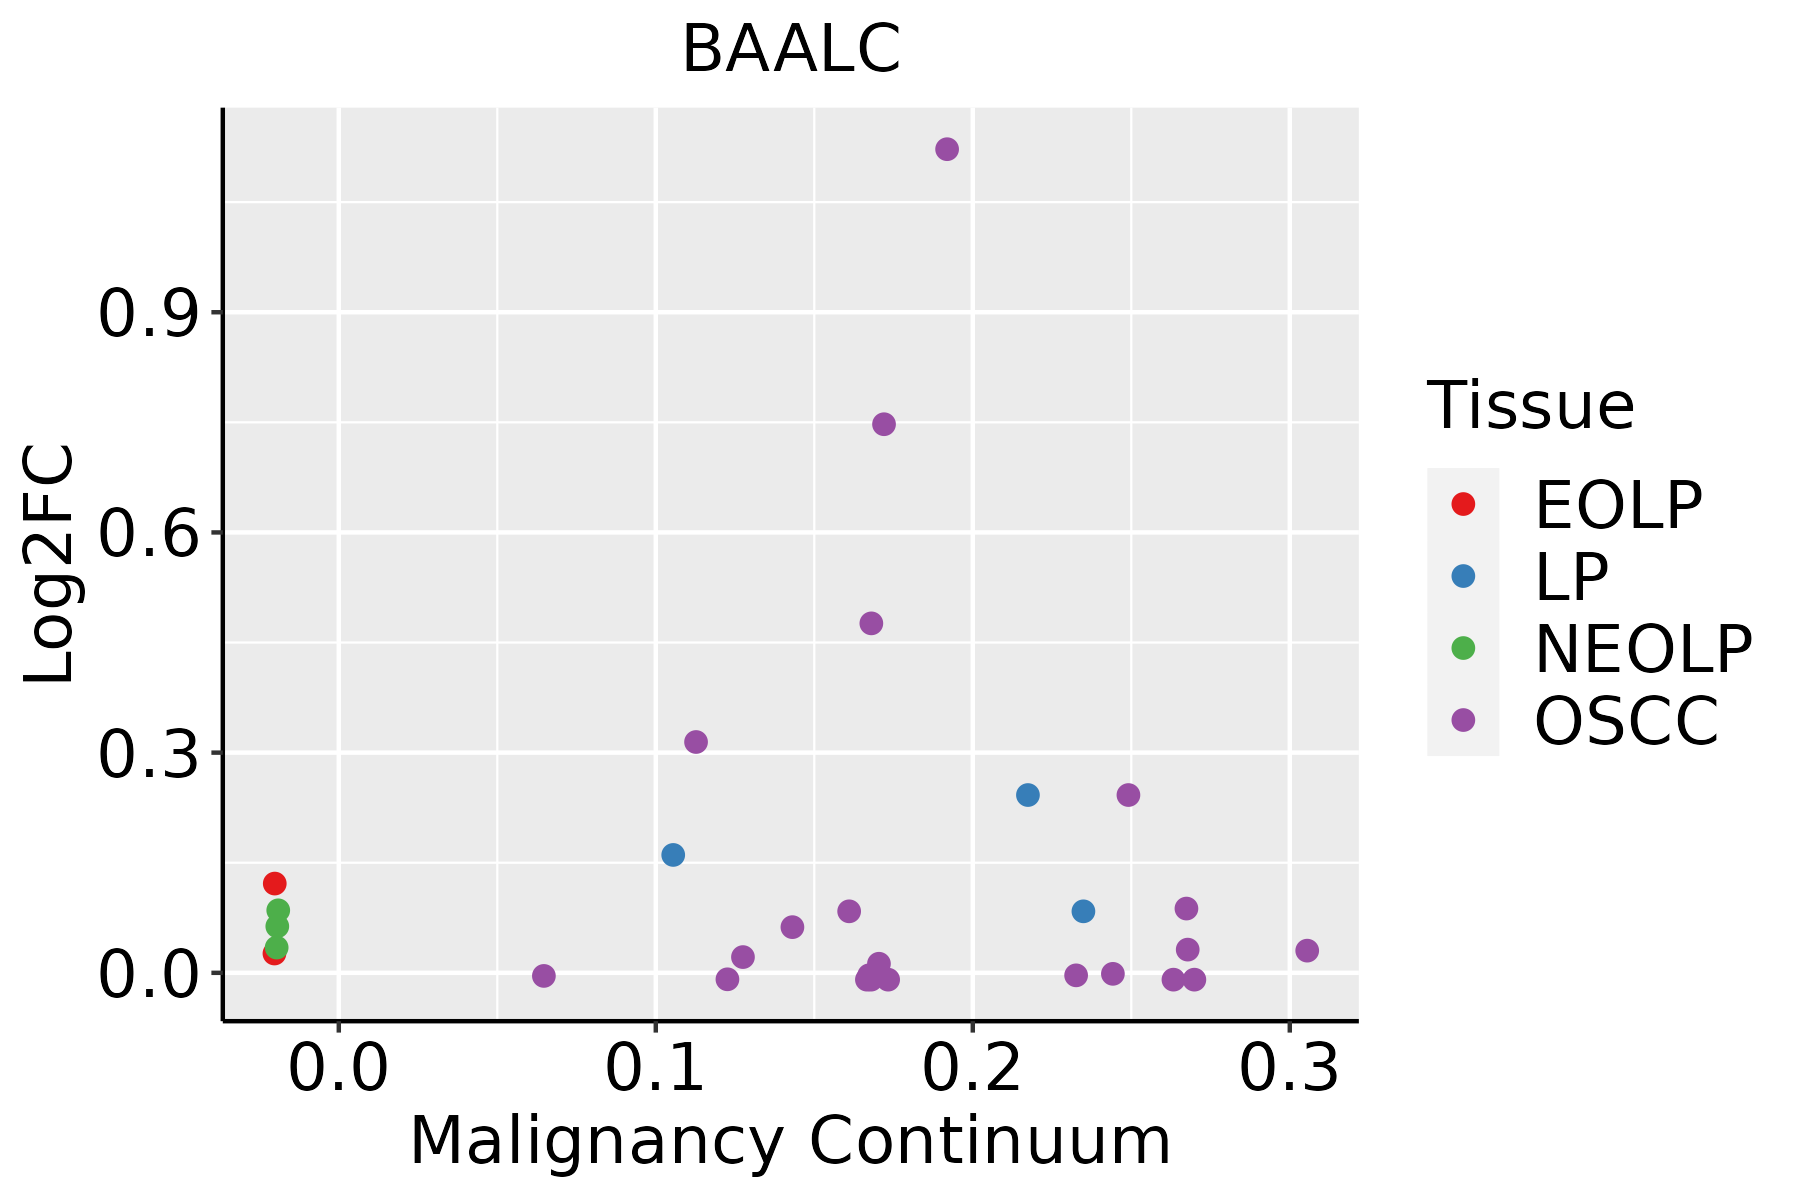 | EOLP: Erosive Oral lichen planus |
| LP: leukoplakia | ||
| NEOLP: Non-erosive oral lichen planus | ||
| OSCC: Oral squamous cell carcinoma |
| ∗log2FC in expression of this searched gene in stem-like cells from each diseased tissue sample relative to stem-like cells in normal samples in each tissue plotted against the malignancy continuum. Samples are colored based on if they are from different disease stage. |
Top |
Malignant transformation related pathway analysis |
| Find out the enriched GO biological processes and KEGG pathways involved in transition from healthy to precancer to cancer |
| Tissue | Disease Stage | Enriched GO biological Processes |
| Colorectum | AD |  |
| Colorectum | SER |  |
| Colorectum | MSS |  |
| Colorectum | MSI-H |  |
| Colorectum | FAP |  |
| ∗Top 15 enriched GO BP terms are showed in the bar plot of each disease state in each tissue. Each row represents a significant GO biological process which is colored according to the -log10(p.adjust). |
| Page: 1 2 3 4 5 6 7 8 9 |
| GO ID | Tissue | Disease Stage | Description | Gene Ratio | Bg Ratio | pvalue | p.adjust | Count |
| Page: 1 |
| Pathway ID | Tissue | Disease Stage | Description | Gene Ratio | Bg Ratio | pvalue | p.adjust | qvalue | Count |
| Page: 1 |
Top |
Cell-cell communication analysis |
| Identification of potential cell-cell interactions between two cell types and their ligand-receptor pairs for different disease states |
| Ligand | Receptor | LRpair | Pathway | Tissue | Disease Stage |
| Page: 1 |
Top |
Single-cell gene regulatory network inference analysis |
| Find out the significant the regulons (TFs) and the target genes of each regulon across cell types for different disease states |
| TF | Cell Type | Tissue | Disease Stage | Target Gene | RSS | Regulon Activity |
| ∗The dot plots of a searched regulon are shown for all cell subpopulations in each disease state of each tissue based on the regulon specific score inferred using pySCENIC and by calculating the average expression. |
| Page: 1 |
Top |
Somatic mutation of malignant transformation related genes |
| Annotation of somatic variants for genes involved in malignant transformation |
| Hugo Symbol | Variant Class | Variant Classification | dbSNP RS | HGVSc | HGVSp | HGVSp Short | SWISSPROT | BIOTYPE | SIFT | PolyPhen | Tumor Sample Barcode | Tissue | Histology | Sex | Age | Stage | Therapy Types | Drugs | Outcome |
| BAALC | SNV | Missense_Mutation | novel | c.223C>T | p.Pro75Ser | p.P75S | Q8WXS3 | protein_coding | tolerated(1) | benign(0) | TCGA-D8-A4Z1-01 | Breast | breast invasive carcinoma | Female | >=65 | I/II | Hormone Therapy | tamoxiphen | SD |
| BAALC | insertion | Frame_Shift_Ins | novel | c.348_349insCAAACTGAACTGCACATTTGCAGTTTATTAACAT | p.Met117GlnfsTer20 | p.M117Qfs*20 | Q8WXS3 | protein_coding | TCGA-AR-A0U0-01 | Breast | breast invasive carcinoma | Female | >=65 | I/II | Unknown | Unknown | SD | ||
| BAALC | SNV | Missense_Mutation | novel | c.273N>T | p.Gln91His | p.Q91H | Q8WXS3 | protein_coding | deleterious(0.03) | possibly_damaging(0.847) | TCGA-2W-A8YY-01 | Cervix | cervical & endocervical cancer | Female | <65 | I/II | Chemotherapy | cisplatin | CR |
| BAALC | SNV | Missense_Mutation | rs200984161 | c.200G>A | p.Arg67Gln | p.R67Q | Q8WXS3 | protein_coding | tolerated(0.25) | possibly_damaging(0.677) | TCGA-AA-A00N-01 | Colorectum | colon adenocarcinoma | Male | >=65 | I/II | Unknown | Unknown | PD |
| BAALC | SNV | Missense_Mutation | c.423G>T | p.Lys141Asn | p.K141N | Q8WXS3 | protein_coding | deleterious(0.03) | benign(0.409) | TCGA-AA-A00N-01 | Colorectum | colon adenocarcinoma | Male | >=65 | I/II | Unknown | Unknown | PD | |
| BAALC | SNV | Missense_Mutation | c.49N>A | p.Glu17Lys | p.E17K | Q8WXS3 | protein_coding | deleterious(0.01) | benign(0.019) | TCGA-EI-6882-01 | Colorectum | rectum adenocarcinoma | Male | <65 | I/II | Unknown | Unknown | SD | |
| BAALC | SNV | Missense_Mutation | novel | c.431N>C | p.Val144Ala | p.V144A | Q8WXS3 | protein_coding | tolerated(0.13) | benign(0.005) | TCGA-F5-6814-01 | Colorectum | rectum adenocarcinoma | Male | <65 | I/II | Unknown | Unknown | SD |
| BAALC | SNV | Missense_Mutation | novel | c.374N>T | p.Asn125Ile | p.N125I | Q8WXS3 | protein_coding | deleterious(0) | possibly_damaging(0.474) | TCGA-A5-A2K7-01 | Endometrium | uterine corpus endometrioid carcinoma | Female | <65 | I/II | Chemotherapy | taxol | SD |
| BAALC | SNV | Missense_Mutation | c.382N>T | p.Asp128Tyr | p.D128Y | Q8WXS3 | protein_coding | deleterious(0.01) | possibly_damaging(0.466) | TCGA-AP-A059-01 | Endometrium | uterine corpus endometrioid carcinoma | Female | >=65 | I/II | Unknown | Unknown | SD | |
| BAALC | SNV | Missense_Mutation | novel | c.206N>A | p.Thr69Lys | p.T69K | Q8WXS3 | protein_coding | tolerated(0.07) | benign(0.055) | TCGA-05-4398-01 | Lung | lung adenocarcinoma | Female | <65 | III/IV | Chemotherapy | carboplatin | CR |
| Page: 1 2 |
Top |
Related drugs of malignant transformation related genes |
| Identification of chemicals and drugs interact with genes involved in malignant transfromation |
| (DGIdb 4.0) |
| Entrez ID | Symbol | Category | Interaction Types | Drug Claim Name | Drug Name | PMIDs |
| Page: 1 |

Copyright 2023-Present -The University of Texas Health Science Center at Houston |