
|
|||||
|
 | |
| |
| |
| |
| |
| |
|
Gene: B4GAT1 |
Gene summary for B4GAT1 |
| Gene information | Species | Human | Gene symbol | B4GAT1 | Gene ID | 11041 |
| Gene name | beta-1,4-glucuronyltransferase 1 | |
| Gene Alias | B3GN-T1 | |
| Cytomap | 11q13.2 | |
| Gene Type | protein-coding | GO ID | GO:0006022 | UniProtAcc | A0A024R5F9 |
Top |
Malignant transformation analysis |
| Identification of the aberrant gene expression in precancerous and cancerous lesions by comparing the gene expression of stem-like cells in diseased tissues with normal stem cells |
| Entrez ID | Symbol | Replicates | Species | Organ | Tissue | Adj P-value | Log2FC | Malignancy |
| 11041 | B4GAT1 | P2T-E | Human | Esophagus | ESCC | 1.49e-18 | 3.81e-01 | 0.1177 |
| 11041 | B4GAT1 | P4T-E | Human | Esophagus | ESCC | 2.68e-16 | 3.36e-01 | 0.1323 |
| 11041 | B4GAT1 | P5T-E | Human | Esophagus | ESCC | 5.35e-04 | 1.05e-01 | 0.1327 |
| 11041 | B4GAT1 | P8T-E | Human | Esophagus | ESCC | 2.04e-05 | 1.36e-01 | 0.0889 |
| 11041 | B4GAT1 | P9T-E | Human | Esophagus | ESCC | 2.15e-04 | 1.54e-01 | 0.1131 |
| 11041 | B4GAT1 | P10T-E | Human | Esophagus | ESCC | 4.91e-16 | 2.69e-01 | 0.116 |
| 11041 | B4GAT1 | P11T-E | Human | Esophagus | ESCC | 1.47e-12 | 4.69e-01 | 0.1426 |
| 11041 | B4GAT1 | P12T-E | Human | Esophagus | ESCC | 1.01e-18 | 3.19e-01 | 0.1122 |
| 11041 | B4GAT1 | P15T-E | Human | Esophagus | ESCC | 2.64e-09 | 2.41e-01 | 0.1149 |
| 11041 | B4GAT1 | P16T-E | Human | Esophagus | ESCC | 7.95e-29 | 5.22e-01 | 0.1153 |
| 11041 | B4GAT1 | P19T-E | Human | Esophagus | ESCC | 2.66e-07 | 4.97e-01 | 0.1662 |
| 11041 | B4GAT1 | P21T-E | Human | Esophagus | ESCC | 2.45e-04 | 1.76e-01 | 0.1617 |
| 11041 | B4GAT1 | P22T-E | Human | Esophagus | ESCC | 7.87e-09 | 1.23e-01 | 0.1236 |
| 11041 | B4GAT1 | P24T-E | Human | Esophagus | ESCC | 2.54e-03 | 9.44e-02 | 0.1287 |
| 11041 | B4GAT1 | P26T-E | Human | Esophagus | ESCC | 5.55e-07 | 1.04e-01 | 0.1276 |
| 11041 | B4GAT1 | P28T-E | Human | Esophagus | ESCC | 1.24e-03 | 8.65e-02 | 0.1149 |
| 11041 | B4GAT1 | P30T-E | Human | Esophagus | ESCC | 3.09e-02 | 1.67e-01 | 0.137 |
| 11041 | B4GAT1 | P31T-E | Human | Esophagus | ESCC | 9.99e-06 | 5.42e-02 | 0.1251 |
| 11041 | B4GAT1 | P32T-E | Human | Esophagus | ESCC | 3.79e-10 | 2.72e-01 | 0.1666 |
| 11041 | B4GAT1 | P36T-E | Human | Esophagus | ESCC | 2.17e-03 | 1.57e-01 | 0.1187 |
| Page: 1 2 3 4 |
| Tissue | Expression Dynamics | Abbreviation |
| Esophagus | 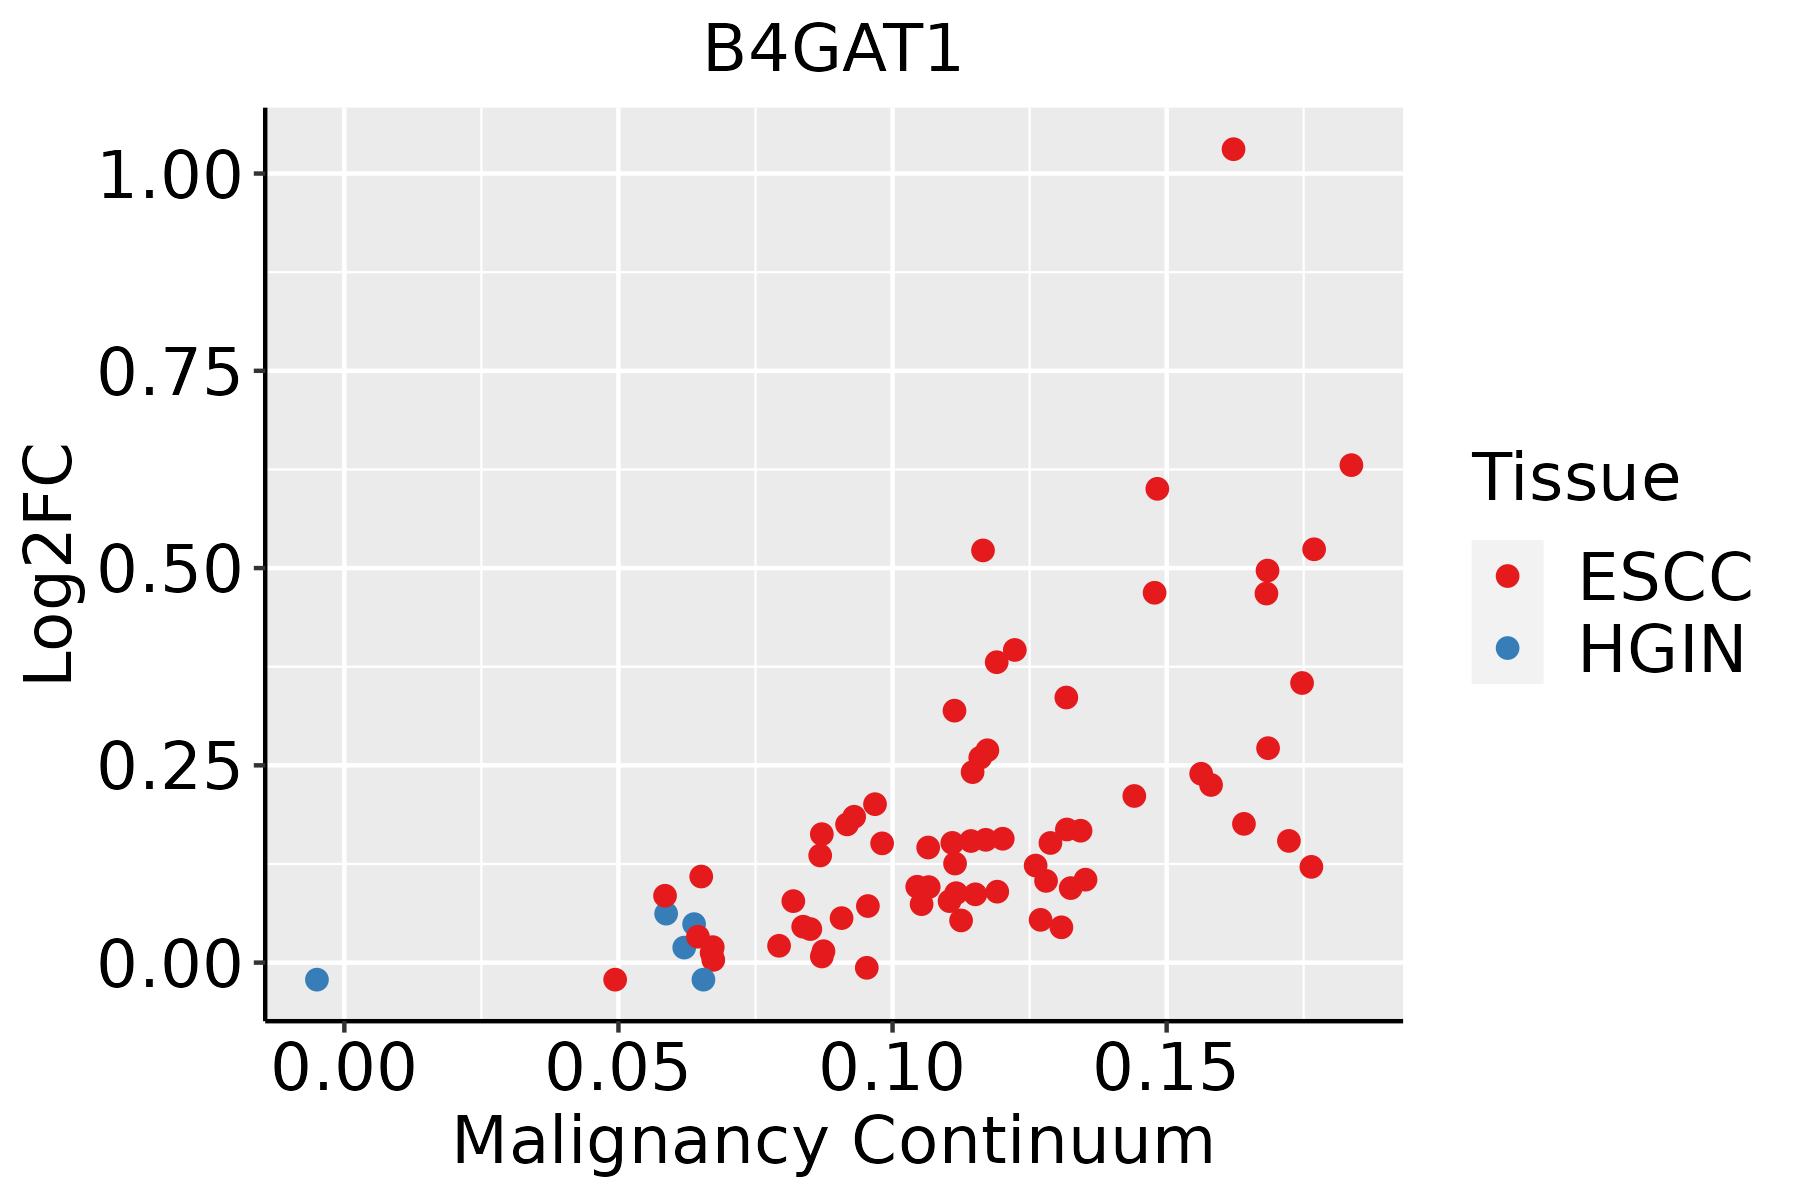 | ESCC: Esophageal squamous cell carcinoma |
| HGIN: High-grade intraepithelial neoplasias | ||
| LGIN: Low-grade intraepithelial neoplasias | ||
| Liver | 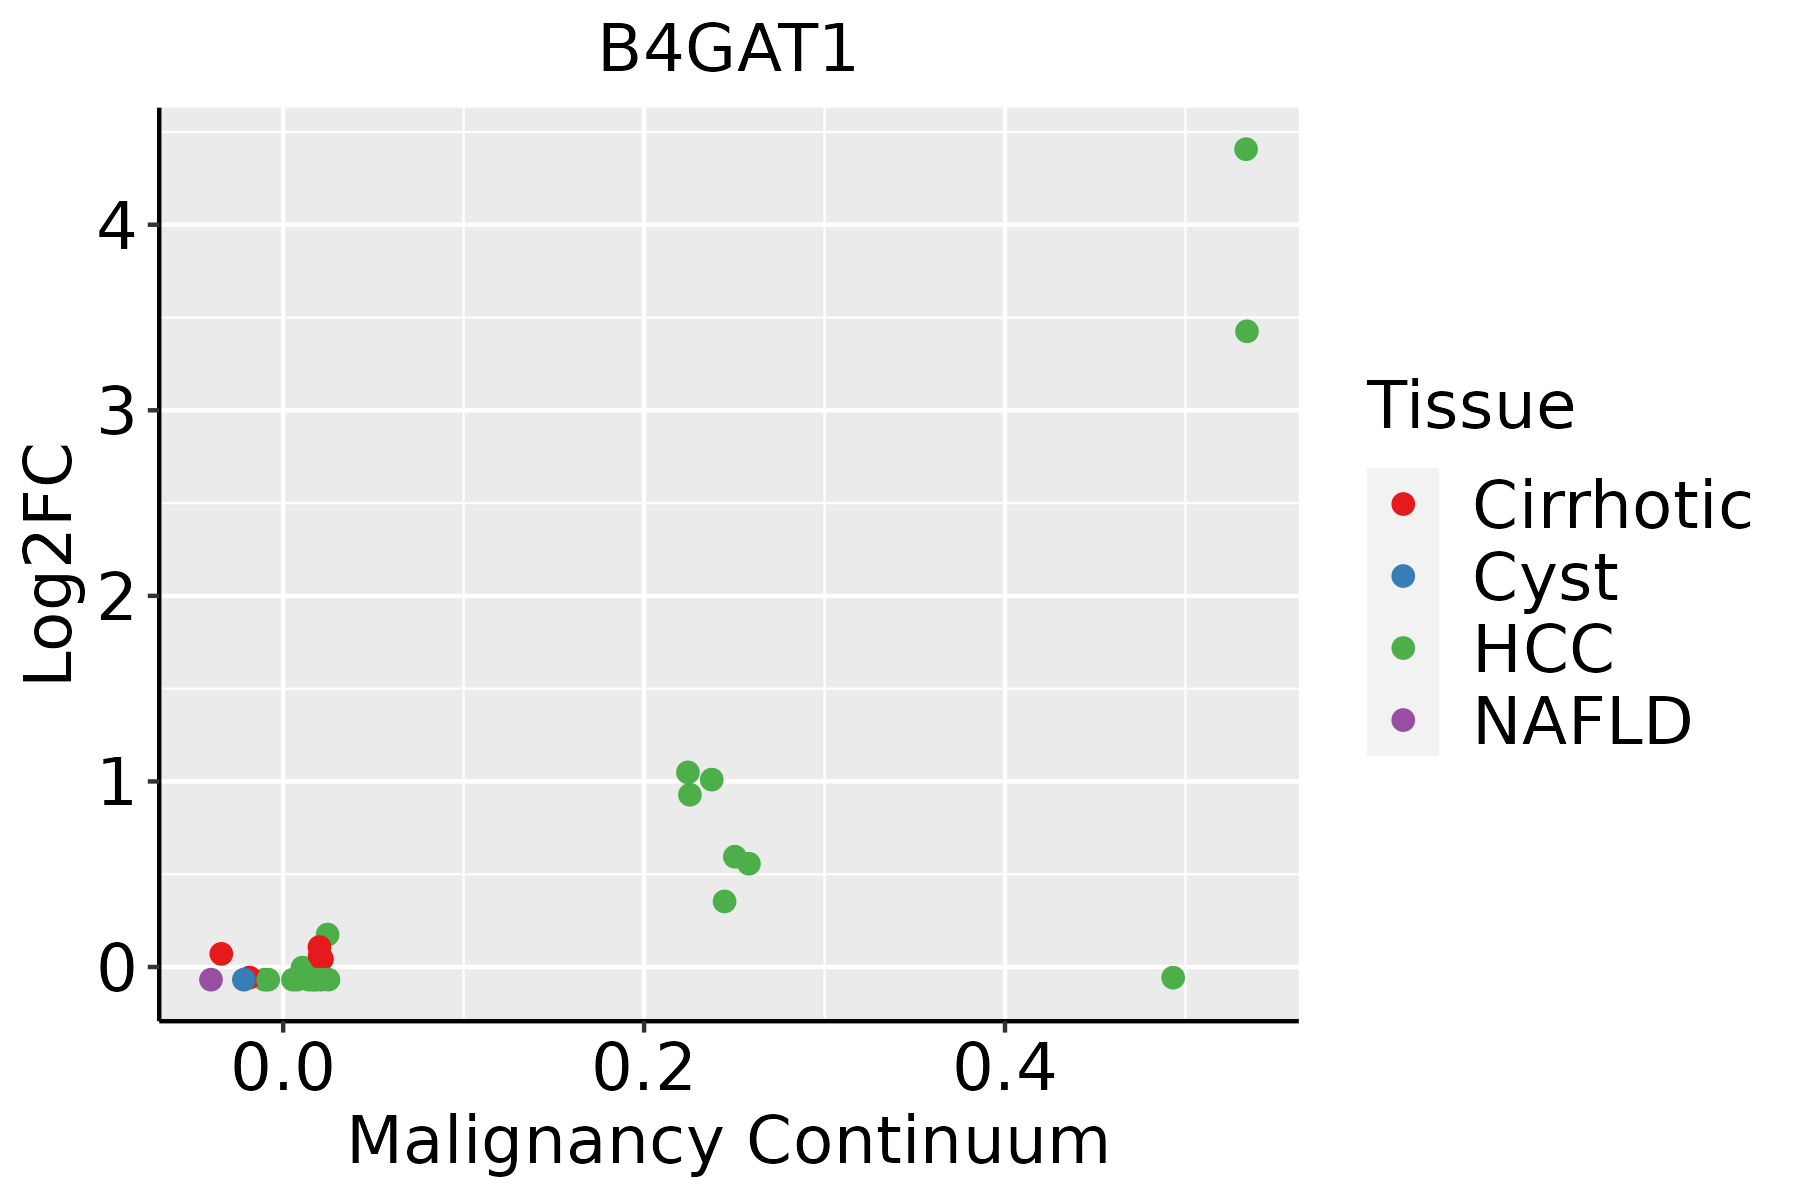 | HCC: Hepatocellular carcinoma |
| NAFLD: Non-alcoholic fatty liver disease | ||
| Oral Cavity | 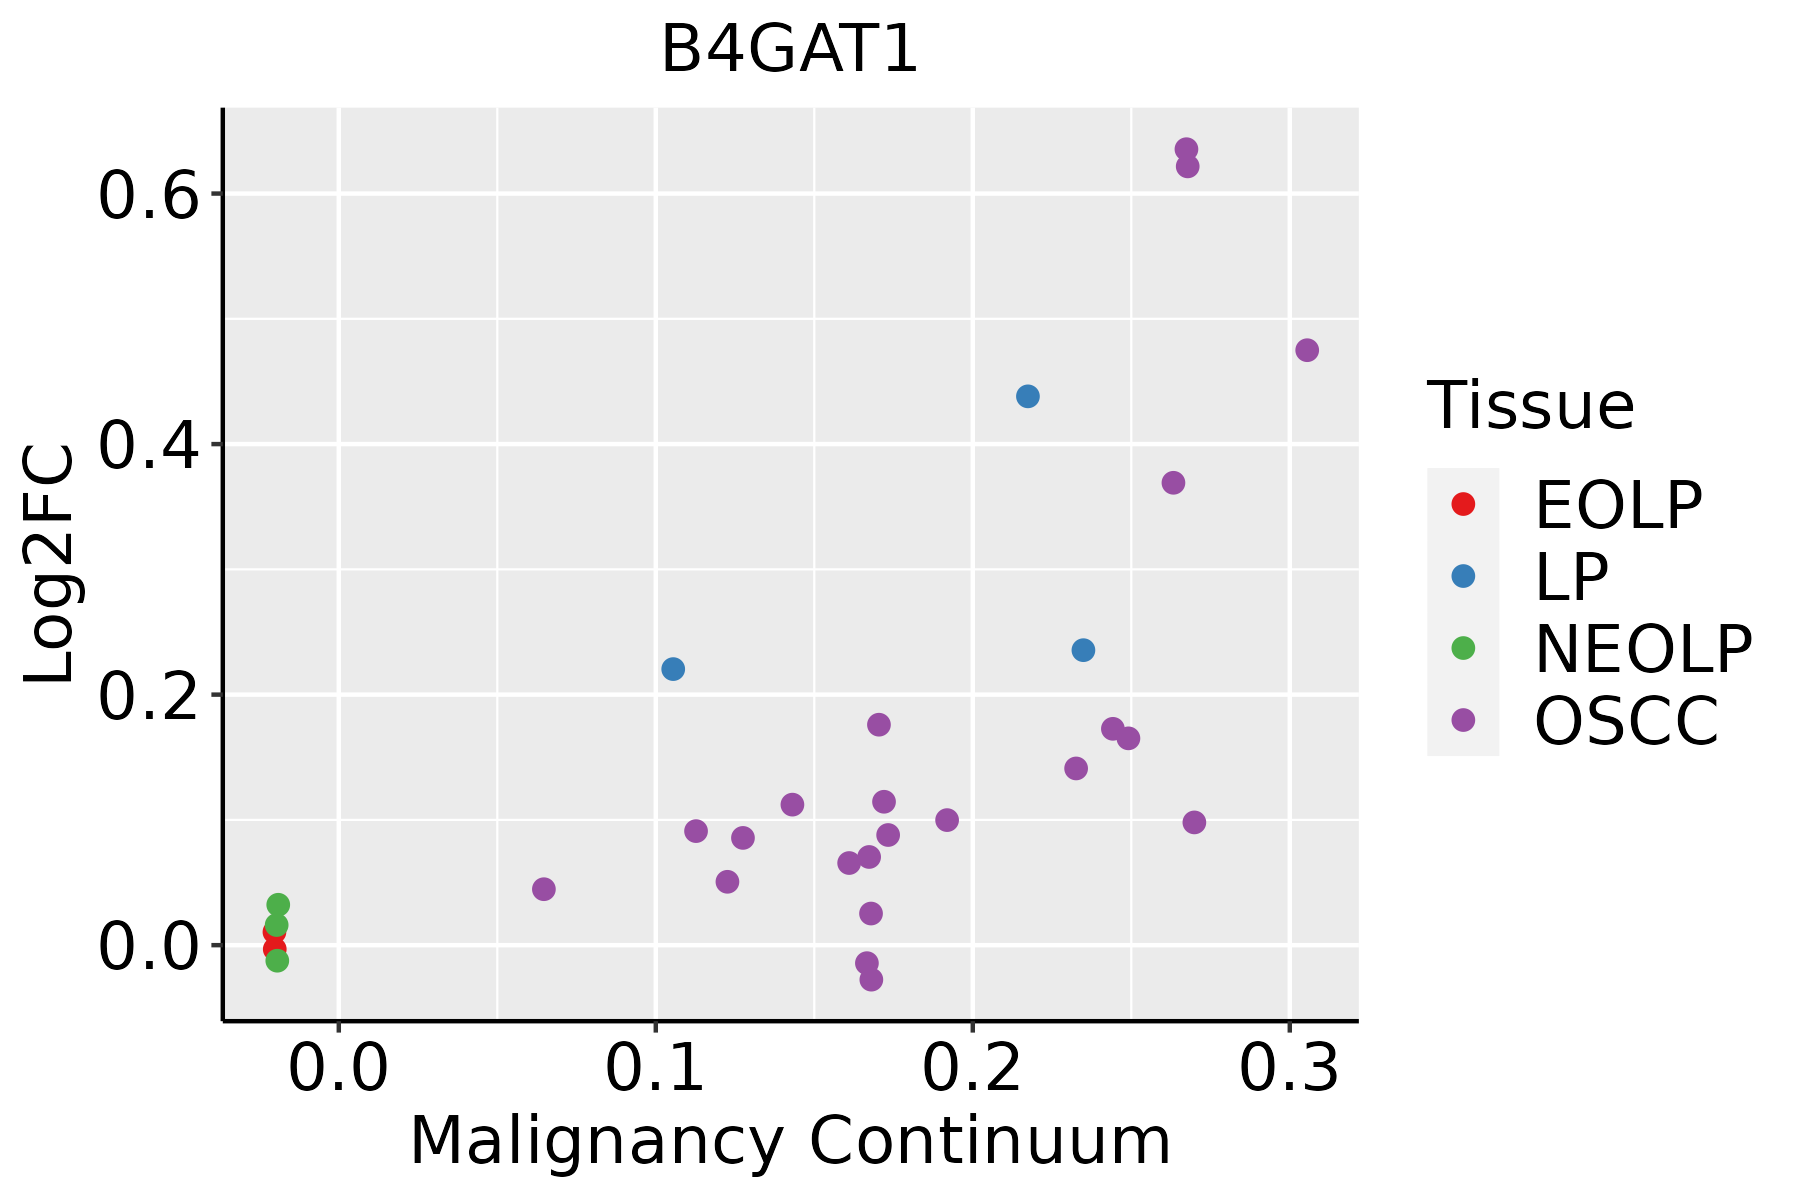 | EOLP: Erosive Oral lichen planus |
| LP: leukoplakia | ||
| NEOLP: Non-erosive oral lichen planus | ||
| OSCC: Oral squamous cell carcinoma | ||
| Thyroid | 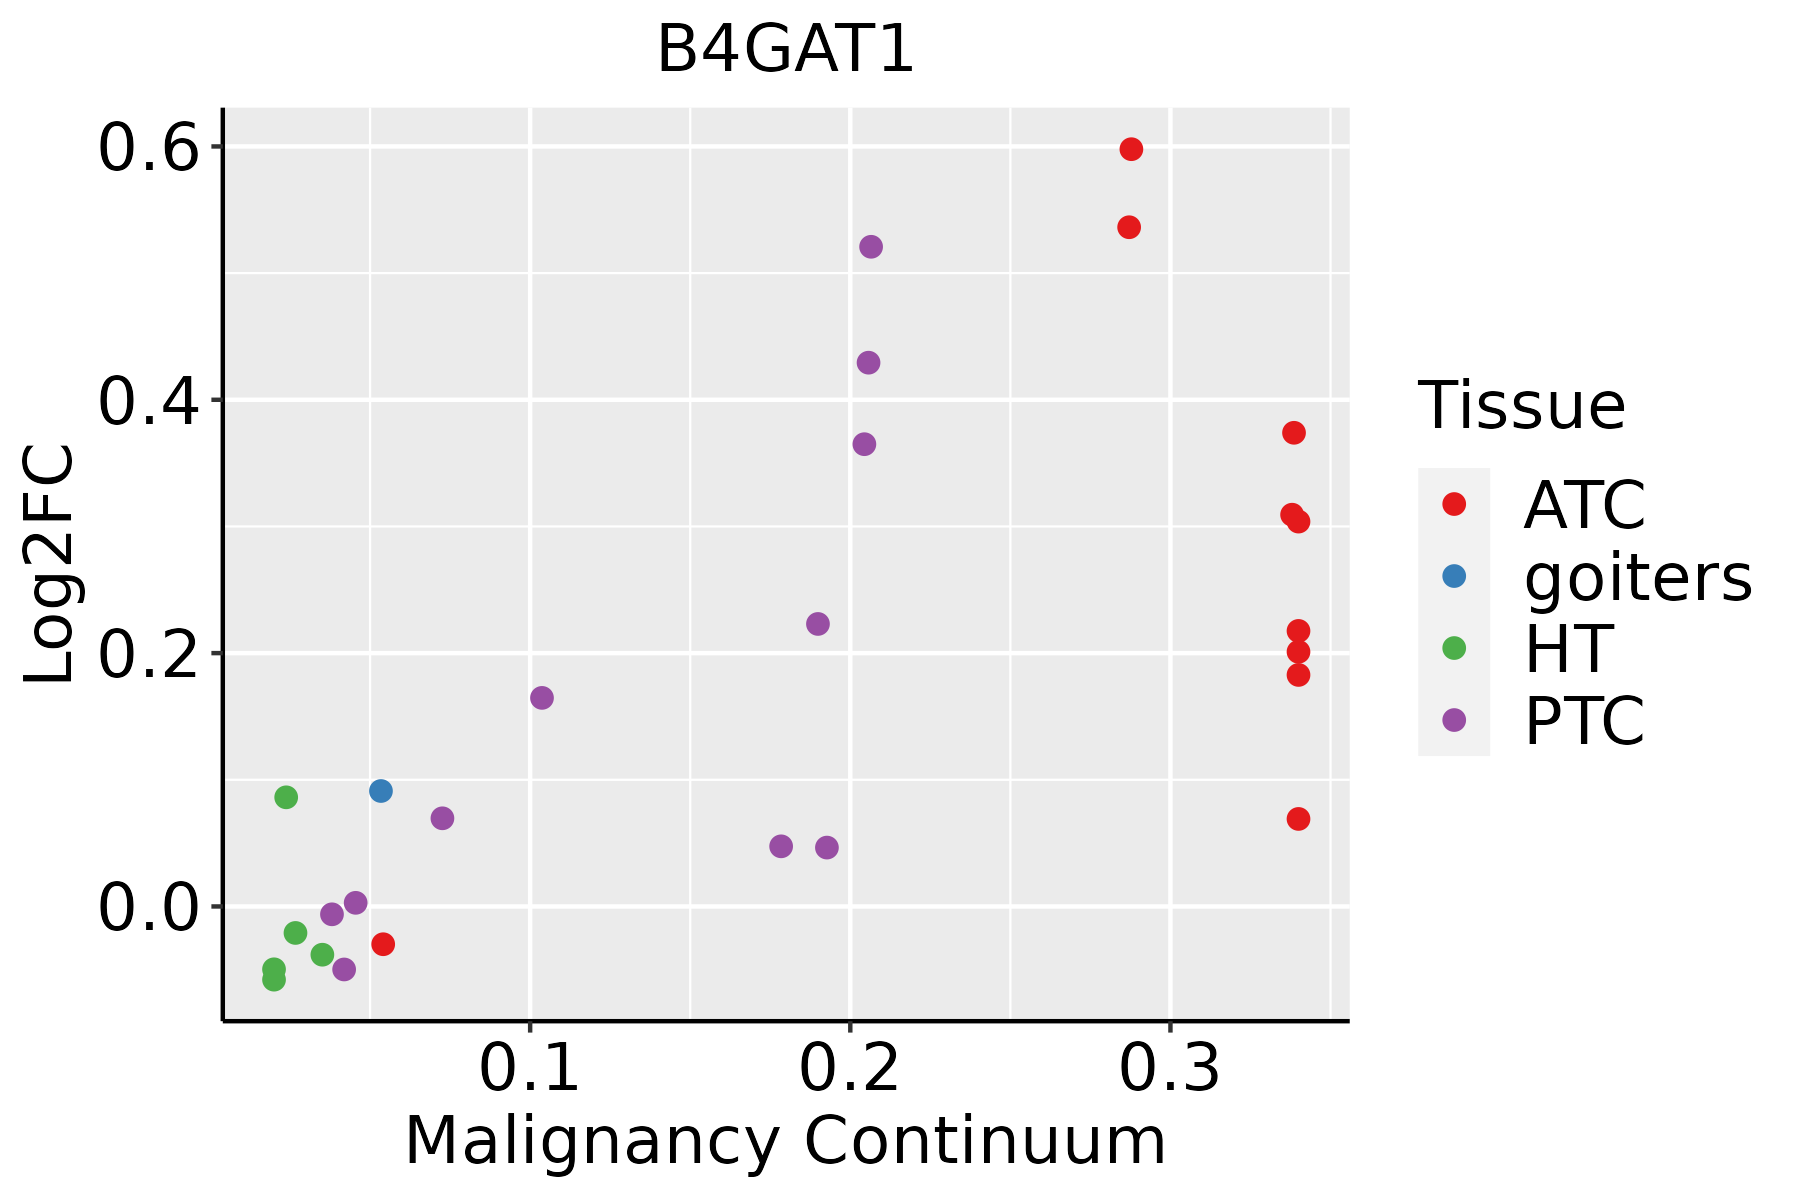 | ATC: Anaplastic thyroid cancer |
| HT: Hashimoto's thyroiditis | ||
| PTC: Papillary thyroid cancer |
| ∗log2FC in expression of this searched gene in stem-like cells from each diseased tissue sample relative to stem-like cells in normal samples in each tissue plotted against the malignancy continuum. Samples are colored based on if they are from different disease stage. |
Top |
Malignant transformation related pathway analysis |
| Find out the enriched GO biological processes and KEGG pathways involved in transition from healthy to precancer to cancer |
| Tissue | Disease Stage | Enriched GO biological Processes |
| Colorectum | AD |  |
| Colorectum | SER |  |
| Colorectum | MSS |  |
| Colorectum | MSI-H |  |
| Colorectum | FAP |  |
| ∗Top 15 enriched GO BP terms are showed in the bar plot of each disease state in each tissue. Each row represents a significant GO biological process which is colored according to the -log10(p.adjust). |
| Page: 1 2 3 4 5 6 7 8 9 |
| GO ID | Tissue | Disease Stage | Description | Gene Ratio | Bg Ratio | pvalue | p.adjust | Count |
| GO:00091002 | Esophagus | ESCC | glycoprotein metabolic process | 226/8552 | 387/18723 | 2.64e-07 | 3.94e-06 | 226 |
| GO:00067906 | Esophagus | ESCC | sulfur compound metabolic process | 201/8552 | 339/18723 | 2.64e-07 | 3.94e-06 | 201 |
| GO:00442725 | Esophagus | ESCC | sulfur compound biosynthetic process | 96/8552 | 148/18723 | 1.86e-06 | 2.16e-05 | 96 |
| GO:00700854 | Esophagus | ESCC | glycosylation | 144/8552 | 240/18723 | 5.12e-06 | 5.38e-05 | 144 |
| GO:00064865 | Esophagus | ESCC | protein glycosylation | 135/8552 | 226/18723 | 1.36e-05 | 1.24e-04 | 135 |
| GO:00434135 | Esophagus | ESCC | macromolecule glycosylation | 135/8552 | 226/18723 | 1.36e-05 | 1.24e-04 | 135 |
| GO:00091012 | Esophagus | ESCC | glycoprotein biosynthetic process | 181/8552 | 317/18723 | 2.54e-05 | 2.15e-04 | 181 |
| GO:00064931 | Esophagus | ESCC | protein O-linked glycosylation | 51/8552 | 86/18723 | 7.54e-03 | 2.70e-02 | 51 |
| GO:0006024 | Esophagus | ESCC | glycosaminoglycan biosynthetic process | 45/8552 | 75/18723 | 8.75e-03 | 3.08e-02 | 45 |
| GO:0006023 | Esophagus | ESCC | aminoglycan biosynthetic process | 47/8552 | 79/18723 | 9.29e-03 | 3.23e-02 | 47 |
| GO:000679021 | Liver | HCC | sulfur compound metabolic process | 212/7958 | 339/18723 | 5.60e-14 | 3.39e-12 | 212 |
| GO:00442722 | Liver | HCC | sulfur compound biosynthetic process | 95/7958 | 148/18723 | 7.89e-08 | 1.58e-06 | 95 |
| GO:00064862 | Liver | HCC | protein glycosylation | 122/7958 | 226/18723 | 3.11e-04 | 2.21e-03 | 122 |
| GO:00434132 | Liver | HCC | macromolecule glycosylation | 122/7958 | 226/18723 | 3.11e-04 | 2.21e-03 | 122 |
| GO:00700852 | Liver | HCC | glycosylation | 128/7958 | 240/18723 | 4.35e-04 | 2.92e-03 | 128 |
| GO:0009100 | Liver | HCC | glycoprotein metabolic process | 193/7958 | 387/18723 | 1.89e-03 | 9.62e-03 | 193 |
| GO:00442724 | Oral cavity | OSCC | sulfur compound biosynthetic process | 82/7305 | 148/18723 | 3.71e-05 | 3.31e-04 | 82 |
| GO:00067905 | Oral cavity | OSCC | sulfur compound metabolic process | 168/7305 | 339/18723 | 4.50e-05 | 3.84e-04 | 168 |
| GO:00091001 | Oral cavity | OSCC | glycoprotein metabolic process | 185/7305 | 387/18723 | 2.37e-04 | 1.54e-03 | 185 |
| GO:00091011 | Oral cavity | OSCC | glycoprotein biosynthetic process | 151/7305 | 317/18723 | 1.01e-03 | 5.26e-03 | 151 |
| Page: 1 2 |
| Pathway ID | Tissue | Disease Stage | Description | Gene Ratio | Bg Ratio | pvalue | p.adjust | qvalue | Count |
| Page: 1 |
Top |
Cell-cell communication analysis |
| Identification of potential cell-cell interactions between two cell types and their ligand-receptor pairs for different disease states |
| Ligand | Receptor | LRpair | Pathway | Tissue | Disease Stage |
| Page: 1 |
Top |
Single-cell gene regulatory network inference analysis |
| Find out the significant the regulons (TFs) and the target genes of each regulon across cell types for different disease states |
| TF | Cell Type | Tissue | Disease Stage | Target Gene | RSS | Regulon Activity |
| ∗The dot plots of a searched regulon are shown for all cell subpopulations in each disease state of each tissue based on the regulon specific score inferred using pySCENIC and by calculating the average expression. |
| Page: 1 |
Top |
Somatic mutation of malignant transformation related genes |
| Annotation of somatic variants for genes involved in malignant transformation |
| Hugo Symbol | Variant Class | Variant Classification | dbSNP RS | HGVSc | HGVSp | HGVSp Short | SWISSPROT | BIOTYPE | SIFT | PolyPhen | Tumor Sample Barcode | Tissue | Histology | Sex | Age | Stage | Therapy Types | Drugs | Outcome |
| B4GAT1 | SNV | Missense_Mutation | rs773522708 | c.810N>T | p.Met270Ile | p.M270I | O43505 | protein_coding | tolerated(0.18) | benign(0) | TCGA-A1-A0SE-01 | Breast | breast invasive carcinoma | Female | <65 | I/II | Unknown | Unknown | SD |
| B4GAT1 | deletion | Frame_Shift_Del | novel | c.807delC | p.Met270Ter | p.M270* | O43505 | protein_coding | TCGA-EW-A2FV-01 | Breast | breast invasive carcinoma | Female | <65 | III/IV | Chemotherapy | docetaxel | SD | ||
| B4GAT1 | SNV | Missense_Mutation | novel | c.923N>T | p.Pro308Leu | p.P308L | O43505 | protein_coding | tolerated(0.06) | possibly_damaging(0.475) | TCGA-5M-AAT6-01 | Colorectum | colon adenocarcinoma | Female | <65 | III/IV | Unknown | Unknown | PD |
| B4GAT1 | SNV | Missense_Mutation | c.293N>G | p.Ala98Gly | p.A98G | O43505 | protein_coding | deleterious(0.02) | probably_damaging(0.909) | TCGA-A6-6653-01 | Colorectum | colon adenocarcinoma | Male | >=65 | I/II | Unknown | Unknown | SD | |
| B4GAT1 | SNV | Missense_Mutation | c.1063N>A | p.Glu355Lys | p.E355K | O43505 | protein_coding | deleterious(0) | probably_damaging(0.997) | TCGA-AA-3672-01 | Colorectum | colon adenocarcinoma | Female | >=65 | III/IV | Unknown | Unknown | SD | |
| B4GAT1 | SNV | Missense_Mutation | c.320T>A | p.Leu107Gln | p.L107Q | O43505 | protein_coding | tolerated(0.29) | benign(0.06) | TCGA-CK-4951-01 | Colorectum | colon adenocarcinoma | Female | >=65 | I/II | Unknown | Unknown | PD | |
| B4GAT1 | SNV | Missense_Mutation | c.1069N>T | p.His357Tyr | p.H357Y | O43505 | protein_coding | deleterious(0) | benign(0.1) | TCGA-CK-5916-01 | Colorectum | colon adenocarcinoma | Female | >=65 | I/II | Unknown | Unknown | PD | |
| B4GAT1 | SNV | Missense_Mutation | c.796N>T | p.Arg266Cys | p.R266C | O43505 | protein_coding | tolerated(0.08) | possibly_damaging(0.836) | TCGA-D5-6928-01 | Colorectum | colon adenocarcinoma | Male | >=65 | I/II | Unknown | Unknown | SD | |
| B4GAT1 | SNV | Missense_Mutation | c.1193G>A | p.Arg398His | p.R398H | O43505 | protein_coding | deleterious(0) | benign(0.427) | TCGA-G4-6628-01 | Colorectum | colon adenocarcinoma | Male | >=65 | I/II | Unknown | Unknown | SD | |
| B4GAT1 | SNV | Missense_Mutation | c.1182G>T | p.Lys394Asn | p.K394N | O43505 | protein_coding | deleterious(0.02) | possibly_damaging(0.564) | TCGA-EI-6917-01 | Colorectum | rectum adenocarcinoma | Male | <65 | III/IV | Chemotherapy | 5fluorouracil+oxaciplatina+l-folinian | SD |
| Page: 1 2 3 4 5 |
Top |
Related drugs of malignant transformation related genes |
| Identification of chemicals and drugs interact with genes involved in malignant transfromation |
| (DGIdb 4.0) |
| Entrez ID | Symbol | Category | Interaction Types | Drug Claim Name | Drug Name | PMIDs |
| Page: 1 |

Copyright 2023-Present -The University of Texas Health Science Center at Houston |