
|
|||||
|
 | |
| |
| |
| |
| |
| |
|
Gene: B4GALT7 |
Gene summary for B4GALT7 |
| Gene information | Species | Human | Gene symbol | B4GALT7 | Gene ID | 11285 |
| Gene name | beta-1,4-galactosyltransferase 7 | |
| Gene Alias | EDSP1 | |
| Cytomap | 5q35.3 | |
| Gene Type | protein-coding | GO ID | GO:0005975 | UniProtAcc | Q9UBV7 |
Top |
Malignant transformation analysis |
| Identification of the aberrant gene expression in precancerous and cancerous lesions by comparing the gene expression of stem-like cells in diseased tissues with normal stem cells |
| Entrez ID | Symbol | Replicates | Species | Organ | Tissue | Adj P-value | Log2FC | Malignancy |
| 11285 | B4GALT7 | LZE4T | Human | Esophagus | ESCC | 3.03e-08 | 2.30e-01 | 0.0811 |
| 11285 | B4GALT7 | LZE7T | Human | Esophagus | ESCC | 4.15e-02 | 1.90e-01 | 0.0667 |
| 11285 | B4GALT7 | LZE20T | Human | Esophagus | ESCC | 2.99e-04 | 1.88e-01 | 0.0662 |
| 11285 | B4GALT7 | LZE24T | Human | Esophagus | ESCC | 1.39e-12 | 3.20e-01 | 0.0596 |
| 11285 | B4GALT7 | P2T-E | Human | Esophagus | ESCC | 1.75e-23 | 4.32e-01 | 0.1177 |
| 11285 | B4GALT7 | P4T-E | Human | Esophagus | ESCC | 1.12e-21 | 4.18e-01 | 0.1323 |
| 11285 | B4GALT7 | P5T-E | Human | Esophagus | ESCC | 1.06e-12 | 3.07e-01 | 0.1327 |
| 11285 | B4GALT7 | P8T-E | Human | Esophagus | ESCC | 1.15e-10 | 1.76e-01 | 0.0889 |
| 11285 | B4GALT7 | P9T-E | Human | Esophagus | ESCC | 6.23e-08 | 1.99e-01 | 0.1131 |
| 11285 | B4GALT7 | P10T-E | Human | Esophagus | ESCC | 4.25e-14 | 1.90e-01 | 0.116 |
| 11285 | B4GALT7 | P11T-E | Human | Esophagus | ESCC | 3.69e-20 | 6.54e-01 | 0.1426 |
| 11285 | B4GALT7 | P12T-E | Human | Esophagus | ESCC | 2.40e-22 | 3.86e-01 | 0.1122 |
| 11285 | B4GALT7 | P15T-E | Human | Esophagus | ESCC | 2.35e-29 | 5.80e-01 | 0.1149 |
| 11285 | B4GALT7 | P16T-E | Human | Esophagus | ESCC | 9.56e-15 | 3.36e-01 | 0.1153 |
| 11285 | B4GALT7 | P17T-E | Human | Esophagus | ESCC | 5.55e-14 | 3.74e-01 | 0.1278 |
| 11285 | B4GALT7 | P19T-E | Human | Esophagus | ESCC | 2.47e-06 | 7.27e-01 | 0.1662 |
| 11285 | B4GALT7 | P20T-E | Human | Esophagus | ESCC | 2.74e-04 | 1.43e-01 | 0.1124 |
| 11285 | B4GALT7 | P21T-E | Human | Esophagus | ESCC | 3.38e-33 | 6.21e-01 | 0.1617 |
| 11285 | B4GALT7 | P22T-E | Human | Esophagus | ESCC | 1.22e-41 | 7.32e-01 | 0.1236 |
| 11285 | B4GALT7 | P23T-E | Human | Esophagus | ESCC | 3.47e-21 | 5.36e-01 | 0.108 |
| Page: 1 2 3 4 5 |
| Tissue | Expression Dynamics | Abbreviation |
| Esophagus | 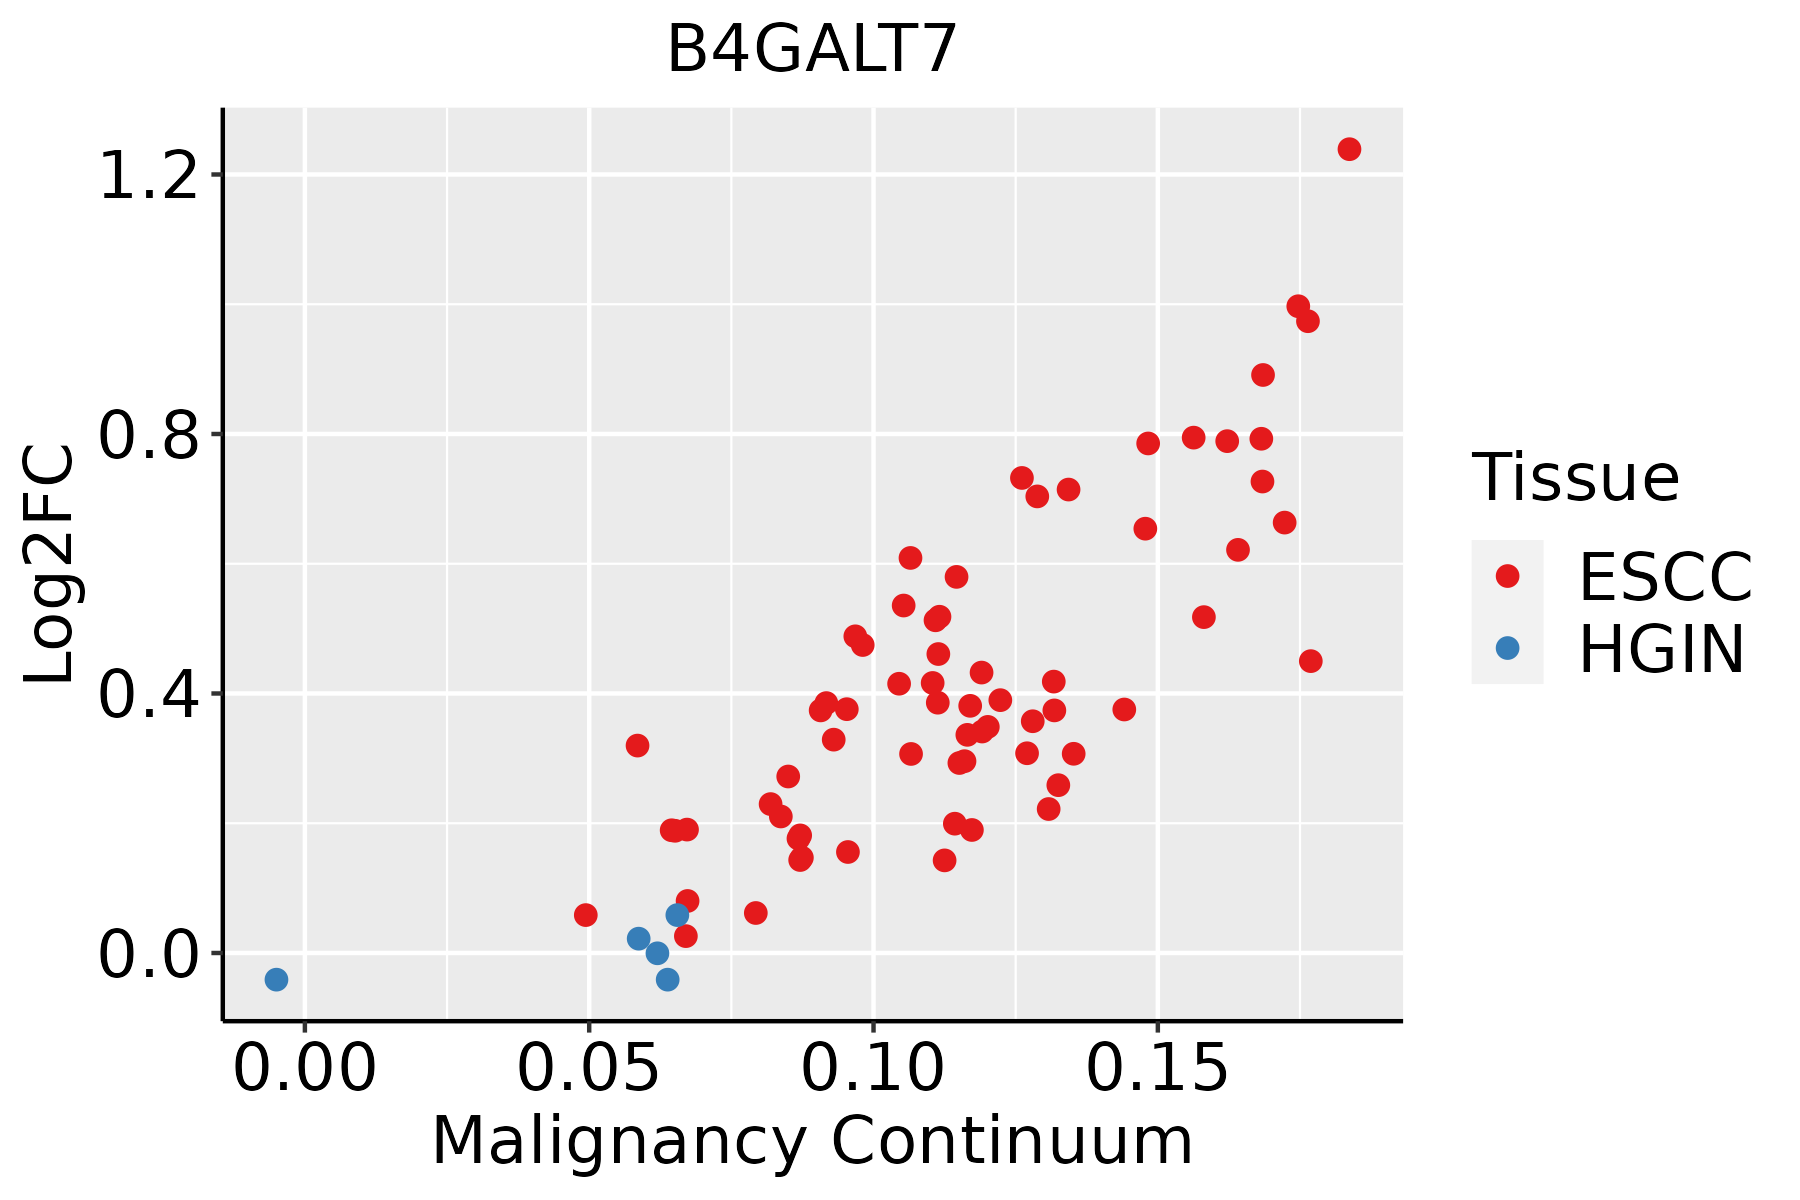 | ESCC: Esophageal squamous cell carcinoma |
| HGIN: High-grade intraepithelial neoplasias | ||
| LGIN: Low-grade intraepithelial neoplasias | ||
| Liver | 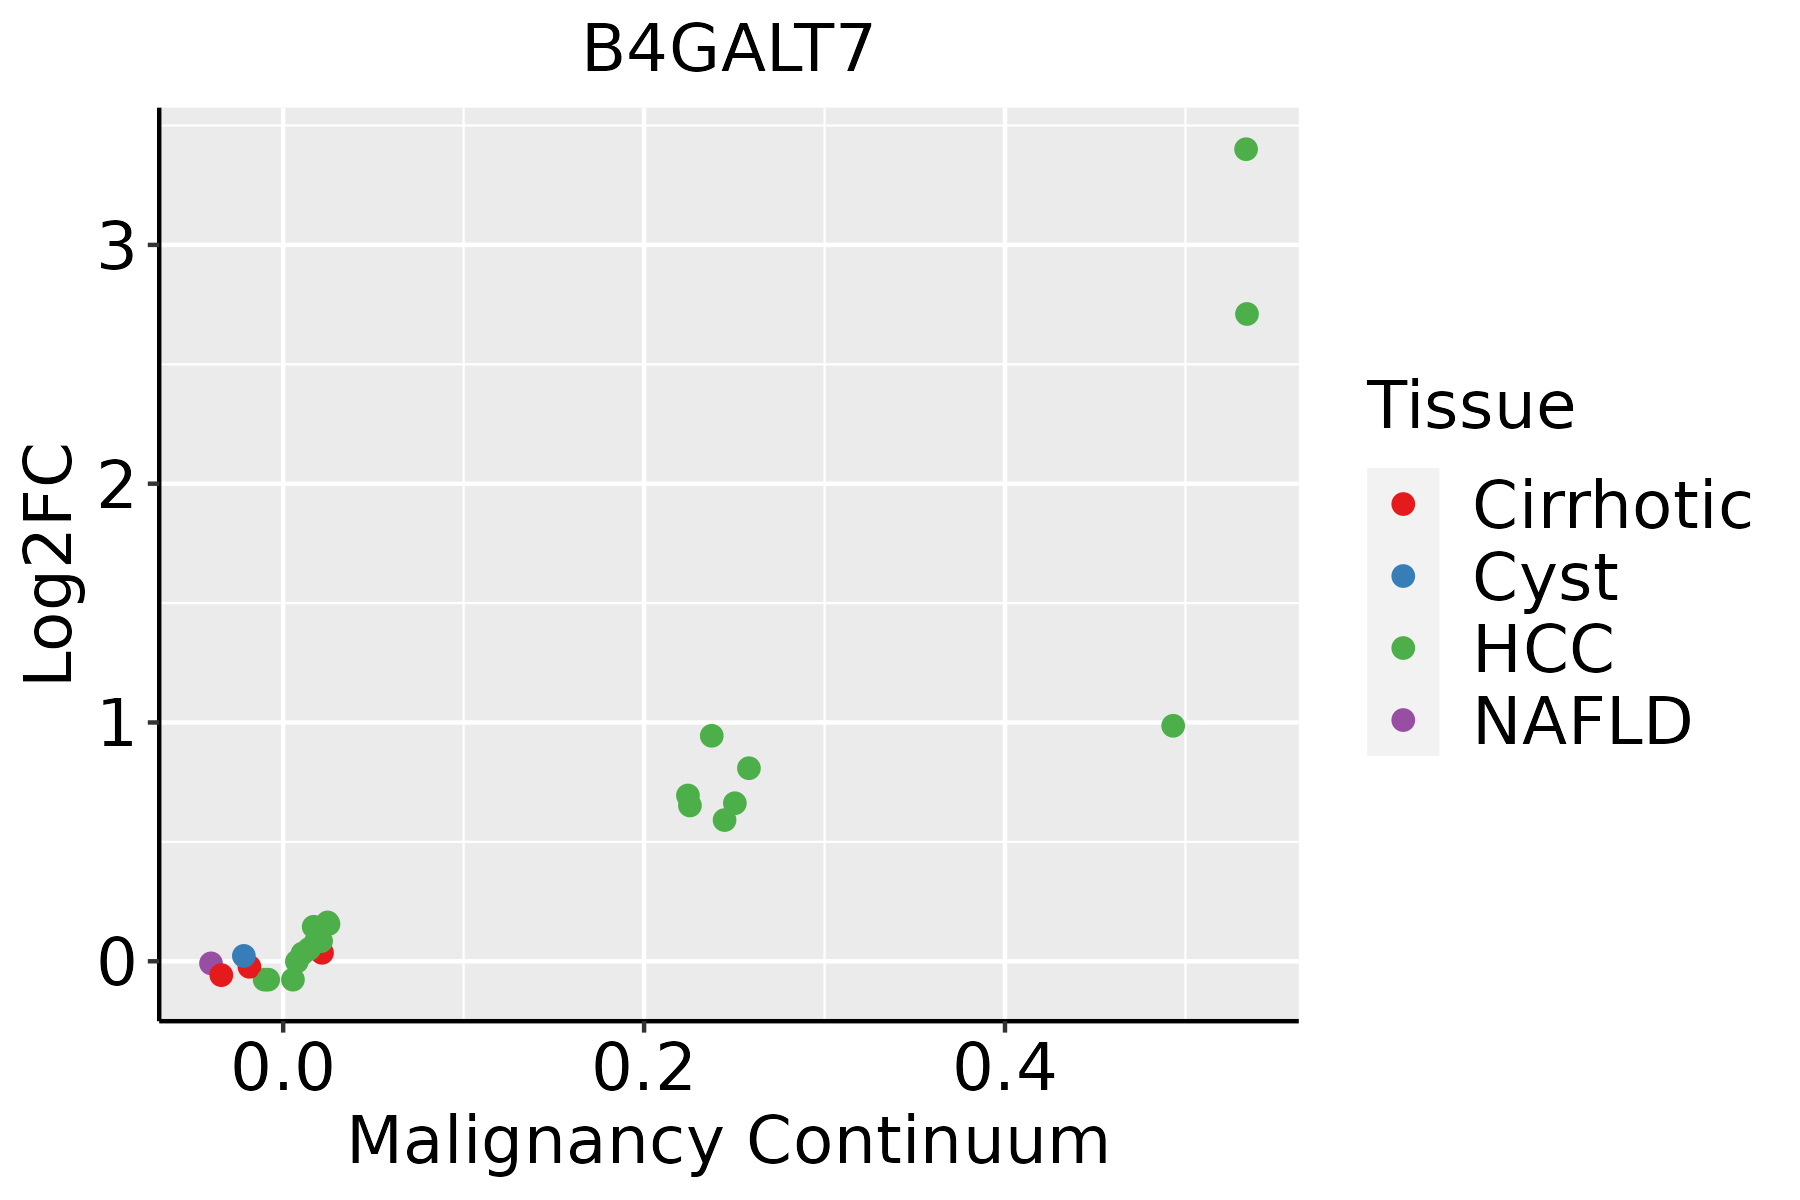 | HCC: Hepatocellular carcinoma |
| NAFLD: Non-alcoholic fatty liver disease | ||
| Oral Cavity |  | EOLP: Erosive Oral lichen planus |
| LP: leukoplakia | ||
| NEOLP: Non-erosive oral lichen planus | ||
| OSCC: Oral squamous cell carcinoma |
| ∗log2FC in expression of this searched gene in stem-like cells from each diseased tissue sample relative to stem-like cells in normal samples in each tissue plotted against the malignancy continuum. Samples are colored based on if they are from different disease stage. |
Top |
Malignant transformation related pathway analysis |
| Find out the enriched GO biological processes and KEGG pathways involved in transition from healthy to precancer to cancer |
| Tissue | Disease Stage | Enriched GO biological Processes |
| Colorectum | AD |  |
| Colorectum | SER |  |
| Colorectum | MSS |  |
| Colorectum | MSI-H |  |
| Colorectum | FAP |  |
| ∗Top 15 enriched GO BP terms are showed in the bar plot of each disease state in each tissue. Each row represents a significant GO biological process which is colored according to the -log10(p.adjust). |
| Page: 1 2 3 4 5 6 7 8 9 |
| GO ID | Tissue | Disease Stage | Description | Gene Ratio | Bg Ratio | pvalue | p.adjust | Count |
| GO:000648714 | Esophagus | ESCC | protein N-linked glycosylation | 51/8552 | 65/18723 | 6.41e-08 | 1.13e-06 | 51 |
| GO:00091002 | Esophagus | ESCC | glycoprotein metabolic process | 226/8552 | 387/18723 | 2.64e-07 | 3.94e-06 | 226 |
| GO:00700854 | Esophagus | ESCC | glycosylation | 144/8552 | 240/18723 | 5.12e-06 | 5.38e-05 | 144 |
| GO:004814414 | Esophagus | ESCC | fibroblast proliferation | 57/8552 | 81/18723 | 5.83e-06 | 6.03e-05 | 57 |
| GO:004814514 | Esophagus | ESCC | regulation of fibroblast proliferation | 56/8552 | 80/18723 | 9.08e-06 | 8.71e-05 | 56 |
| GO:00064865 | Esophagus | ESCC | protein glycosylation | 135/8552 | 226/18723 | 1.36e-05 | 1.24e-04 | 135 |
| GO:00434135 | Esophagus | ESCC | macromolecule glycosylation | 135/8552 | 226/18723 | 1.36e-05 | 1.24e-04 | 135 |
| GO:00091012 | Esophagus | ESCC | glycoprotein biosynthetic process | 181/8552 | 317/18723 | 2.54e-05 | 2.15e-04 | 181 |
| GO:00481471 | Esophagus | ESCC | negative regulation of fibroblast proliferation | 22/8552 | 30/18723 | 1.98e-03 | 8.90e-03 | 22 |
| GO:0006029 | Esophagus | ESCC | proteoglycan metabolic process | 48/8552 | 79/18723 | 4.93e-03 | 1.89e-02 | 48 |
| GO:0030166 | Esophagus | ESCC | proteoglycan biosynthetic process | 35/8552 | 56/18723 | 8.30e-03 | 2.94e-02 | 35 |
| GO:0006024 | Esophagus | ESCC | glycosaminoglycan biosynthetic process | 45/8552 | 75/18723 | 8.75e-03 | 3.08e-02 | 45 |
| GO:0006023 | Esophagus | ESCC | aminoglycan biosynthetic process | 47/8552 | 79/18723 | 9.29e-03 | 3.23e-02 | 47 |
| GO:000648711 | Liver | HCC | protein N-linked glycosylation | 48/7958 | 65/18723 | 2.85e-07 | 5.00e-06 | 48 |
| GO:00064862 | Liver | HCC | protein glycosylation | 122/7958 | 226/18723 | 3.11e-04 | 2.21e-03 | 122 |
| GO:00434132 | Liver | HCC | macromolecule glycosylation | 122/7958 | 226/18723 | 3.11e-04 | 2.21e-03 | 122 |
| GO:00700852 | Liver | HCC | glycosylation | 128/7958 | 240/18723 | 4.35e-04 | 2.92e-03 | 128 |
| GO:0009100 | Liver | HCC | glycoprotein metabolic process | 193/7958 | 387/18723 | 1.89e-03 | 9.62e-03 | 193 |
| GO:00064875 | Oral cavity | OSCC | protein N-linked glycosylation | 44/7305 | 65/18723 | 2.63e-06 | 3.26e-05 | 44 |
| GO:00481446 | Oral cavity | OSCC | fibroblast proliferation | 49/7305 | 81/18723 | 7.27e-05 | 5.72e-04 | 49 |
| Page: 1 2 |
| Pathway ID | Tissue | Disease Stage | Description | Gene Ratio | Bg Ratio | pvalue | p.adjust | qvalue | Count |
| hsa00532 | Oral cavity | OSCC | Glycosaminoglycan biosynthesis - chondroitin sulfate / dermatan sulfate | 16/3704 | 21/8465 | 2.61e-03 | 6.77e-03 | 3.45e-03 | 16 |
| hsa005321 | Oral cavity | OSCC | Glycosaminoglycan biosynthesis - chondroitin sulfate / dermatan sulfate | 16/3704 | 21/8465 | 2.61e-03 | 6.77e-03 | 3.45e-03 | 16 |
| Page: 1 |
Top |
Cell-cell communication analysis |
| Identification of potential cell-cell interactions between two cell types and their ligand-receptor pairs for different disease states |
| Ligand | Receptor | LRpair | Pathway | Tissue | Disease Stage |
| Page: 1 |
Top |
Single-cell gene regulatory network inference analysis |
| Find out the significant the regulons (TFs) and the target genes of each regulon across cell types for different disease states |
| TF | Cell Type | Tissue | Disease Stage | Target Gene | RSS | Regulon Activity |
| ∗The dot plots of a searched regulon are shown for all cell subpopulations in each disease state of each tissue based on the regulon specific score inferred using pySCENIC and by calculating the average expression. |
| Page: 1 |
Top |
Somatic mutation of malignant transformation related genes |
| Annotation of somatic variants for genes involved in malignant transformation |
| Hugo Symbol | Variant Class | Variant Classification | dbSNP RS | HGVSc | HGVSp | HGVSp Short | SWISSPROT | BIOTYPE | SIFT | PolyPhen | Tumor Sample Barcode | Tissue | Histology | Sex | Age | Stage | Therapy Types | Drugs | Outcome |
| B4GALT7 | SNV | Missense_Mutation | novel | c.307N>A | p.Glu103Lys | p.E103K | Q9UBV7 | protein_coding | deleterious(0.01) | possibly_damaging(0.59) | TCGA-AN-A046-01 | Breast | breast invasive carcinoma | Female | >=65 | I/II | Unknown | Unknown | SD |
| B4GALT7 | deletion | Frame_Shift_Del | novel | c.163delN | p.Asp56ThrfsTer64 | p.D56Tfs*64 | Q9UBV7 | protein_coding | TCGA-EW-A2FV-01 | Breast | breast invasive carcinoma | Female | <65 | III/IV | Chemotherapy | docetaxel | SD | ||
| B4GALT7 | SNV | Missense_Mutation | rs147617631 | c.697N>T | p.Arg233Trp | p.R233W | Q9UBV7 | protein_coding | deleterious(0.03) | probably_damaging(0.935) | TCGA-EA-A50E-01 | Cervix | cervical & endocervical cancer | Female | <65 | I/II | Unknown | Unknown | PD |
| B4GALT7 | SNV | Missense_Mutation | c.482N>C | p.Met161Thr | p.M161T | Q9UBV7 | protein_coding | deleterious(0) | probably_damaging(0.998) | TCGA-AM-5821-01 | Colorectum | colon adenocarcinoma | Female | >=65 | I/II | Unknown | Unknown | SD | |
| B4GALT7 | SNV | Missense_Mutation | c.280C>T | p.Arg94Cys | p.R94C | Q9UBV7 | protein_coding | deleterious(0) | probably_damaging(0.969) | TCGA-AZ-6601-01 | Colorectum | colon adenocarcinoma | Male | >=65 | I/II | Unknown | Unknown | PD | |
| B4GALT7 | SNV | Missense_Mutation | novel | c.307N>A | p.Glu103Lys | p.E103K | Q9UBV7 | protein_coding | deleterious(0.01) | possibly_damaging(0.59) | TCGA-CA-6717-01 | Colorectum | colon adenocarcinoma | Male | <65 | I/II | Chemotherapy | oxaliplatin | CR |
| B4GALT7 | SNV | Missense_Mutation | novel | c.784G>T | p.Ala262Ser | p.A262S | Q9UBV7 | protein_coding | tolerated(0.44) | benign(0.028) | TCGA-D5-6540-01 | Colorectum | colon adenocarcinoma | Male | >=65 | I/II | Unknown | Unknown | SD |
| B4GALT7 | SNV | Missense_Mutation | rs145129446 | c.467N>T | p.Thr156Met | p.T156M | Q9UBV7 | protein_coding | tolerated(0.22) | probably_damaging(0.915) | TCGA-D5-6928-01 | Colorectum | colon adenocarcinoma | Male | >=65 | I/II | Unknown | Unknown | SD |
| B4GALT7 | insertion | Frame_Shift_Ins | novel | c.310_311insAGGTG | p.Arg104GlnfsTer18 | p.R104Qfs*18 | Q9UBV7 | protein_coding | TCGA-AM-5820-01 | Colorectum | colon adenocarcinoma | Female | <65 | I/II | Unknown | Unknown | SD | ||
| B4GALT7 | SNV | Missense_Mutation | novel | c.464G>A | p.Ser155Asn | p.S155N | Q9UBV7 | protein_coding | tolerated(0.35) | benign(0.062) | TCGA-A5-A1OF-01 | Endometrium | uterine corpus endometrioid carcinoma | Female | <65 | I/II | Unknown | Unknown | SD |
| Page: 1 2 3 |
Top |
Related drugs of malignant transformation related genes |
| Identification of chemicals and drugs interact with genes involved in malignant transfromation |
| (DGIdb 4.0) |
| Entrez ID | Symbol | Category | Interaction Types | Drug Claim Name | Drug Name | PMIDs |
| Page: 1 |

Copyright 2023-Present -The University of Texas Health Science Center at Houston |