
|
|||||
|
 | |
| |
| |
| |
| |
| |
|
Gene: B4GALT4 |
Gene summary for B4GALT4 |
| Gene information | Species | Human | Gene symbol | B4GALT4 | Gene ID | 8702 |
| Gene name | beta-1,4-galactosyltransferase 4 | |
| Gene Alias | B4Gal-T4 | |
| Cytomap | 3q13.32 | |
| Gene Type | protein-coding | GO ID | GO:0005975 | UniProtAcc | B2RAZ5 |
Top |
Malignant transformation analysis |
| Identification of the aberrant gene expression in precancerous and cancerous lesions by comparing the gene expression of stem-like cells in diseased tissues with normal stem cells |
| Entrez ID | Symbol | Replicates | Species | Organ | Tissue | Adj P-value | Log2FC | Malignancy |
| 8702 | B4GALT4 | CCI_1 | Human | Cervix | CC | 4.01e-11 | 1.04e+00 | 0.528 |
| 8702 | B4GALT4 | CCI_3 | Human | Cervix | CC | 1.67e-03 | 3.36e-01 | 0.516 |
| 8702 | B4GALT4 | Tumor | Human | Cervix | CC | 1.04e-16 | 4.55e-01 | 0.1241 |
| 8702 | B4GALT4 | sample3 | Human | Cervix | CC | 1.41e-26 | 6.02e-01 | 0.1387 |
| 8702 | B4GALT4 | T3 | Human | Cervix | CC | 1.32e-32 | 6.08e-01 | 0.1389 |
| 8702 | B4GALT4 | LZE2T | Human | Esophagus | ESCC | 7.76e-05 | 6.50e-01 | 0.082 |
| 8702 | B4GALT4 | LZE4T | Human | Esophagus | ESCC | 1.76e-08 | 5.01e-01 | 0.0811 |
| 8702 | B4GALT4 | LZE5T | Human | Esophagus | ESCC | 4.17e-05 | 7.52e-01 | 0.0514 |
| 8702 | B4GALT4 | LZE7T | Human | Esophagus | ESCC | 4.82e-11 | 8.12e-01 | 0.0667 |
| 8702 | B4GALT4 | LZE8T | Human | Esophagus | ESCC | 1.52e-10 | 5.14e-01 | 0.067 |
| 8702 | B4GALT4 | LZE20T | Human | Esophagus | ESCC | 1.29e-10 | 4.54e-01 | 0.0662 |
| 8702 | B4GALT4 | LZE22D1 | Human | Esophagus | HGIN | 3.01e-02 | 2.11e-01 | 0.0595 |
| 8702 | B4GALT4 | LZE22T | Human | Esophagus | ESCC | 1.20e-12 | 6.92e-01 | 0.068 |
| 8702 | B4GALT4 | LZE24T | Human | Esophagus | ESCC | 3.32e-41 | 1.25e+00 | 0.0596 |
| 8702 | B4GALT4 | LZE21T | Human | Esophagus | ESCC | 5.09e-04 | 3.84e-01 | 0.0655 |
| 8702 | B4GALT4 | P1T-E | Human | Esophagus | ESCC | 4.10e-09 | 8.41e-01 | 0.0875 |
| 8702 | B4GALT4 | P2T-E | Human | Esophagus | ESCC | 3.54e-20 | 2.96e-01 | 0.1177 |
| 8702 | B4GALT4 | P4T-E | Human | Esophagus | ESCC | 8.10e-18 | 4.89e-01 | 0.1323 |
| 8702 | B4GALT4 | P5T-E | Human | Esophagus | ESCC | 5.56e-12 | 2.51e-01 | 0.1327 |
| 8702 | B4GALT4 | P8T-E | Human | Esophagus | ESCC | 8.47e-72 | 1.79e+00 | 0.0889 |
| Page: 1 2 3 4 5 6 |
| Tissue | Expression Dynamics | Abbreviation |
| Cervix |  | CC: Cervix cancer |
| HSIL_HPV: HPV-infected high-grade squamous intraepithelial lesions | ||
| N_HPV: HPV-infected normal cervix | ||
| Esophagus | 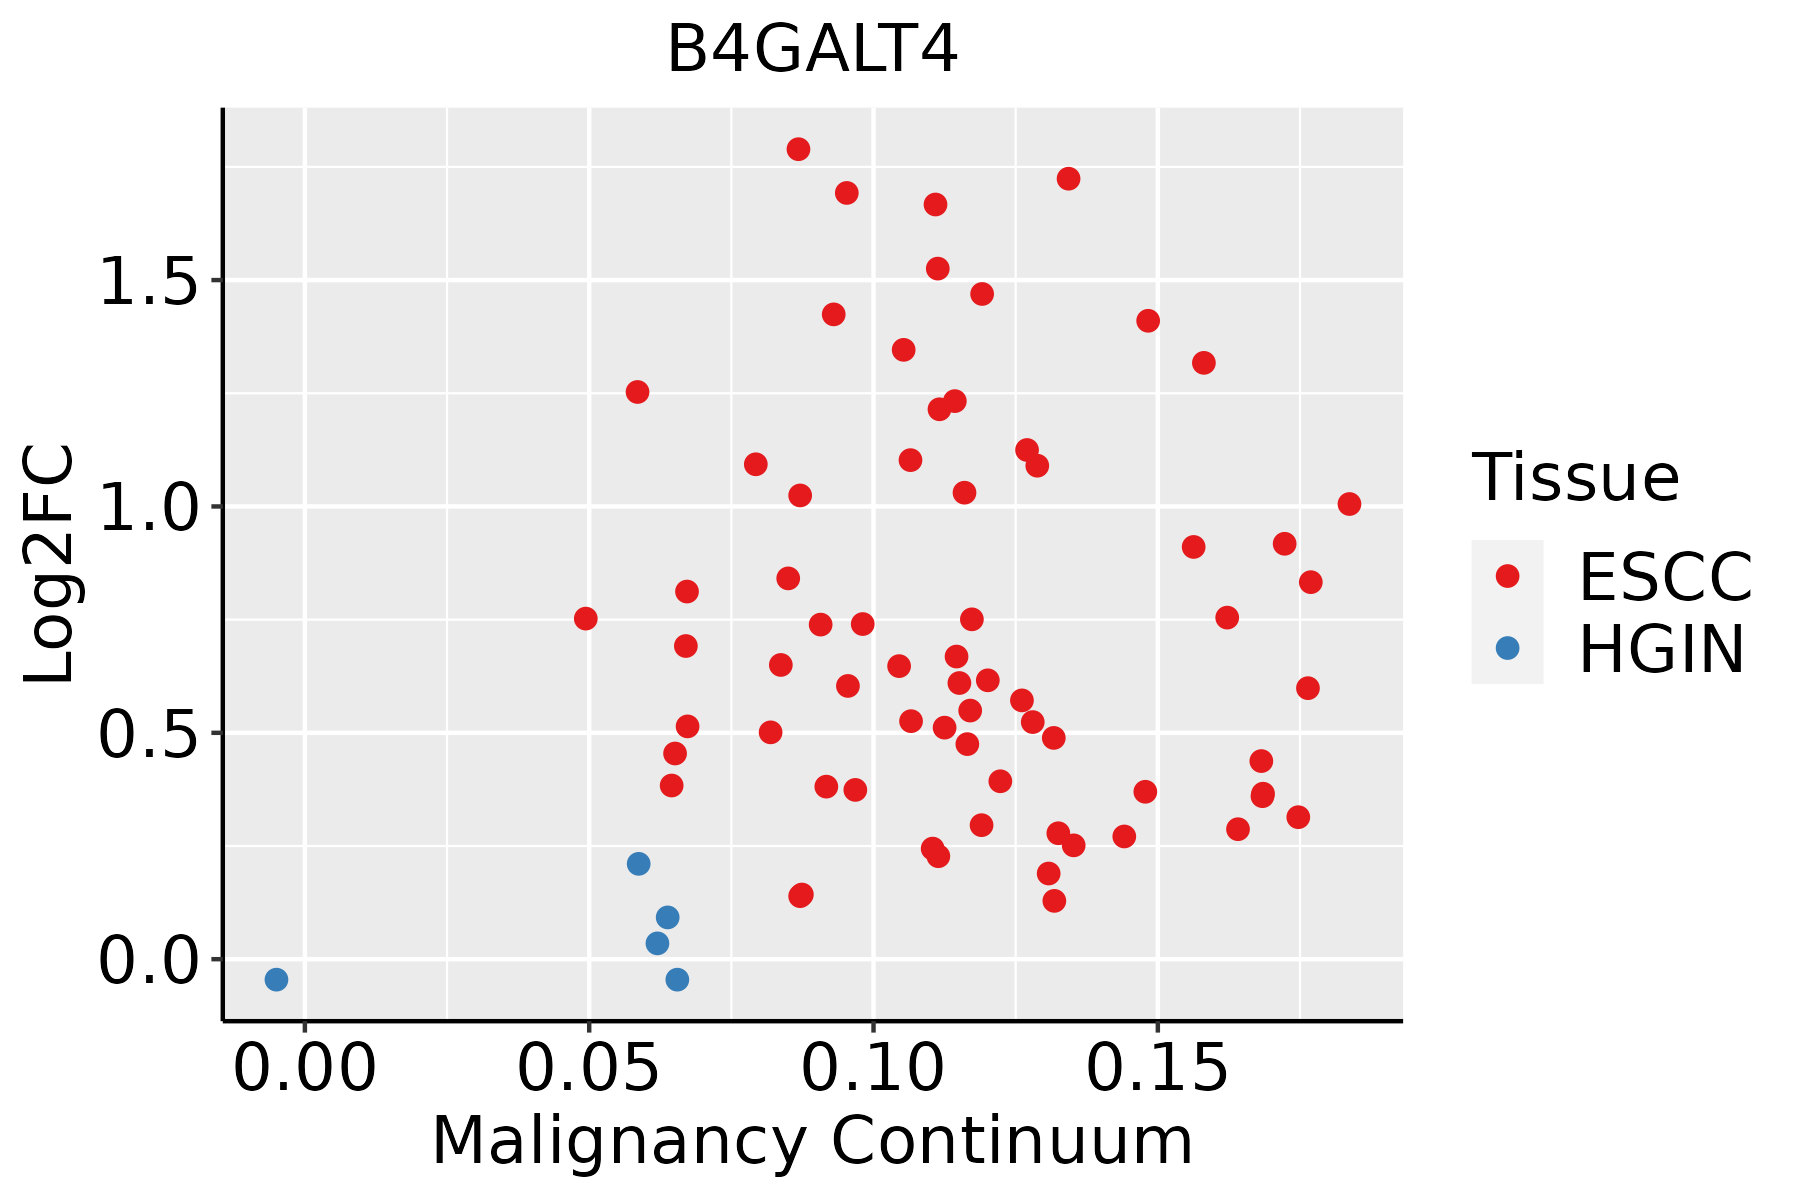 | ESCC: Esophageal squamous cell carcinoma |
| HGIN: High-grade intraepithelial neoplasias | ||
| LGIN: Low-grade intraepithelial neoplasias | ||
| Oral Cavity |  | EOLP: Erosive Oral lichen planus |
| LP: leukoplakia | ||
| NEOLP: Non-erosive oral lichen planus | ||
| OSCC: Oral squamous cell carcinoma | ||
| Thyroid |  | ATC: Anaplastic thyroid cancer |
| HT: Hashimoto's thyroiditis | ||
| PTC: Papillary thyroid cancer |
| ∗log2FC in expression of this searched gene in stem-like cells from each diseased tissue sample relative to stem-like cells in normal samples in each tissue plotted against the malignancy continuum. Samples are colored based on if they are from different disease stage. |
Top |
Malignant transformation related pathway analysis |
| Find out the enriched GO biological processes and KEGG pathways involved in transition from healthy to precancer to cancer |
| Tissue | Disease Stage | Enriched GO biological Processes |
| Colorectum | AD |  |
| Colorectum | SER |  |
| Colorectum | MSS |  |
| Colorectum | MSI-H |  |
| Colorectum | FAP |  |
| ∗Top 15 enriched GO BP terms are showed in the bar plot of each disease state in each tissue. Each row represents a significant GO biological process which is colored according to the -log10(p.adjust). |
| Page: 1 2 3 4 5 6 7 8 9 |
| GO ID | Tissue | Disease Stage | Description | Gene Ratio | Bg Ratio | pvalue | p.adjust | Count |
| GO:00066433 | Esophagus | ESCC | membrane lipid metabolic process | 130/8552 | 203/18723 | 9.29e-08 | 1.54e-06 | 130 |
| GO:00091002 | Esophagus | ESCC | glycoprotein metabolic process | 226/8552 | 387/18723 | 2.64e-07 | 3.94e-06 | 226 |
| GO:00700854 | Esophagus | ESCC | glycosylation | 144/8552 | 240/18723 | 5.12e-06 | 5.38e-05 | 144 |
| GO:00064865 | Esophagus | ESCC | protein glycosylation | 135/8552 | 226/18723 | 1.36e-05 | 1.24e-04 | 135 |
| GO:00434135 | Esophagus | ESCC | macromolecule glycosylation | 135/8552 | 226/18723 | 1.36e-05 | 1.24e-04 | 135 |
| GO:00091012 | Esophagus | ESCC | glycoprotein biosynthetic process | 181/8552 | 317/18723 | 2.54e-05 | 2.15e-04 | 181 |
| GO:00066432 | Oral cavity | OSCC | membrane lipid metabolic process | 111/7305 | 203/18723 | 4.02e-06 | 4.69e-05 | 111 |
| GO:00091001 | Oral cavity | OSCC | glycoprotein metabolic process | 185/7305 | 387/18723 | 2.37e-04 | 1.54e-03 | 185 |
| GO:00091011 | Oral cavity | OSCC | glycoprotein biosynthetic process | 151/7305 | 317/18723 | 1.01e-03 | 5.26e-03 | 151 |
| GO:00064864 | Oral cavity | OSCC | protein glycosylation | 111/7305 | 226/18723 | 1.22e-03 | 6.10e-03 | 111 |
| GO:00434134 | Oral cavity | OSCC | macromolecule glycosylation | 111/7305 | 226/18723 | 1.22e-03 | 6.10e-03 | 111 |
| GO:00700853 | Oral cavity | OSCC | glycosylation | 117/7305 | 240/18723 | 1.29e-03 | 6.42e-03 | 117 |
| GO:000664311 | Oral cavity | LP | membrane lipid metabolic process | 69/4623 | 203/18723 | 1.77e-03 | 1.34e-02 | 69 |
| GO:007008511 | Oral cavity | LP | glycosylation | 77/4623 | 240/18723 | 5.60e-03 | 3.38e-02 | 77 |
| GO:000648611 | Oral cavity | LP | protein glycosylation | 73/4623 | 226/18723 | 5.72e-03 | 3.44e-02 | 73 |
| GO:004341311 | Oral cavity | LP | macromolecule glycosylation | 73/4623 | 226/18723 | 5.72e-03 | 3.44e-02 | 73 |
| GO:00064866 | Thyroid | PTC | protein glycosylation | 94/5968 | 226/18723 | 1.25e-03 | 7.13e-03 | 94 |
| GO:00434136 | Thyroid | PTC | macromolecule glycosylation | 94/5968 | 226/18723 | 1.25e-03 | 7.13e-03 | 94 |
| GO:00700855 | Thyroid | PTC | glycosylation | 96/5968 | 240/18723 | 4.57e-03 | 2.15e-02 | 96 |
| GO:00091013 | Thyroid | PTC | glycoprotein biosynthetic process | 123/5968 | 317/18723 | 5.05e-03 | 2.33e-02 | 123 |
| Page: 1 2 |
| Pathway ID | Tissue | Disease Stage | Description | Gene Ratio | Bg Ratio | pvalue | p.adjust | qvalue | Count |
| Page: 1 |
Top |
Cell-cell communication analysis |
| Identification of potential cell-cell interactions between two cell types and their ligand-receptor pairs for different disease states |
| Ligand | Receptor | LRpair | Pathway | Tissue | Disease Stage |
| Page: 1 |
Top |
Single-cell gene regulatory network inference analysis |
| Find out the significant the regulons (TFs) and the target genes of each regulon across cell types for different disease states |
| TF | Cell Type | Tissue | Disease Stage | Target Gene | RSS | Regulon Activity |
| ∗The dot plots of a searched regulon are shown for all cell subpopulations in each disease state of each tissue based on the regulon specific score inferred using pySCENIC and by calculating the average expression. |
| Page: 1 |
Top |
Somatic mutation of malignant transformation related genes |
| Annotation of somatic variants for genes involved in malignant transformation |
| Hugo Symbol | Variant Class | Variant Classification | dbSNP RS | HGVSc | HGVSp | HGVSp Short | SWISSPROT | BIOTYPE | SIFT | PolyPhen | Tumor Sample Barcode | Tissue | Histology | Sex | Age | Stage | Therapy Types | Drugs | Outcome |
| B4GALT4 | SNV | Missense_Mutation | c.634N>T | p.Pro212Ser | p.P212S | O60513 | protein_coding | deleterious(0) | probably_damaging(0.997) | TCGA-A8-A09X-01 | Breast | breast invasive carcinoma | Female | <65 | III/IV | Unknown | Unknown | SD | |
| B4GALT4 | SNV | Missense_Mutation | novel | c.749N>G | p.Ser250Cys | p.S250C | O60513 | protein_coding | deleterious(0) | probably_damaging(0.989) | TCGA-BH-A0B6-01 | Breast | breast invasive carcinoma | Female | <65 | I/II | Unknown | Unknown | SD |
| B4GALT4 | SNV | Missense_Mutation | rs781600054 | c.895G>A | p.Ala299Thr | p.A299T | O60513 | protein_coding | tolerated(0.06) | benign(0) | TCGA-2W-A8YY-01 | Cervix | cervical & endocervical cancer | Female | <65 | I/II | Chemotherapy | cisplatin | CR |
| B4GALT4 | SNV | Missense_Mutation | c.943G>A | p.Asp315Asn | p.D315N | O60513 | protein_coding | deleterious(0) | probably_damaging(0.998) | TCGA-EK-A2IP-01 | Cervix | cervical & endocervical cancer | Female | <65 | I/II | Unknown | Unknown | SD | |
| B4GALT4 | SNV | Missense_Mutation | novel | c.730N>C | p.Phe244Leu | p.F244L | O60513 | protein_coding | tolerated(1) | benign(0.003) | TCGA-5M-AAT4-01 | Colorectum | colon adenocarcinoma | Male | >=65 | III/IV | Unknown | Unknown | PD |
| B4GALT4 | SNV | Missense_Mutation | novel | c.728N>G | p.Phe243Cys | p.F243C | O60513 | protein_coding | deleterious(0) | probably_damaging(0.999) | TCGA-5M-AAT4-01 | Colorectum | colon adenocarcinoma | Male | >=65 | III/IV | Unknown | Unknown | PD |
| B4GALT4 | SNV | Missense_Mutation | c.401N>G | p.Glu134Gly | p.E134G | O60513 | protein_coding | deleterious(0) | probably_damaging(0.993) | TCGA-AA-3502-01 | Colorectum | colon adenocarcinoma | Male | >=65 | I/II | Unknown | Unknown | SD | |
| B4GALT4 | SNV | Missense_Mutation | c.464A>G | p.Tyr155Cys | p.Y155C | O60513 | protein_coding | deleterious(0) | probably_damaging(1) | TCGA-AA-3815-01 | Colorectum | colon adenocarcinoma | Female | >=65 | I/II | Unknown | Unknown | SD | |
| B4GALT4 | SNV | Missense_Mutation | c.325N>C | p.Ser109Pro | p.S109P | O60513 | protein_coding | tolerated(0.3) | benign(0.006) | TCGA-AD-5900-01 | Colorectum | colon adenocarcinoma | Male | >=65 | I/II | Unknown | Unknown | SD | |
| B4GALT4 | SNV | Missense_Mutation | novel | c.310N>A | p.Glu104Lys | p.E104K | O60513 | protein_coding | tolerated(0.54) | benign(0.011) | TCGA-CA-6717-01 | Colorectum | colon adenocarcinoma | Male | <65 | I/II | Chemotherapy | oxaliplatin | CR |
| Page: 1 2 3 4 5 |
Top |
Related drugs of malignant transformation related genes |
| Identification of chemicals and drugs interact with genes involved in malignant transfromation |
| (DGIdb 4.0) |
| Entrez ID | Symbol | Category | Interaction Types | Drug Claim Name | Drug Name | PMIDs |
| Page: 1 |

Copyright 2023-Present -The University of Texas Health Science Center at Houston |