
|
|||||
|
 | |
| |
| |
| |
| |
| |
|
Gene: B4GALT3 |
Gene summary for B4GALT3 |
| Gene information | Species | Human | Gene symbol | B4GALT3 | Gene ID | 8703 |
| Gene name | beta-1,4-galactosyltransferase 3 | |
| Gene Alias | beta4Gal-T3 | |
| Cytomap | 1q23.3 | |
| Gene Type | protein-coding | GO ID | GO:0005975 | UniProtAcc | A8K5Z0 |
Top |
Malignant transformation analysis |
| Identification of the aberrant gene expression in precancerous and cancerous lesions by comparing the gene expression of stem-like cells in diseased tissues with normal stem cells |
| Entrez ID | Symbol | Replicates | Species | Organ | Tissue | Adj P-value | Log2FC | Malignancy |
| 8703 | B4GALT3 | LZE4T | Human | Esophagus | ESCC | 5.07e-14 | 3.66e-01 | 0.0811 |
| 8703 | B4GALT3 | LZE7T | Human | Esophagus | ESCC | 7.91e-07 | 5.96e-01 | 0.0667 |
| 8703 | B4GALT3 | LZE8T | Human | Esophagus | ESCC | 4.07e-04 | 2.06e-01 | 0.067 |
| 8703 | B4GALT3 | LZE20T | Human | Esophagus | ESCC | 9.72e-05 | 1.61e-01 | 0.0662 |
| 8703 | B4GALT3 | LZE22T | Human | Esophagus | ESCC | 4.03e-05 | 3.49e-01 | 0.068 |
| 8703 | B4GALT3 | LZE24T | Human | Esophagus | ESCC | 1.85e-13 | 4.41e-01 | 0.0596 |
| 8703 | B4GALT3 | LZE6T | Human | Esophagus | ESCC | 1.73e-03 | 3.50e-01 | 0.0845 |
| 8703 | B4GALT3 | P1T-E | Human | Esophagus | ESCC | 1.33e-03 | 3.07e-01 | 0.0875 |
| 8703 | B4GALT3 | P2T-E | Human | Esophagus | ESCC | 5.18e-49 | 7.04e-01 | 0.1177 |
| 8703 | B4GALT3 | P4T-E | Human | Esophagus | ESCC | 3.16e-42 | 1.06e+00 | 0.1323 |
| 8703 | B4GALT3 | P5T-E | Human | Esophagus | ESCC | 2.79e-19 | 3.97e-01 | 0.1327 |
| 8703 | B4GALT3 | P8T-E | Human | Esophagus | ESCC | 3.82e-25 | 3.32e-01 | 0.0889 |
| 8703 | B4GALT3 | P9T-E | Human | Esophagus | ESCC | 3.83e-18 | 5.84e-01 | 0.1131 |
| 8703 | B4GALT3 | P10T-E | Human | Esophagus | ESCC | 1.01e-30 | 3.94e-01 | 0.116 |
| 8703 | B4GALT3 | P11T-E | Human | Esophagus | ESCC | 3.13e-13 | 7.43e-01 | 0.1426 |
| 8703 | B4GALT3 | P12T-E | Human | Esophagus | ESCC | 1.84e-22 | 3.32e-01 | 0.1122 |
| 8703 | B4GALT3 | P15T-E | Human | Esophagus | ESCC | 1.00e-31 | 7.90e-01 | 0.1149 |
| 8703 | B4GALT3 | P16T-E | Human | Esophagus | ESCC | 7.09e-38 | 8.00e-01 | 0.1153 |
| 8703 | B4GALT3 | P17T-E | Human | Esophagus | ESCC | 1.79e-06 | 3.55e-01 | 0.1278 |
| 8703 | B4GALT3 | P19T-E | Human | Esophagus | ESCC | 2.26e-07 | 7.99e-01 | 0.1662 |
| Page: 1 2 3 4 5 |
| Tissue | Expression Dynamics | Abbreviation |
| Esophagus | 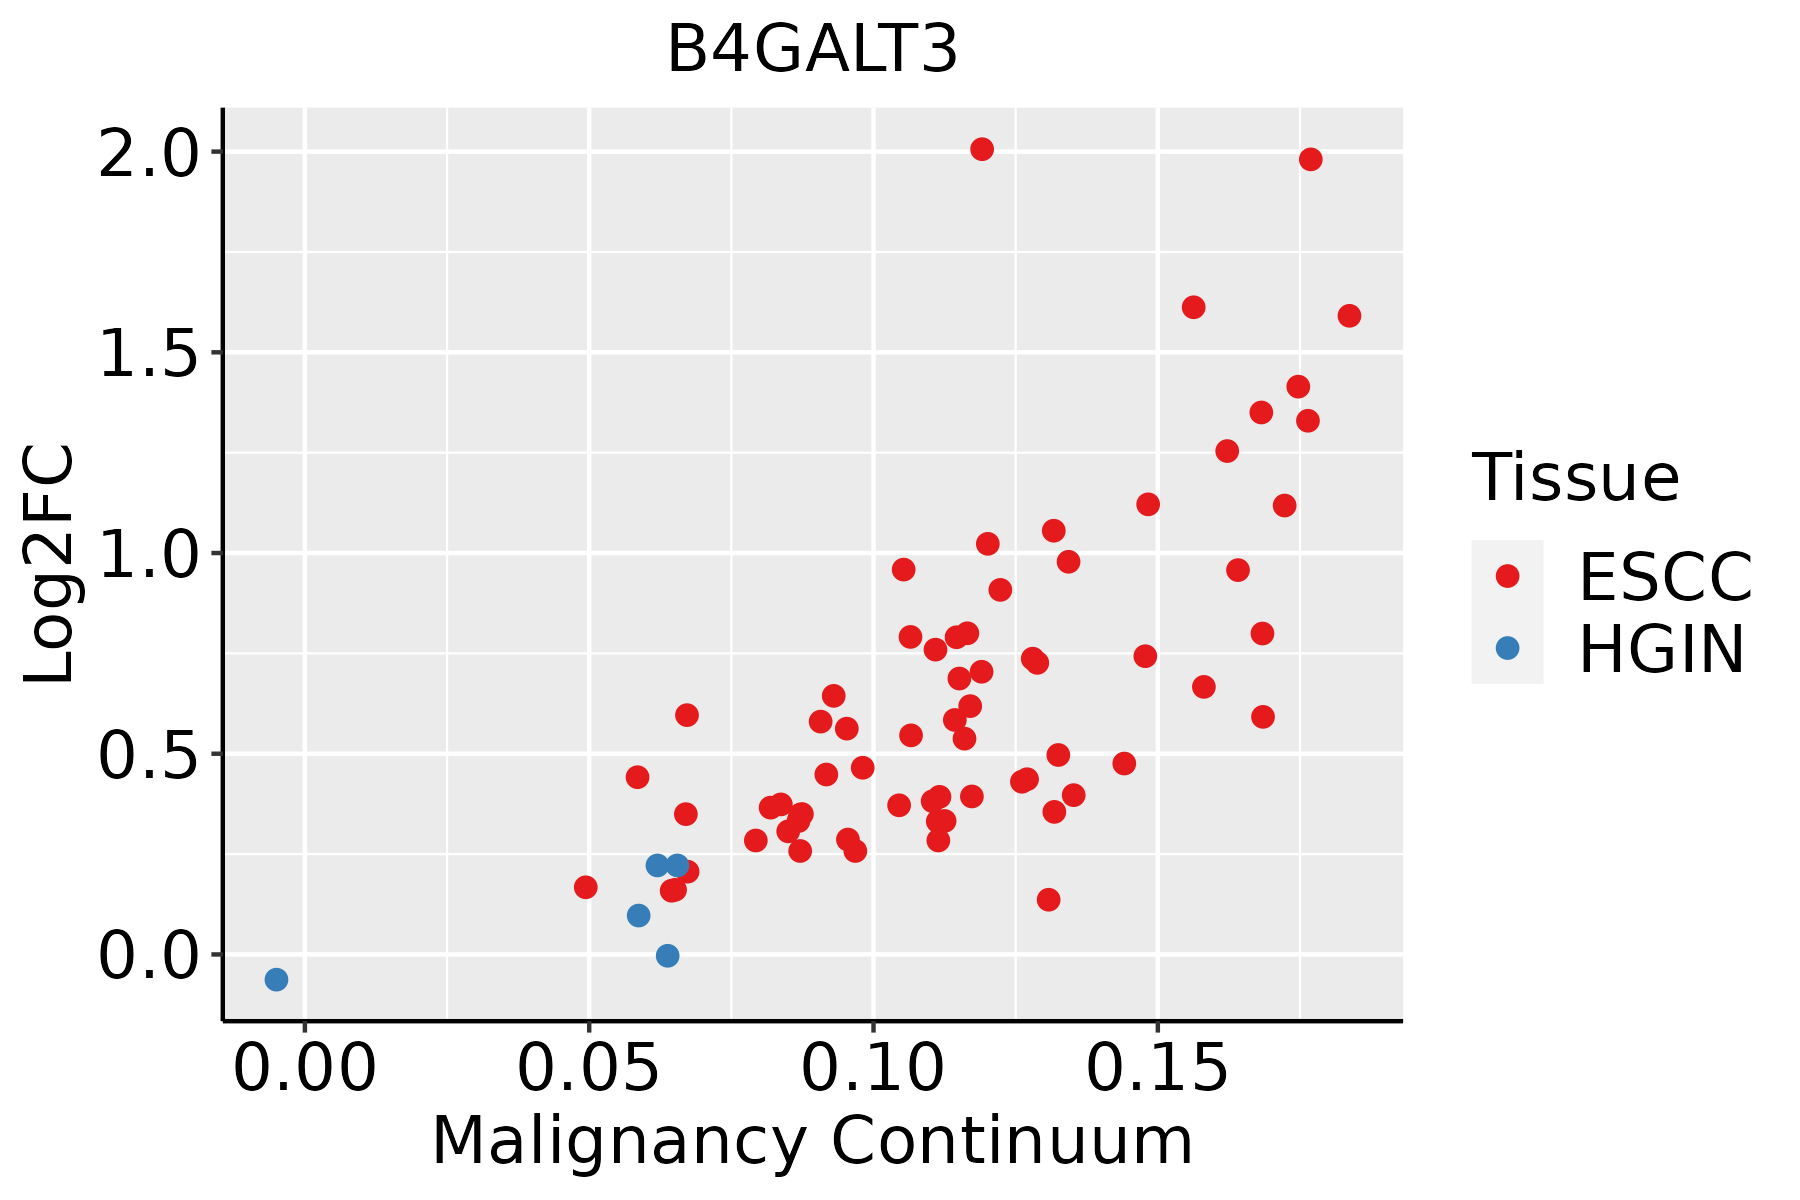 | ESCC: Esophageal squamous cell carcinoma |
| HGIN: High-grade intraepithelial neoplasias | ||
| LGIN: Low-grade intraepithelial neoplasias | ||
| Liver |  | HCC: Hepatocellular carcinoma |
| NAFLD: Non-alcoholic fatty liver disease | ||
| Oral Cavity | 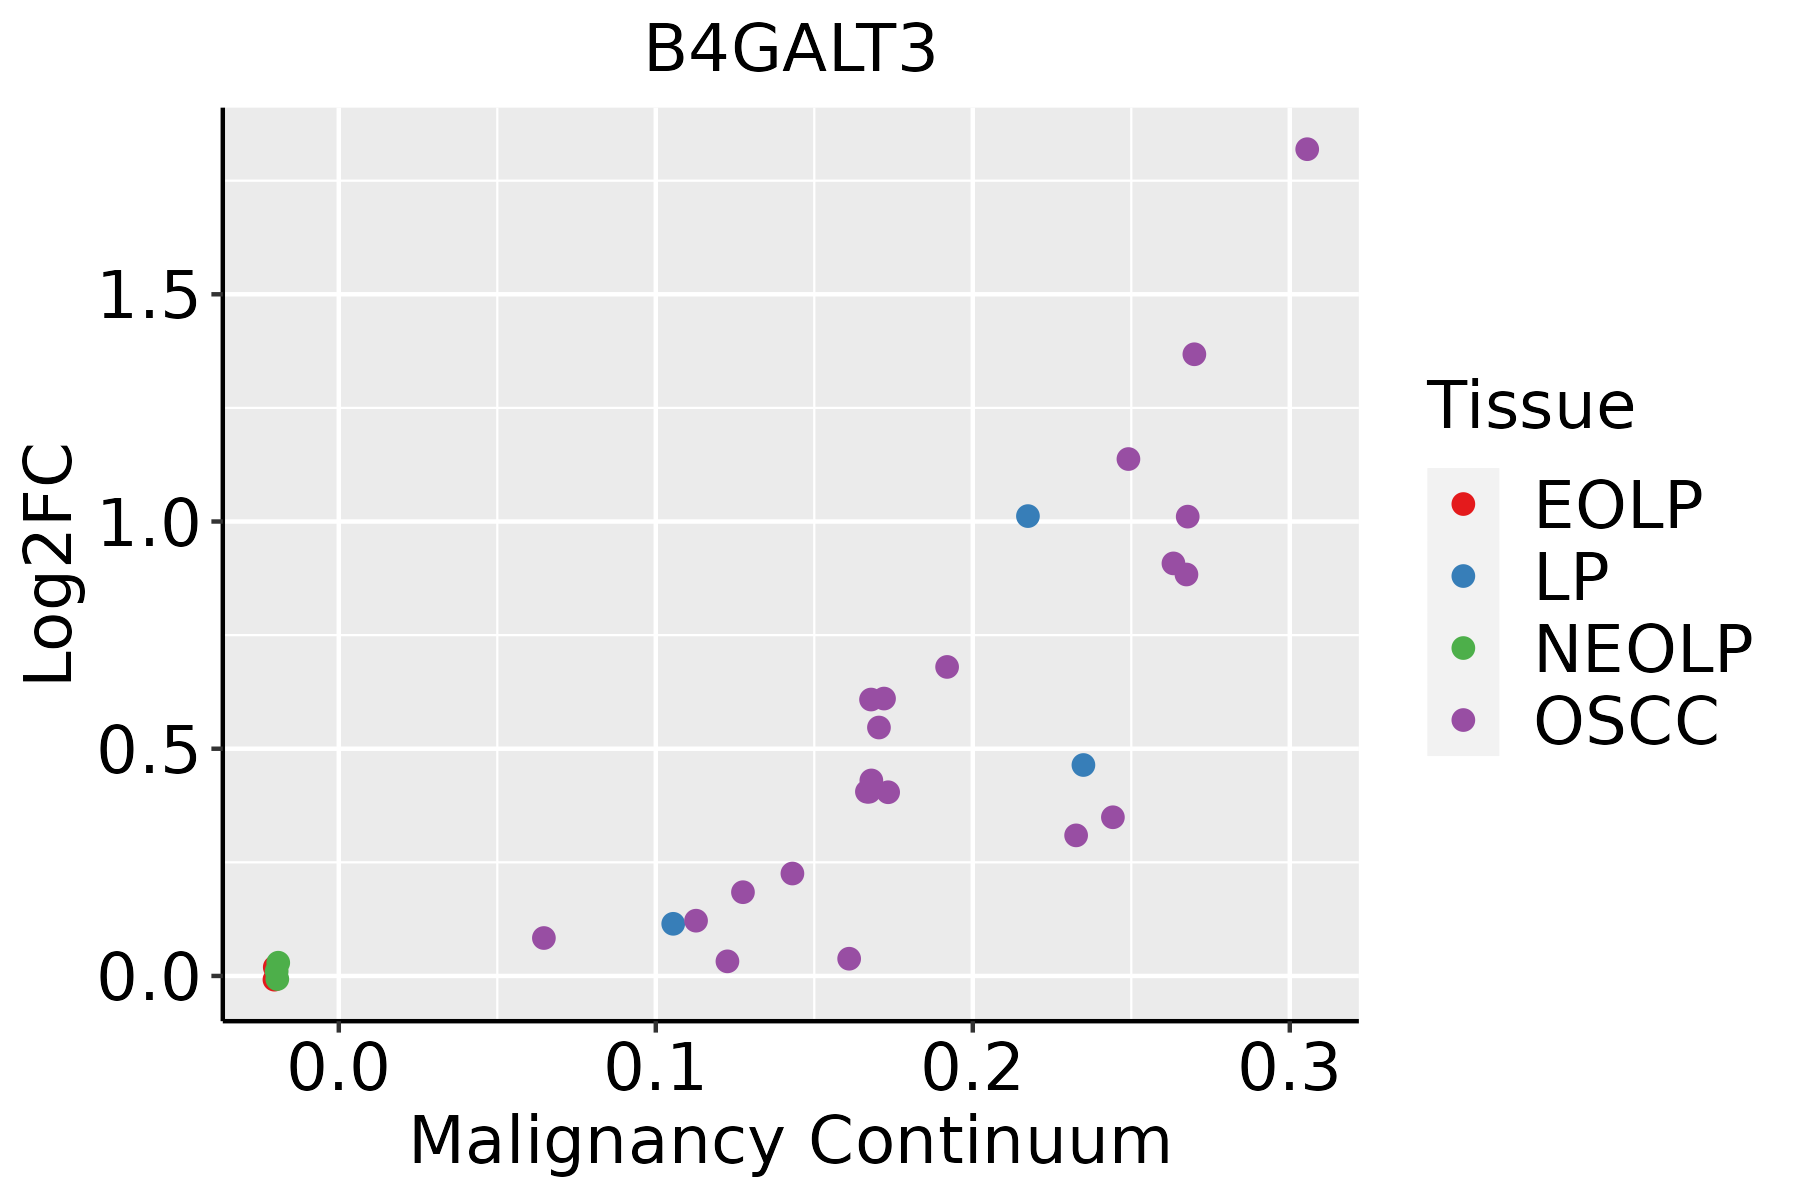 | EOLP: Erosive Oral lichen planus |
| LP: leukoplakia | ||
| NEOLP: Non-erosive oral lichen planus | ||
| OSCC: Oral squamous cell carcinoma | ||
| Skin |  | AK: Actinic keratosis |
| cSCC: Cutaneous squamous cell carcinoma | ||
| SCCIS:squamous cell carcinoma in situ |
| ∗log2FC in expression of this searched gene in stem-like cells from each diseased tissue sample relative to stem-like cells in normal samples in each tissue plotted against the malignancy continuum. Samples are colored based on if they are from different disease stage. |
Top |
Malignant transformation related pathway analysis |
| Find out the enriched GO biological processes and KEGG pathways involved in transition from healthy to precancer to cancer |
| Tissue | Disease Stage | Enriched GO biological Processes |
| Colorectum | AD |  |
| Colorectum | SER |  |
| Colorectum | MSS |  |
| Colorectum | MSI-H |  |
| Colorectum | FAP |  |
| ∗Top 15 enriched GO BP terms are showed in the bar plot of each disease state in each tissue. Each row represents a significant GO biological process which is colored according to the -log10(p.adjust). |
| Page: 1 2 3 4 5 6 7 8 9 |
| GO ID | Tissue | Disease Stage | Description | Gene Ratio | Bg Ratio | pvalue | p.adjust | Count |
| GO:00066433 | Esophagus | ESCC | membrane lipid metabolic process | 130/8552 | 203/18723 | 9.29e-08 | 1.54e-06 | 130 |
| GO:00091002 | Esophagus | ESCC | glycoprotein metabolic process | 226/8552 | 387/18723 | 2.64e-07 | 3.94e-06 | 226 |
| GO:00700854 | Esophagus | ESCC | glycosylation | 144/8552 | 240/18723 | 5.12e-06 | 5.38e-05 | 144 |
| GO:00464673 | Esophagus | ESCC | membrane lipid biosynthetic process | 91/8552 | 142/18723 | 7.19e-06 | 7.19e-05 | 91 |
| GO:00064865 | Esophagus | ESCC | protein glycosylation | 135/8552 | 226/18723 | 1.36e-05 | 1.24e-04 | 135 |
| GO:00434135 | Esophagus | ESCC | macromolecule glycosylation | 135/8552 | 226/18723 | 1.36e-05 | 1.24e-04 | 135 |
| GO:00091012 | Esophagus | ESCC | glycoprotein biosynthetic process | 181/8552 | 317/18723 | 2.54e-05 | 2.15e-04 | 181 |
| GO:00066652 | Esophagus | ESCC | sphingolipid metabolic process | 96/8552 | 155/18723 | 3.21e-05 | 2.66e-04 | 96 |
| GO:00066642 | Esophagus | ESCC | glycolipid metabolic process | 63/8552 | 100/18723 | 3.55e-04 | 2.06e-03 | 63 |
| GO:19035092 | Esophagus | ESCC | liposaccharide metabolic process | 63/8552 | 101/18723 | 5.25e-04 | 2.90e-03 | 63 |
| GO:00301481 | Esophagus | ESCC | sphingolipid biosynthetic process | 62/8552 | 103/18723 | 2.10e-03 | 9.38e-03 | 62 |
| GO:00066721 | Esophagus | ESCC | ceramide metabolic process | 61/8552 | 102/18723 | 2.82e-03 | 1.19e-02 | 61 |
| GO:0009247 | Esophagus | ESCC | glycolipid biosynthetic process | 42/8552 | 68/18723 | 5.48e-03 | 2.05e-02 | 42 |
| GO:0046513 | Esophagus | ESCC | ceramide biosynthetic process | 40/8552 | 65/18723 | 7.25e-03 | 2.63e-02 | 40 |
| GO:0006643 | Liver | Cirrhotic | membrane lipid metabolic process | 69/4634 | 203/18723 | 1.89e-03 | 1.19e-02 | 69 |
| GO:00066431 | Liver | HCC | membrane lipid metabolic process | 115/7958 | 203/18723 | 3.17e-05 | 3.22e-04 | 115 |
| GO:00064862 | Liver | HCC | protein glycosylation | 122/7958 | 226/18723 | 3.11e-04 | 2.21e-03 | 122 |
| GO:00434132 | Liver | HCC | macromolecule glycosylation | 122/7958 | 226/18723 | 3.11e-04 | 2.21e-03 | 122 |
| GO:00700852 | Liver | HCC | glycosylation | 128/7958 | 240/18723 | 4.35e-04 | 2.92e-03 | 128 |
| GO:0006665 | Liver | HCC | sphingolipid metabolic process | 85/7958 | 155/18723 | 1.27e-03 | 6.92e-03 | 85 |
| Page: 1 2 3 |
| Pathway ID | Tissue | Disease Stage | Description | Gene Ratio | Bg Ratio | pvalue | p.adjust | qvalue | Count |
| hsa0051023 | Esophagus | ESCC | N-Glycan biosynthesis | 39/4205 | 53/8465 | 3.26e-04 | 1.15e-03 | 5.89e-04 | 39 |
| hsa005136 | Esophagus | ESCC | Various types of N-glycan biosynthesis | 31/4205 | 42/8465 | 1.23e-03 | 3.78e-03 | 1.93e-03 | 31 |
| hsa0051033 | Esophagus | ESCC | N-Glycan biosynthesis | 39/4205 | 53/8465 | 3.26e-04 | 1.15e-03 | 5.89e-04 | 39 |
| hsa0051313 | Esophagus | ESCC | Various types of N-glycan biosynthesis | 31/4205 | 42/8465 | 1.23e-03 | 3.78e-03 | 1.93e-03 | 31 |
| hsa005104 | Liver | Cirrhotic | N-Glycan biosynthesis | 32/2530 | 53/8465 | 3.82e-06 | 4.10e-05 | 2.53e-05 | 32 |
| hsa005134 | Liver | Cirrhotic | Various types of N-glycan biosynthesis | 26/2530 | 42/8465 | 1.65e-05 | 1.41e-04 | 8.69e-05 | 26 |
| hsa0051011 | Liver | Cirrhotic | N-Glycan biosynthesis | 32/2530 | 53/8465 | 3.82e-06 | 4.10e-05 | 2.53e-05 | 32 |
| hsa0051311 | Liver | Cirrhotic | Various types of N-glycan biosynthesis | 26/2530 | 42/8465 | 1.65e-05 | 1.41e-04 | 8.69e-05 | 26 |
| hsa0051021 | Liver | HCC | N-Glycan biosynthesis | 40/4020 | 53/8465 | 2.95e-05 | 1.87e-04 | 1.04e-04 | 40 |
| hsa005132 | Liver | HCC | Various types of N-glycan biosynthesis | 30/4020 | 42/8465 | 1.41e-03 | 5.07e-03 | 2.82e-03 | 30 |
| hsa0051031 | Liver | HCC | N-Glycan biosynthesis | 40/4020 | 53/8465 | 2.95e-05 | 1.87e-04 | 1.04e-04 | 40 |
| hsa005133 | Liver | HCC | Various types of N-glycan biosynthesis | 30/4020 | 42/8465 | 1.41e-03 | 5.07e-03 | 2.82e-03 | 30 |
| hsa005105 | Oral cavity | OSCC | N-Glycan biosynthesis | 39/3704 | 53/8465 | 9.77e-06 | 4.36e-05 | 2.22e-05 | 39 |
| hsa005135 | Oral cavity | OSCC | Various types of N-glycan biosynthesis | 29/3704 | 42/8465 | 8.03e-04 | 2.32e-03 | 1.18e-03 | 29 |
| hsa0051012 | Oral cavity | OSCC | N-Glycan biosynthesis | 39/3704 | 53/8465 | 9.77e-06 | 4.36e-05 | 2.22e-05 | 39 |
| hsa0051312 | Oral cavity | OSCC | Various types of N-glycan biosynthesis | 29/3704 | 42/8465 | 8.03e-04 | 2.32e-03 | 1.18e-03 | 29 |
| hsa0051022 | Oral cavity | LP | N-Glycan biosynthesis | 31/2418 | 53/8465 | 4.86e-06 | 4.14e-05 | 2.67e-05 | 31 |
| hsa0051321 | Oral cavity | LP | Various types of N-glycan biosynthesis | 22/2418 | 42/8465 | 9.58e-04 | 4.49e-03 | 2.90e-03 | 22 |
| hsa0051032 | Oral cavity | LP | N-Glycan biosynthesis | 31/2418 | 53/8465 | 4.86e-06 | 4.14e-05 | 2.67e-05 | 31 |
| hsa0051331 | Oral cavity | LP | Various types of N-glycan biosynthesis | 22/2418 | 42/8465 | 9.58e-04 | 4.49e-03 | 2.90e-03 | 22 |
| Page: 1 |
Top |
Cell-cell communication analysis |
| Identification of potential cell-cell interactions between two cell types and their ligand-receptor pairs for different disease states |
| Ligand | Receptor | LRpair | Pathway | Tissue | Disease Stage |
| Page: 1 |
Top |
Single-cell gene regulatory network inference analysis |
| Find out the significant the regulons (TFs) and the target genes of each regulon across cell types for different disease states |
| TF | Cell Type | Tissue | Disease Stage | Target Gene | RSS | Regulon Activity |
| ∗The dot plots of a searched regulon are shown for all cell subpopulations in each disease state of each tissue based on the regulon specific score inferred using pySCENIC and by calculating the average expression. |
| Page: 1 |
Top |
Somatic mutation of malignant transformation related genes |
| Annotation of somatic variants for genes involved in malignant transformation |
| Hugo Symbol | Variant Class | Variant Classification | dbSNP RS | HGVSc | HGVSp | HGVSp Short | SWISSPROT | BIOTYPE | SIFT | PolyPhen | Tumor Sample Barcode | Tissue | Histology | Sex | Age | Stage | Therapy Types | Drugs | Outcome |
| B4GALT3 | SNV | Missense_Mutation | novel | c.776G>A | p.Gly259Asp | p.G259D | O60512 | protein_coding | deleterious(0.03) | possibly_damaging(0.86) | TCGA-AC-A2BM-01 | Breast | breast invasive carcinoma | Female | <65 | I/II | Unknown | Unknown | SD |
| B4GALT3 | SNV | Missense_Mutation | rs745448974 | c.95G>A | p.Arg32Gln | p.R32Q | O60512 | protein_coding | tolerated(0.15) | benign(0.007) | TCGA-AN-A046-01 | Breast | breast invasive carcinoma | Female | >=65 | I/II | Unknown | Unknown | SD |
| B4GALT3 | SNV | Missense_Mutation | novel | c.350C>A | p.Ala117Glu | p.A117E | O60512 | protein_coding | deleterious(0.04) | benign(0.007) | TCGA-AR-A24P-01 | Breast | breast invasive carcinoma | Female | <65 | I/II | Unknown | Unknown | SD |
| B4GALT3 | insertion | Frame_Shift_Ins | novel | c.373_374insA | p.Thr125AsnfsTer46 | p.T125Nfs*46 | O60512 | protein_coding | TCGA-A8-A08F-01 | Breast | breast invasive carcinoma | Female | <65 | III/IV | Chemotherapy | 5-fluorouracil | CR | ||
| B4GALT3 | insertion | Frame_Shift_Ins | novel | c.222_223insAACT | p.Pro75AsnfsTer20 | p.P75Nfs*20 | O60512 | protein_coding | TCGA-AO-A0JB-01 | Breast | breast invasive carcinoma | Female | <65 | III/IV | Chemotherapy | cyclophosphamide | SD | ||
| B4GALT3 | SNV | Missense_Mutation | c.830N>T | p.Ser277Phe | p.S277F | O60512 | protein_coding | tolerated(0.1) | benign(0.265) | TCGA-DR-A0ZM-01 | Cervix | cervical & endocervical cancer | Female | <65 | III/IV | Unspecific | Cisplatin | SD | |
| B4GALT3 | SNV | Missense_Mutation | rs756962425 | c.539N>A | p.Arg180Gln | p.R180Q | O60512 | protein_coding | tolerated(0.3) | possibly_damaging(0.781) | TCGA-VS-A8EL-01 | Cervix | cervical & endocervical cancer | Female | <65 | I/II | Chemotherapy | cisplatin | CR |
| B4GALT3 | insertion | Nonsense_Mutation | novel | c.297_298insTGAGGTG | p.Glu100Ter | p.E100* | O60512 | protein_coding | TCGA-DS-A1OC-01 | Cervix | cervical & endocervical cancer | Female | <65 | I/II | Chemotherapy | gemcitabine | SD | ||
| B4GALT3 | SNV | Missense_Mutation | c.457N>A | p.Gln153Lys | p.Q153K | O60512 | protein_coding | tolerated(0.14) | probably_damaging(1) | TCGA-AA-3814-01 | Colorectum | colon adenocarcinoma | Female | >=65 | I/II | Unknown | Unknown | SD | |
| B4GALT3 | SNV | Missense_Mutation | rs748981503 | c.635N>A | p.Arg212Gln | p.R212Q | O60512 | protein_coding | tolerated(1) | benign(0) | TCGA-AA-3877-01 | Colorectum | colon adenocarcinoma | Female | >=65 | I/II | Unknown | Unknown | SD |
| Page: 1 2 3 4 5 6 |
Top |
Related drugs of malignant transformation related genes |
| Identification of chemicals and drugs interact with genes involved in malignant transfromation |
| (DGIdb 4.0) |
| Entrez ID | Symbol | Category | Interaction Types | Drug Claim Name | Drug Name | PMIDs |
| Page: 1 |

Copyright 2023-Present -The University of Texas Health Science Center at Houston |