
|
|||||
|
 | |
| |
| |
| |
| |
| |
|
Gene: B4GALT2 |
Gene summary for B4GALT2 |
| Gene information | Species | Human | Gene symbol | B4GALT2 | Gene ID | 8704 |
| Gene name | beta-1,4-galactosyltransferase 2 | |
| Gene Alias | B4Gal-T2 | |
| Cytomap | 1p34.1 | |
| Gene Type | protein-coding | GO ID | GO:0003008 | UniProtAcc | O60909 |
Top |
Malignant transformation analysis |
| Identification of the aberrant gene expression in precancerous and cancerous lesions by comparing the gene expression of stem-like cells in diseased tissues with normal stem cells |
| Entrez ID | Symbol | Replicates | Species | Organ | Tissue | Adj P-value | Log2FC | Malignancy |
| 8704 | B4GALT2 | HCC1_Meng | Human | Liver | HCC | 2.06e-74 | 1.94e-01 | 0.0246 |
| 8704 | B4GALT2 | HCC2_Meng | Human | Liver | HCC | 4.69e-16 | 1.13e-01 | 0.0107 |
| 8704 | B4GALT2 | HCC1 | Human | Liver | HCC | 3.34e-02 | 2.83e+00 | 0.5336 |
| 8704 | B4GALT2 | HCC2 | Human | Liver | HCC | 4.52e-11 | 2.50e+00 | 0.5341 |
| 8704 | B4GALT2 | S014 | Human | Liver | HCC | 2.14e-09 | 4.01e-01 | 0.2254 |
| 8704 | B4GALT2 | S015 | Human | Liver | HCC | 5.84e-15 | 6.82e-01 | 0.2375 |
| 8704 | B4GALT2 | S016 | Human | Liver | HCC | 1.22e-08 | 3.59e-01 | 0.2243 |
| 8704 | B4GALT2 | S027 | Human | Liver | HCC | 1.04e-10 | 7.48e-01 | 0.2446 |
| 8704 | B4GALT2 | S028 | Human | Liver | HCC | 1.04e-24 | 9.12e-01 | 0.2503 |
| 8704 | B4GALT2 | S029 | Human | Liver | HCC | 9.23e-25 | 1.00e+00 | 0.2581 |
| 8704 | B4GALT2 | C04 | Human | Oral cavity | OSCC | 2.36e-20 | 8.50e-01 | 0.2633 |
| 8704 | B4GALT2 | C21 | Human | Oral cavity | OSCC | 3.99e-31 | 9.95e-01 | 0.2678 |
| 8704 | B4GALT2 | C30 | Human | Oral cavity | OSCC | 2.82e-53 | 1.50e+00 | 0.3055 |
| 8704 | B4GALT2 | C51 | Human | Oral cavity | OSCC | 2.87e-24 | 1.13e+00 | 0.2674 |
| 8704 | B4GALT2 | C57 | Human | Oral cavity | OSCC | 3.42e-04 | 2.35e-01 | 0.1679 |
| 8704 | B4GALT2 | C06 | Human | Oral cavity | OSCC | 3.99e-06 | 1.01e+00 | 0.2699 |
| 8704 | B4GALT2 | C08 | Human | Oral cavity | OSCC | 2.99e-02 | 1.58e-01 | 0.1919 |
| 8704 | B4GALT2 | LP15 | Human | Oral cavity | LP | 1.86e-03 | 4.59e-01 | 0.2174 |
| 8704 | B4GALT2 | SYSMH1 | Human | Oral cavity | OSCC | 2.37e-14 | 4.35e-01 | 0.1127 |
| 8704 | B4GALT2 | SYSMH2 | Human | Oral cavity | OSCC | 3.92e-09 | 4.78e-01 | 0.2326 |
| Page: 1 2 |
| Tissue | Expression Dynamics | Abbreviation |
| Liver |  | HCC: Hepatocellular carcinoma |
| NAFLD: Non-alcoholic fatty liver disease | ||
| Oral Cavity |  | EOLP: Erosive Oral lichen planus |
| LP: leukoplakia | ||
| NEOLP: Non-erosive oral lichen planus | ||
| OSCC: Oral squamous cell carcinoma | ||
| Skin |  | AK: Actinic keratosis |
| cSCC: Cutaneous squamous cell carcinoma | ||
| SCCIS:squamous cell carcinoma in situ | ||
| Thyroid | 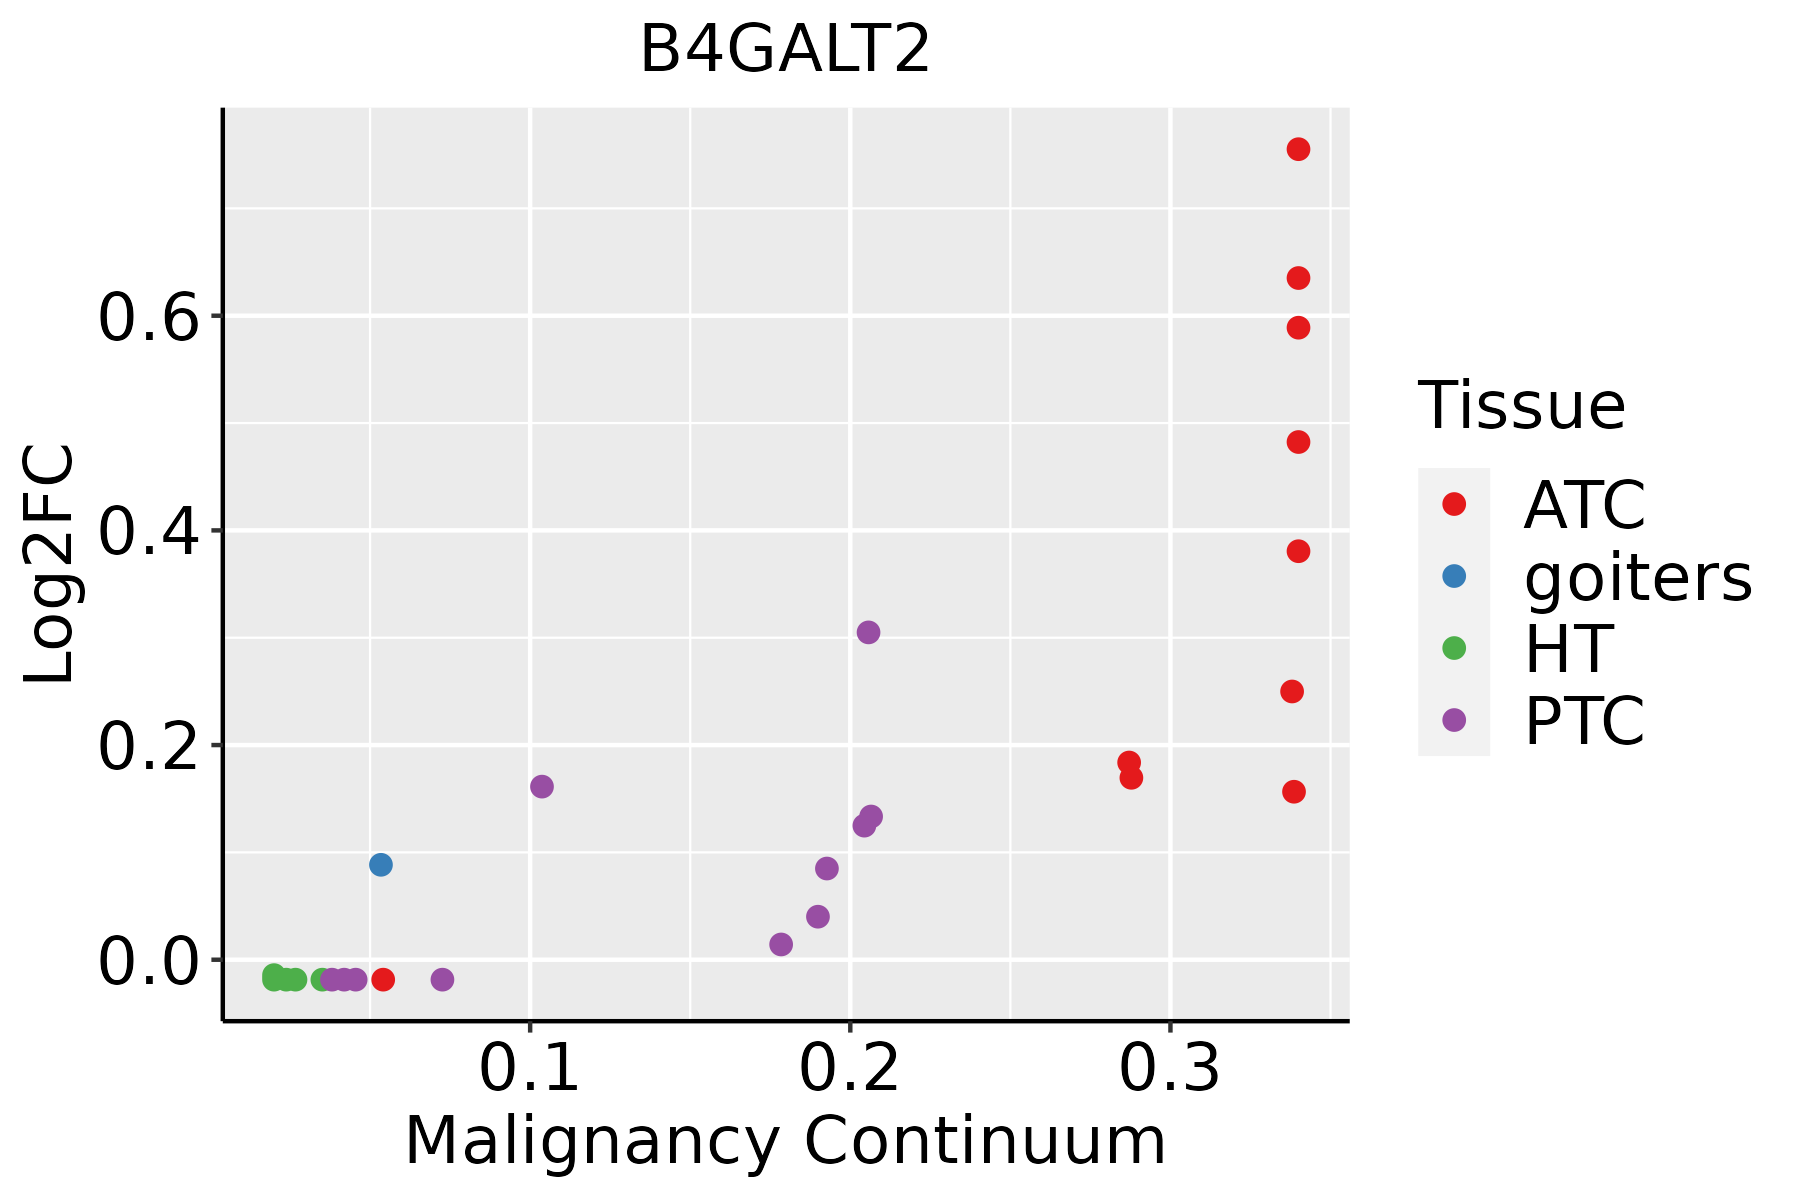 | ATC: Anaplastic thyroid cancer |
| HT: Hashimoto's thyroiditis | ||
| PTC: Papillary thyroid cancer |
| ∗log2FC in expression of this searched gene in stem-like cells from each diseased tissue sample relative to stem-like cells in normal samples in each tissue plotted against the malignancy continuum. Samples are colored based on if they are from different disease stage. |
Top |
Malignant transformation related pathway analysis |
| Find out the enriched GO biological processes and KEGG pathways involved in transition from healthy to precancer to cancer |
| Tissue | Disease Stage | Enriched GO biological Processes |
| Colorectum | AD |  |
| Colorectum | SER |  |
| Colorectum | MSS |  |
| Colorectum | MSI-H |  |
| Colorectum | FAP |  |
| ∗Top 15 enriched GO BP terms are showed in the bar plot of each disease state in each tissue. Each row represents a significant GO biological process which is colored according to the -log10(p.adjust). |
| Page: 1 2 3 4 5 6 7 8 9 |
| GO ID | Tissue | Disease Stage | Description | Gene Ratio | Bg Ratio | pvalue | p.adjust | Count |
| GO:00064862 | Liver | HCC | protein glycosylation | 122/7958 | 226/18723 | 3.11e-04 | 2.21e-03 | 122 |
| GO:00434132 | Liver | HCC | macromolecule glycosylation | 122/7958 | 226/18723 | 3.11e-04 | 2.21e-03 | 122 |
| GO:00700852 | Liver | HCC | glycosylation | 128/7958 | 240/18723 | 4.35e-04 | 2.92e-03 | 128 |
| GO:0009100 | Liver | HCC | glycoprotein metabolic process | 193/7958 | 387/18723 | 1.89e-03 | 9.62e-03 | 193 |
| GO:00093146 | Liver | HCC | response to radiation | 223/7958 | 456/18723 | 3.08e-03 | 1.43e-02 | 223 |
| GO:000931416 | Oral cavity | OSCC | response to radiation | 241/7305 | 456/18723 | 9.76e-10 | 2.40e-08 | 241 |
| GO:00094164 | Oral cavity | OSCC | response to light stimulus | 159/7305 | 320/18723 | 5.98e-05 | 4.92e-04 | 159 |
| GO:00091001 | Oral cavity | OSCC | glycoprotein metabolic process | 185/7305 | 387/18723 | 2.37e-04 | 1.54e-03 | 185 |
| GO:00091011 | Oral cavity | OSCC | glycoprotein biosynthetic process | 151/7305 | 317/18723 | 1.01e-03 | 5.26e-03 | 151 |
| GO:00064864 | Oral cavity | OSCC | protein glycosylation | 111/7305 | 226/18723 | 1.22e-03 | 6.10e-03 | 111 |
| GO:00434134 | Oral cavity | OSCC | macromolecule glycosylation | 111/7305 | 226/18723 | 1.22e-03 | 6.10e-03 | 111 |
| GO:00700853 | Oral cavity | OSCC | glycosylation | 117/7305 | 240/18723 | 1.29e-03 | 6.42e-03 | 117 |
| GO:000931417 | Oral cavity | LP | response to radiation | 155/4623 | 456/18723 | 4.12e-06 | 8.49e-05 | 155 |
| GO:007008511 | Oral cavity | LP | glycosylation | 77/4623 | 240/18723 | 5.60e-03 | 3.38e-02 | 77 |
| GO:000648611 | Oral cavity | LP | protein glycosylation | 73/4623 | 226/18723 | 5.72e-03 | 3.44e-02 | 73 |
| GO:004341311 | Oral cavity | LP | macromolecule glycosylation | 73/4623 | 226/18723 | 5.72e-03 | 3.44e-02 | 73 |
| GO:000931424 | Skin | cSCC | response to radiation | 166/4864 | 456/18723 | 4.37e-07 | 8.41e-06 | 166 |
| GO:000941621 | Skin | cSCC | response to light stimulus | 107/4864 | 320/18723 | 1.66e-03 | 1.02e-02 | 107 |
| GO:0009314111 | Thyroid | PTC | response to radiation | 195/5968 | 456/18723 | 5.10e-07 | 8.27e-06 | 195 |
| GO:00064866 | Thyroid | PTC | protein glycosylation | 94/5968 | 226/18723 | 1.25e-03 | 7.13e-03 | 94 |
| Page: 1 2 |
| Pathway ID | Tissue | Disease Stage | Description | Gene Ratio | Bg Ratio | pvalue | p.adjust | qvalue | Count |
| hsa0051021 | Liver | HCC | N-Glycan biosynthesis | 40/4020 | 53/8465 | 2.95e-05 | 1.87e-04 | 1.04e-04 | 40 |
| hsa005132 | Liver | HCC | Various types of N-glycan biosynthesis | 30/4020 | 42/8465 | 1.41e-03 | 5.07e-03 | 2.82e-03 | 30 |
| hsa0051031 | Liver | HCC | N-Glycan biosynthesis | 40/4020 | 53/8465 | 2.95e-05 | 1.87e-04 | 1.04e-04 | 40 |
| hsa005133 | Liver | HCC | Various types of N-glycan biosynthesis | 30/4020 | 42/8465 | 1.41e-03 | 5.07e-03 | 2.82e-03 | 30 |
| hsa005105 | Oral cavity | OSCC | N-Glycan biosynthesis | 39/3704 | 53/8465 | 9.77e-06 | 4.36e-05 | 2.22e-05 | 39 |
| hsa005135 | Oral cavity | OSCC | Various types of N-glycan biosynthesis | 29/3704 | 42/8465 | 8.03e-04 | 2.32e-03 | 1.18e-03 | 29 |
| hsa0051012 | Oral cavity | OSCC | N-Glycan biosynthesis | 39/3704 | 53/8465 | 9.77e-06 | 4.36e-05 | 2.22e-05 | 39 |
| hsa0051312 | Oral cavity | OSCC | Various types of N-glycan biosynthesis | 29/3704 | 42/8465 | 8.03e-04 | 2.32e-03 | 1.18e-03 | 29 |
| hsa0051022 | Oral cavity | LP | N-Glycan biosynthesis | 31/2418 | 53/8465 | 4.86e-06 | 4.14e-05 | 2.67e-05 | 31 |
| hsa0051321 | Oral cavity | LP | Various types of N-glycan biosynthesis | 22/2418 | 42/8465 | 9.58e-04 | 4.49e-03 | 2.90e-03 | 22 |
| hsa0051032 | Oral cavity | LP | N-Glycan biosynthesis | 31/2418 | 53/8465 | 4.86e-06 | 4.14e-05 | 2.67e-05 | 31 |
| hsa0051331 | Oral cavity | LP | Various types of N-glycan biosynthesis | 22/2418 | 42/8465 | 9.58e-04 | 4.49e-03 | 2.90e-03 | 22 |
| Page: 1 |
Top |
Cell-cell communication analysis |
| Identification of potential cell-cell interactions between two cell types and their ligand-receptor pairs for different disease states |
| Ligand | Receptor | LRpair | Pathway | Tissue | Disease Stage |
| Page: 1 |
Top |
Single-cell gene regulatory network inference analysis |
| Find out the significant the regulons (TFs) and the target genes of each regulon across cell types for different disease states |
| TF | Cell Type | Tissue | Disease Stage | Target Gene | RSS | Regulon Activity |
| ∗The dot plots of a searched regulon are shown for all cell subpopulations in each disease state of each tissue based on the regulon specific score inferred using pySCENIC and by calculating the average expression. |
| Page: 1 |
Top |
Somatic mutation of malignant transformation related genes |
| Annotation of somatic variants for genes involved in malignant transformation |
| Hugo Symbol | Variant Class | Variant Classification | dbSNP RS | HGVSc | HGVSp | HGVSp Short | SWISSPROT | BIOTYPE | SIFT | PolyPhen | Tumor Sample Barcode | Tissue | Histology | Sex | Age | Stage | Therapy Types | Drugs | Outcome |
| B4GALT2 | SNV | Missense_Mutation | rs765252809 | c.604C>T | p.Arg202Trp | p.R202W | O60909 | protein_coding | deleterious(0) | probably_damaging(0.96) | TCGA-2W-A8YY-01 | Cervix | cervical & endocervical cancer | Female | <65 | I/II | Chemotherapy | cisplatin | CR |
| B4GALT2 | SNV | Missense_Mutation | rs753720865 | c.1177N>T | p.Arg393Trp | p.R393W | O60909 | protein_coding | deleterious(0.01) | benign(0.432) | TCGA-AA-3715-01 | Colorectum | colon adenocarcinoma | Male | >=65 | I/II | Unknown | Unknown | PD |
| B4GALT2 | SNV | Missense_Mutation | rs755791825 | c.692N>T | p.Ala231Val | p.A231V | O60909 | protein_coding | deleterious(0.01) | benign(0.042) | TCGA-AA-A010-01 | Colorectum | colon adenocarcinoma | Female | <65 | I/II | Chemotherapy | folinic | CR |
| B4GALT2 | SNV | Missense_Mutation | c.736N>A | p.Val246Met | p.V246M | O60909 | protein_coding | deleterious(0.03) | probably_damaging(0.985) | TCGA-AZ-6598-01 | Colorectum | colon adenocarcinoma | Female | >=65 | I/II | Unknown | Unknown | SD | |
| B4GALT2 | SNV | Missense_Mutation | rs753720865 | c.1177N>T | p.Arg393Trp | p.R393W | O60909 | protein_coding | deleterious(0.01) | benign(0.432) | TCGA-CM-6171-01 | Colorectum | colon adenocarcinoma | Female | >=65 | I/II | Unknown | Unknown | SD |
| B4GALT2 | SNV | Missense_Mutation | c.1045A>G | p.Asn349Asp | p.N349D | O60909 | protein_coding | deleterious(0.01) | probably_damaging(0.991) | TCGA-G4-6309-01 | Colorectum | colon adenocarcinoma | Female | <65 | III/IV | Chemotherapy | xeloda | PD | |
| B4GALT2 | SNV | Missense_Mutation | rs766675284 | c.980G>A | p.Arg327His | p.R327H | O60909 | protein_coding | deleterious(0) | probably_damaging(0.998) | TCGA-WS-AB45-01 | Colorectum | colon adenocarcinoma | Female | <65 | I/II | Unknown | Unknown | SD |
| B4GALT2 | SNV | Missense_Mutation | novel | c.806C>T | p.Ala269Val | p.A269V | O60909 | protein_coding | deleterious(0.05) | possibly_damaging(0.775) | TCGA-A5-A1OF-01 | Endometrium | uterine corpus endometrioid carcinoma | Female | <65 | I/II | Unknown | Unknown | SD |
| B4GALT2 | SNV | Missense_Mutation | rs751228190 | c.1184C>T | p.Pro395Leu | p.P395L | O60909 | protein_coding | deleterious(0.01) | benign(0.018) | TCGA-AP-A056-01 | Endometrium | uterine corpus endometrioid carcinoma | Female | <65 | I/II | Unknown | Unknown | SD |
| B4GALT2 | SNV | Missense_Mutation | c.778G>T | p.Gly260Cys | p.G260C | O60909 | protein_coding | tolerated(0.17) | possibly_damaging(0.851) | TCGA-AP-A0LE-01 | Endometrium | uterine corpus endometrioid carcinoma | Female | <65 | I/II | Unknown | Unknown | SD |
| Page: 1 2 3 4 |
Top |
Related drugs of malignant transformation related genes |
| Identification of chemicals and drugs interact with genes involved in malignant transfromation |
| (DGIdb 4.0) |
| Entrez ID | Symbol | Category | Interaction Types | Drug Claim Name | Drug Name | PMIDs |
| 8704 | B4GALT2 | ENZYME | aspirin | ASPIRIN | ||
| 8704 | B4GALT2 | ENZYME | clopidogrel | CLOPIDOGREL |
| Page: 1 |

Copyright 2023-Present -The University of Texas Health Science Center at Houston |