
|
|||||
|
 | |
| |
| |
| |
| |
| |
|
Gene: B4GALT1 |
Gene summary for B4GALT1 |
| Gene information | Species | Human | Gene symbol | B4GALT1 | Gene ID | 2683 |
| Gene name | beta-1,4-galactosyltransferase 1 | |
| Gene Alias | B4GAL-T1 | |
| Cytomap | 9p21.1 | |
| Gene Type | protein-coding | GO ID | GO:0000003 | UniProtAcc | P15291 |
Top |
Malignant transformation analysis |
| Identification of the aberrant gene expression in precancerous and cancerous lesions by comparing the gene expression of stem-like cells in diseased tissues with normal stem cells |
| Entrez ID | Symbol | Replicates | Species | Organ | Tissue | Adj P-value | Log2FC | Malignancy |
| 2683 | B4GALT1 | GSM4909281 | Human | Breast | IDC | 2.41e-22 | 6.27e-01 | 0.21 |
| 2683 | B4GALT1 | GSM4909282 | Human | Breast | IDC | 1.40e-14 | 4.71e-01 | -0.0288 |
| 2683 | B4GALT1 | GSM4909290 | Human | Breast | IDC | 2.47e-14 | 6.65e-01 | 0.2096 |
| 2683 | B4GALT1 | GSM4909293 | Human | Breast | IDC | 1.56e-04 | 1.03e-01 | 0.1581 |
| 2683 | B4GALT1 | GSM4909297 | Human | Breast | IDC | 5.35e-07 | 1.22e-04 | 0.1517 |
| 2683 | B4GALT1 | GSM4909311 | Human | Breast | IDC | 6.69e-12 | -2.91e-01 | 0.1534 |
| 2683 | B4GALT1 | GSM4909315 | Human | Breast | IDC | 2.17e-03 | -3.10e-01 | 0.21 |
| 2683 | B4GALT1 | GSM4909316 | Human | Breast | IDC | 2.79e-02 | -3.75e-01 | 0.21 |
| 2683 | B4GALT1 | GSM4909319 | Human | Breast | IDC | 2.78e-15 | -4.06e-01 | 0.1563 |
| 2683 | B4GALT1 | GSM4909320 | Human | Breast | IDC | 4.93e-06 | -3.82e-01 | 0.1575 |
| 2683 | B4GALT1 | GSM4909321 | Human | Breast | IDC | 8.21e-09 | -3.31e-01 | 0.1559 |
| 2683 | B4GALT1 | brca2 | Human | Breast | Precancer | 1.21e-02 | 1.86e-01 | -0.024 |
| 2683 | B4GALT1 | NCCBC11 | Human | Breast | DCIS | 1.57e-10 | 6.84e-01 | 0.1232 |
| 2683 | B4GALT1 | NCCBC14 | Human | Breast | DCIS | 1.25e-04 | -1.28e-01 | 0.2021 |
| 2683 | B4GALT1 | NCCBC5 | Human | Breast | DCIS | 1.11e-05 | -1.06e-01 | 0.2046 |
| 2683 | B4GALT1 | P1 | Human | Breast | IDC | 1.45e-08 | -2.91e-01 | 0.1527 |
| 2683 | B4GALT1 | DCIS2 | Human | Breast | DCIS | 2.52e-51 | 5.20e-01 | 0.0085 |
| 2683 | B4GALT1 | HTA11_2487_2000001011 | Human | Colorectum | SER | 1.92e-13 | 1.03e+00 | -0.1808 |
| 2683 | B4GALT1 | HTA11_1938_2000001011 | Human | Colorectum | AD | 2.22e-13 | 7.19e-01 | -0.0811 |
| 2683 | B4GALT1 | HTA11_347_2000001011 | Human | Colorectum | AD | 9.64e-21 | 6.65e-01 | -0.1954 |
| Page: 1 2 3 4 5 6 7 8 9 10 |
| Tissue | Expression Dynamics | Abbreviation |
| Breast |  | IDC: Invasive ductal carcinoma |
| DCIS: Ductal carcinoma in situ | ||
| Precancer(BRCA1-mut): Precancerous lesion from BRCA1 mutation carriers | ||
| Colorectum (GSE201348) | 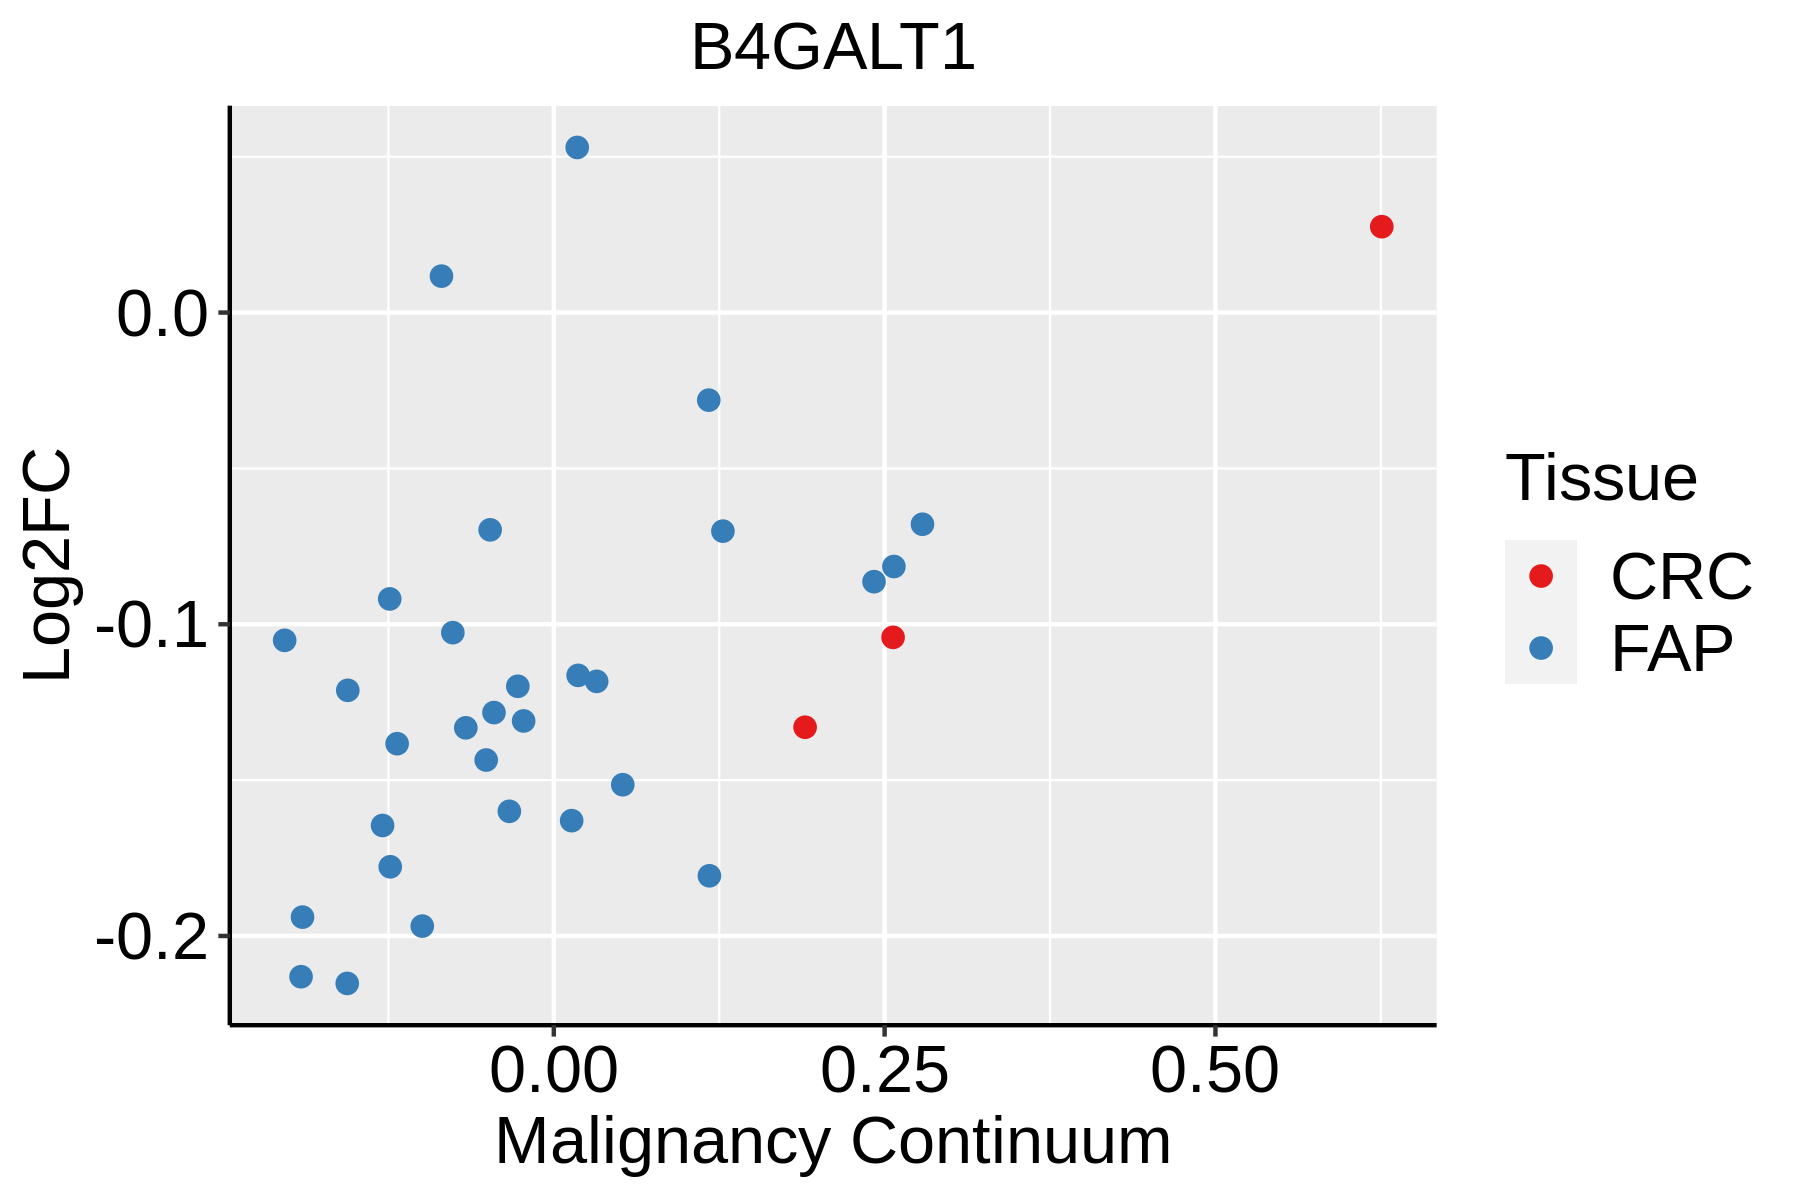 | FAP: Familial adenomatous polyposis |
| CRC: Colorectal cancer | ||
| Colorectum (HTA11) | 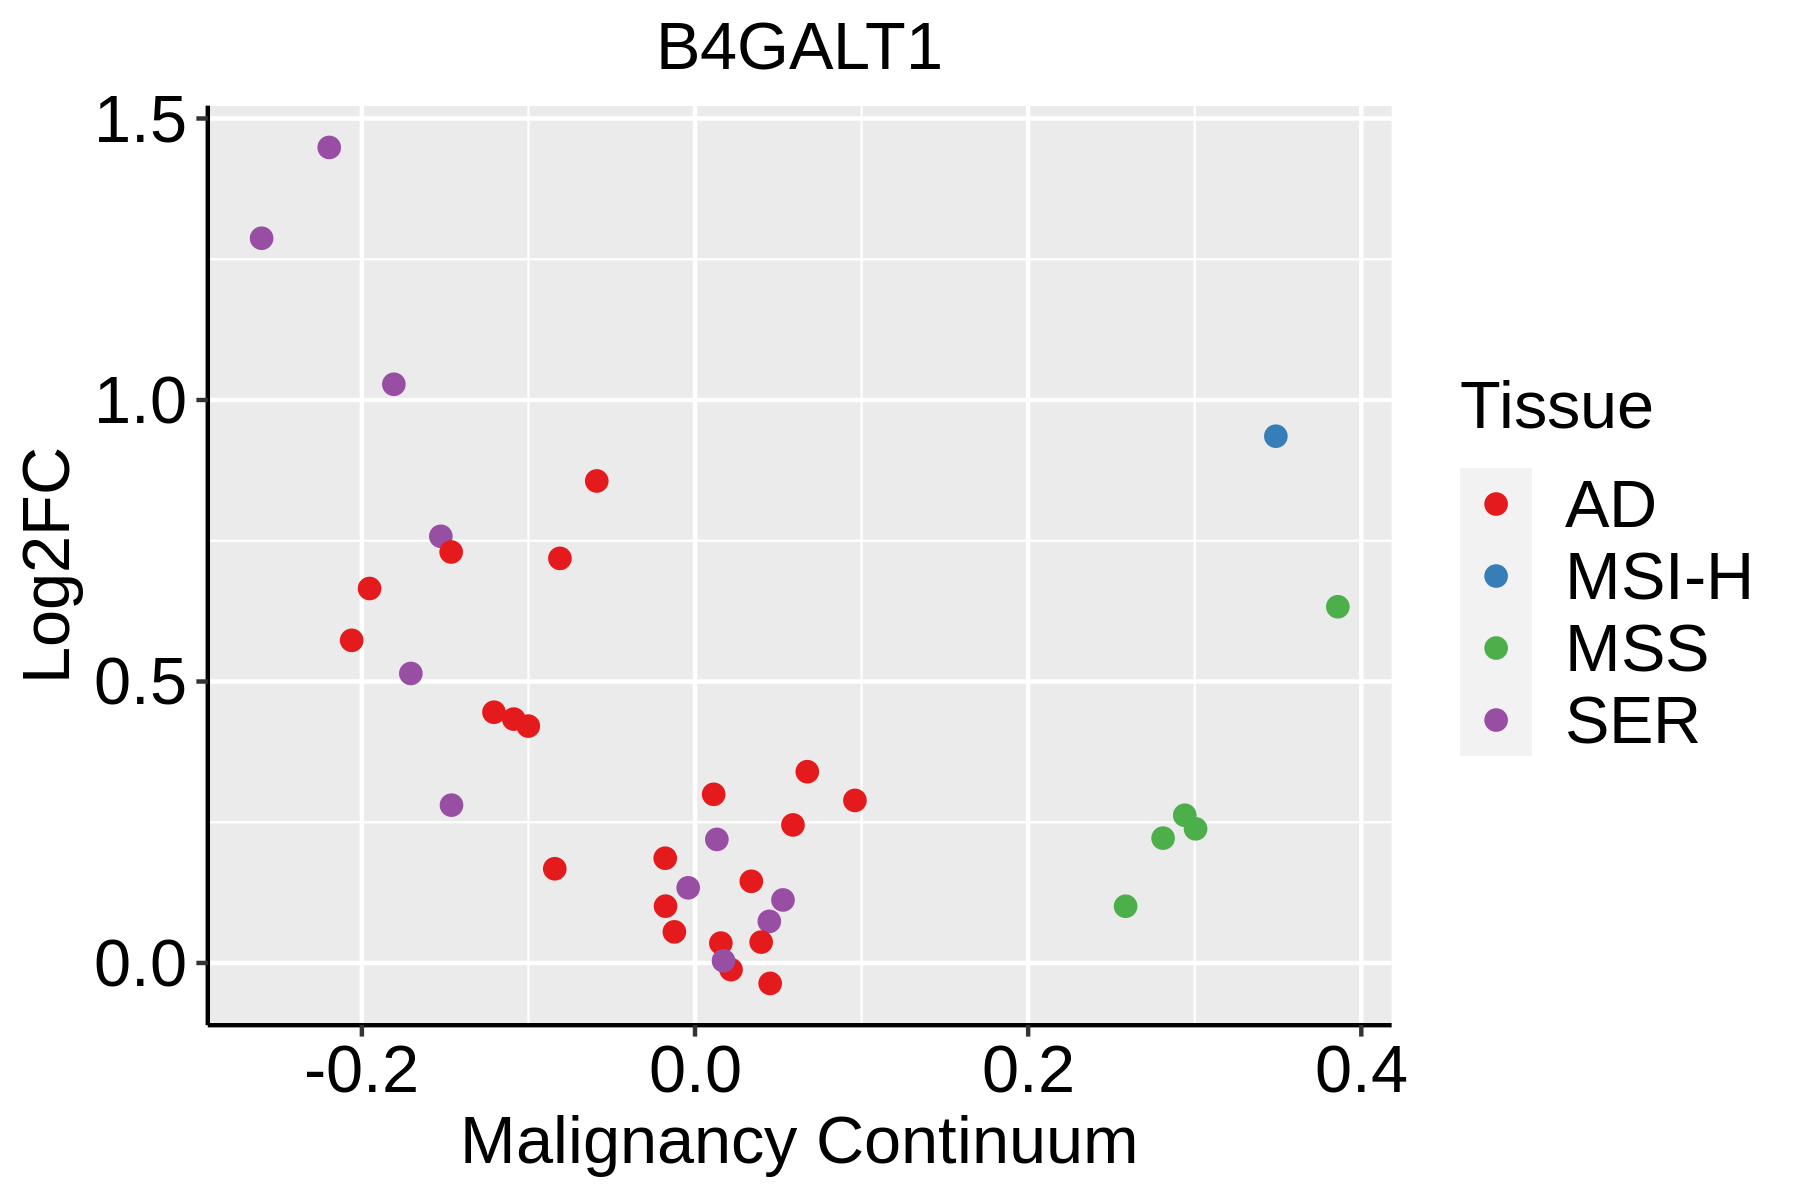 | AD: Adenomas |
| SER: Sessile serrated lesions | ||
| MSI-H: Microsatellite-high colorectal cancer | ||
| MSS: Microsatellite stable colorectal cancer | ||
| Endometrium | 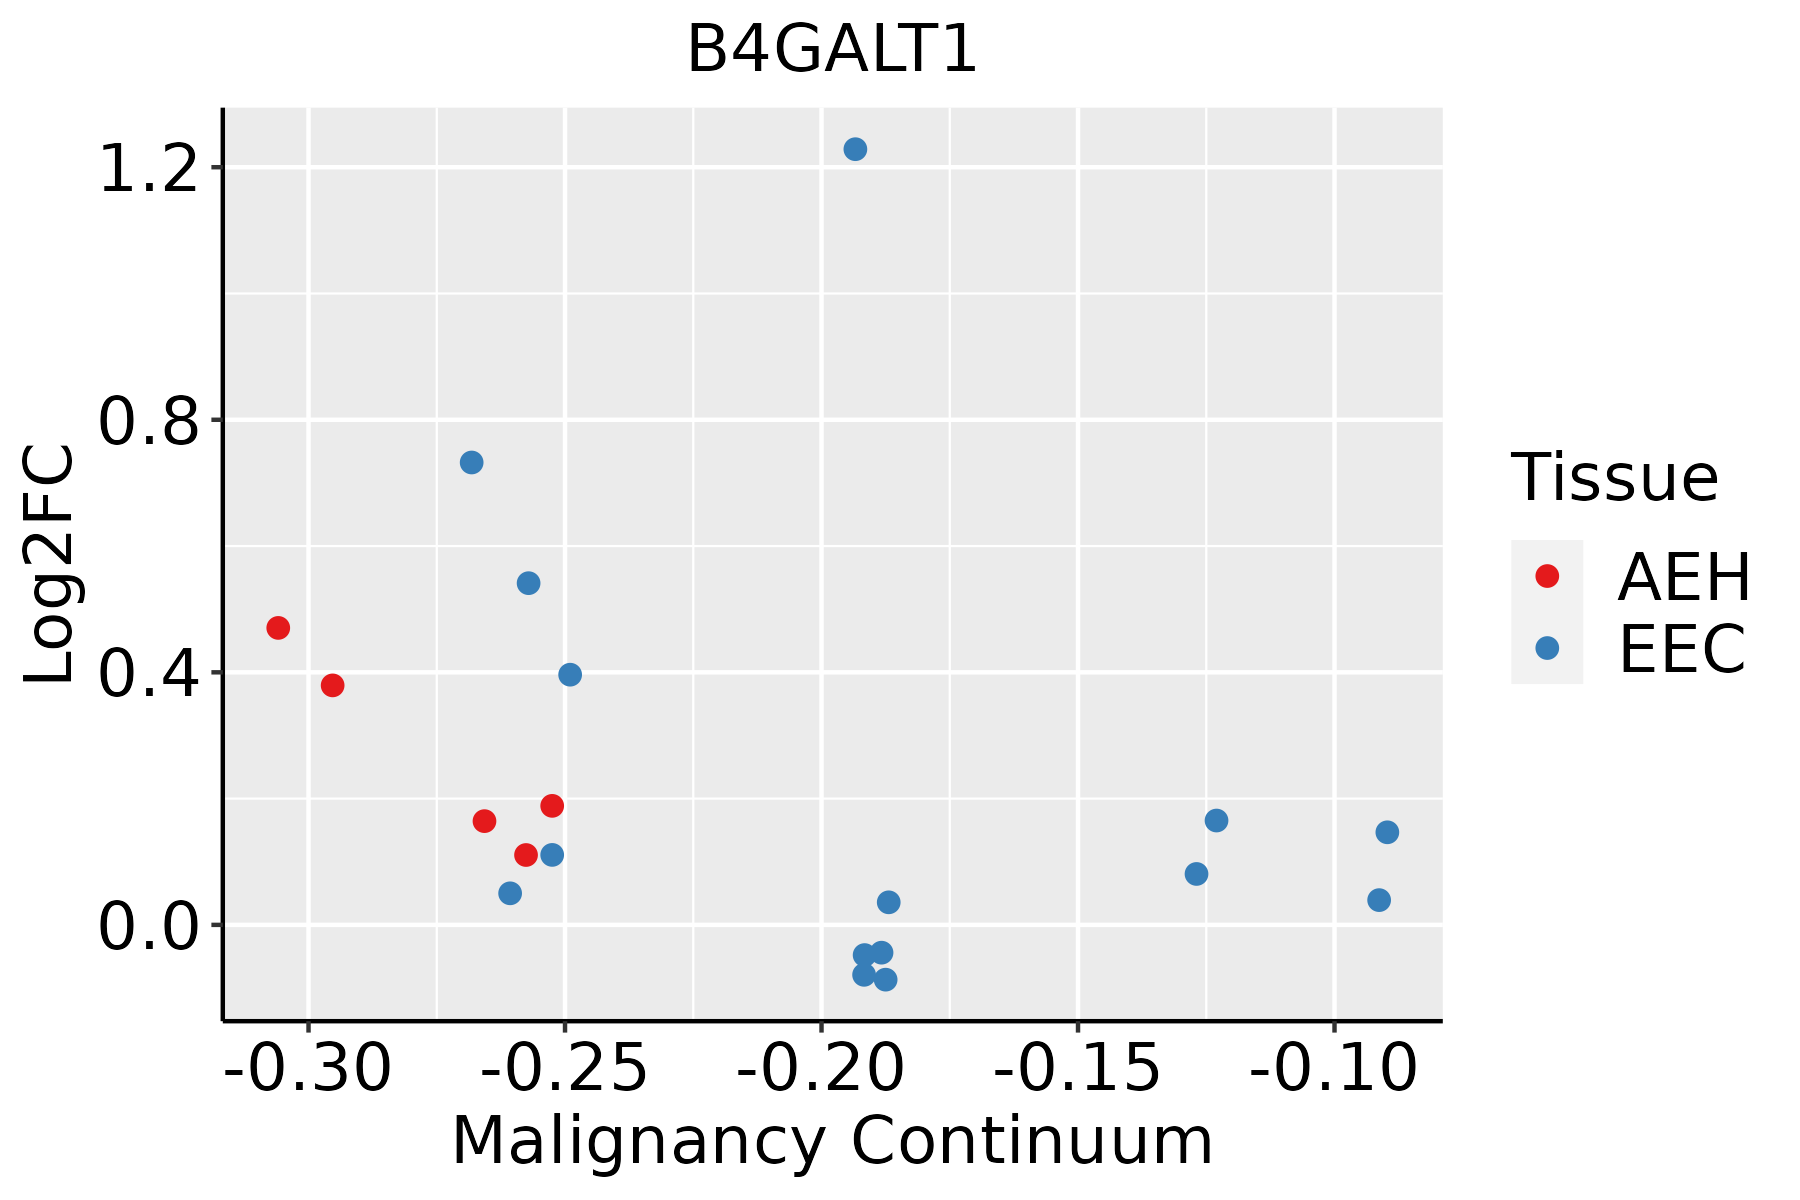 | AEH: Atypical endometrial hyperplasia |
| EEC: Endometrioid Cancer | ||
| Esophagus | 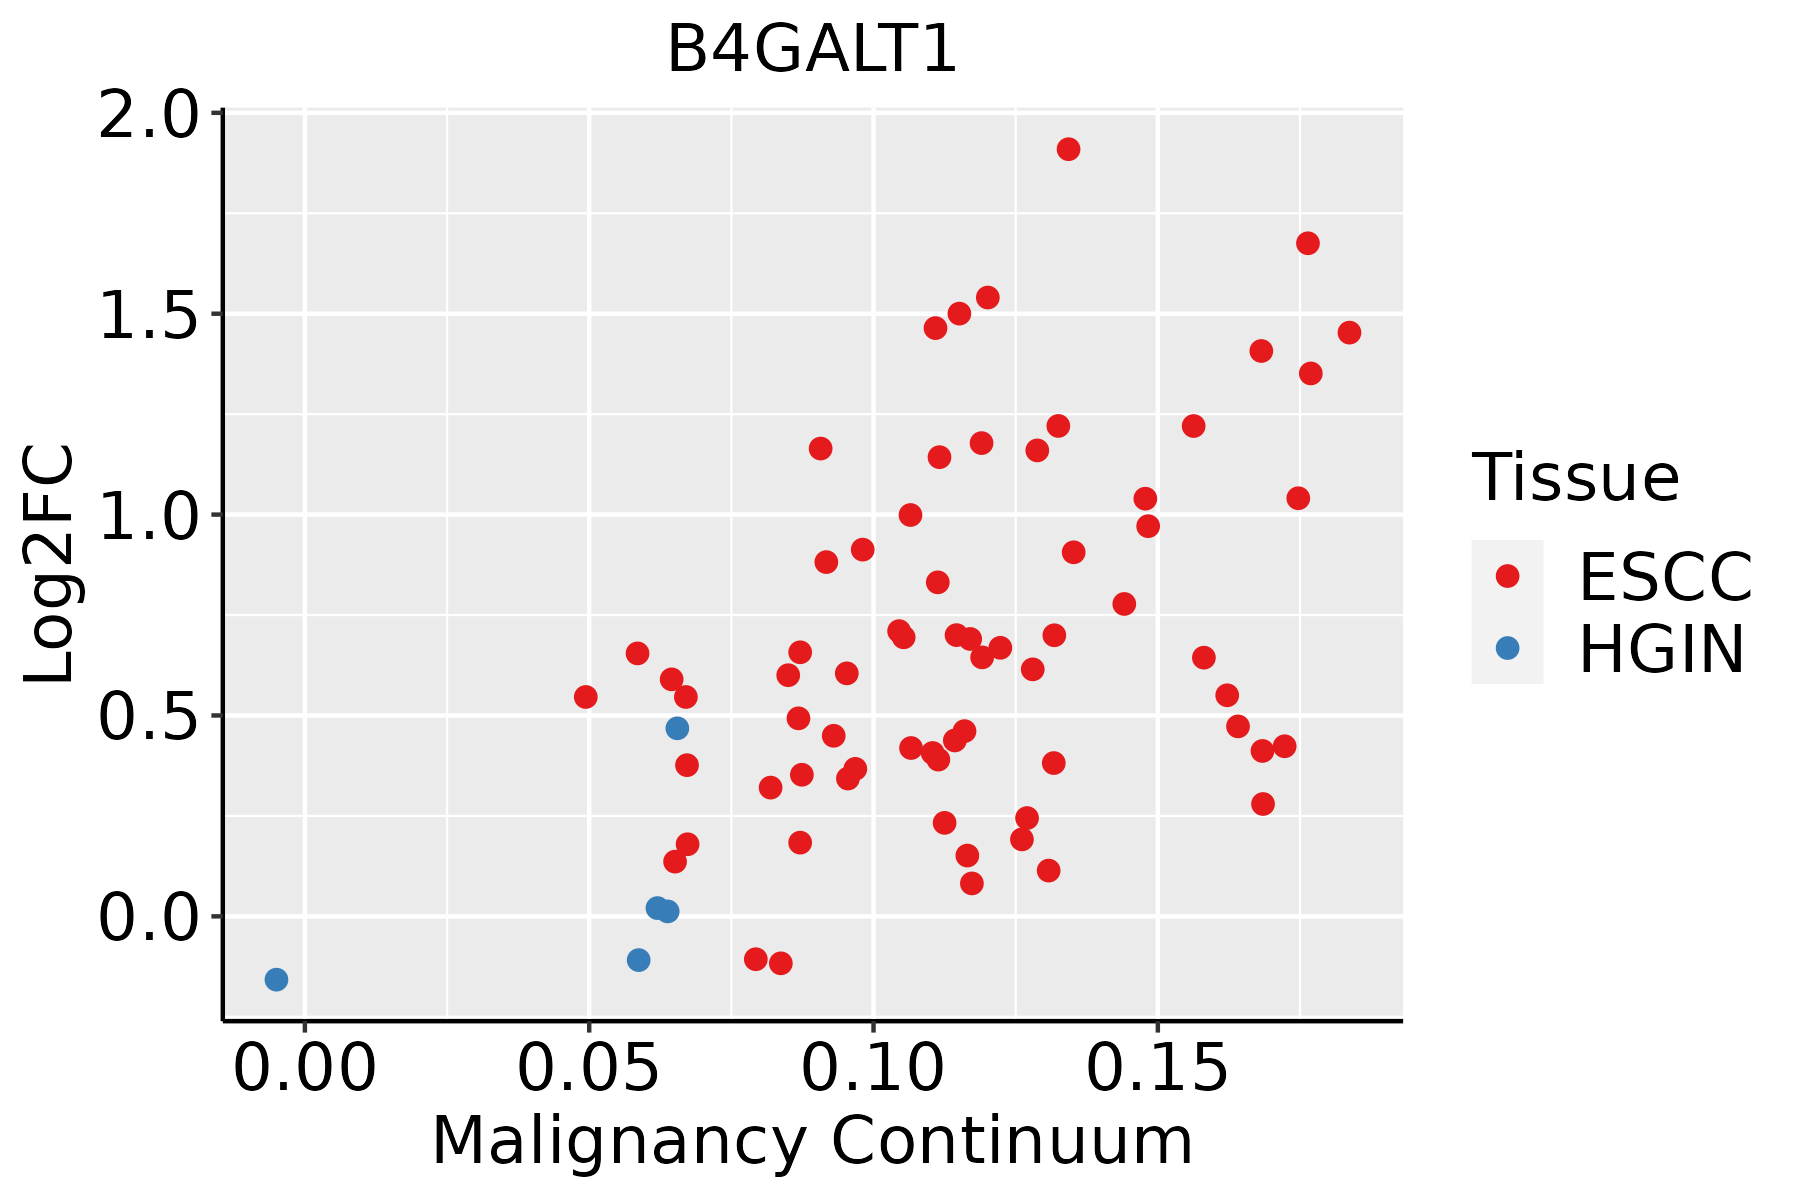 | ESCC: Esophageal squamous cell carcinoma |
| HGIN: High-grade intraepithelial neoplasias | ||
| LGIN: Low-grade intraepithelial neoplasias | ||
| Liver | 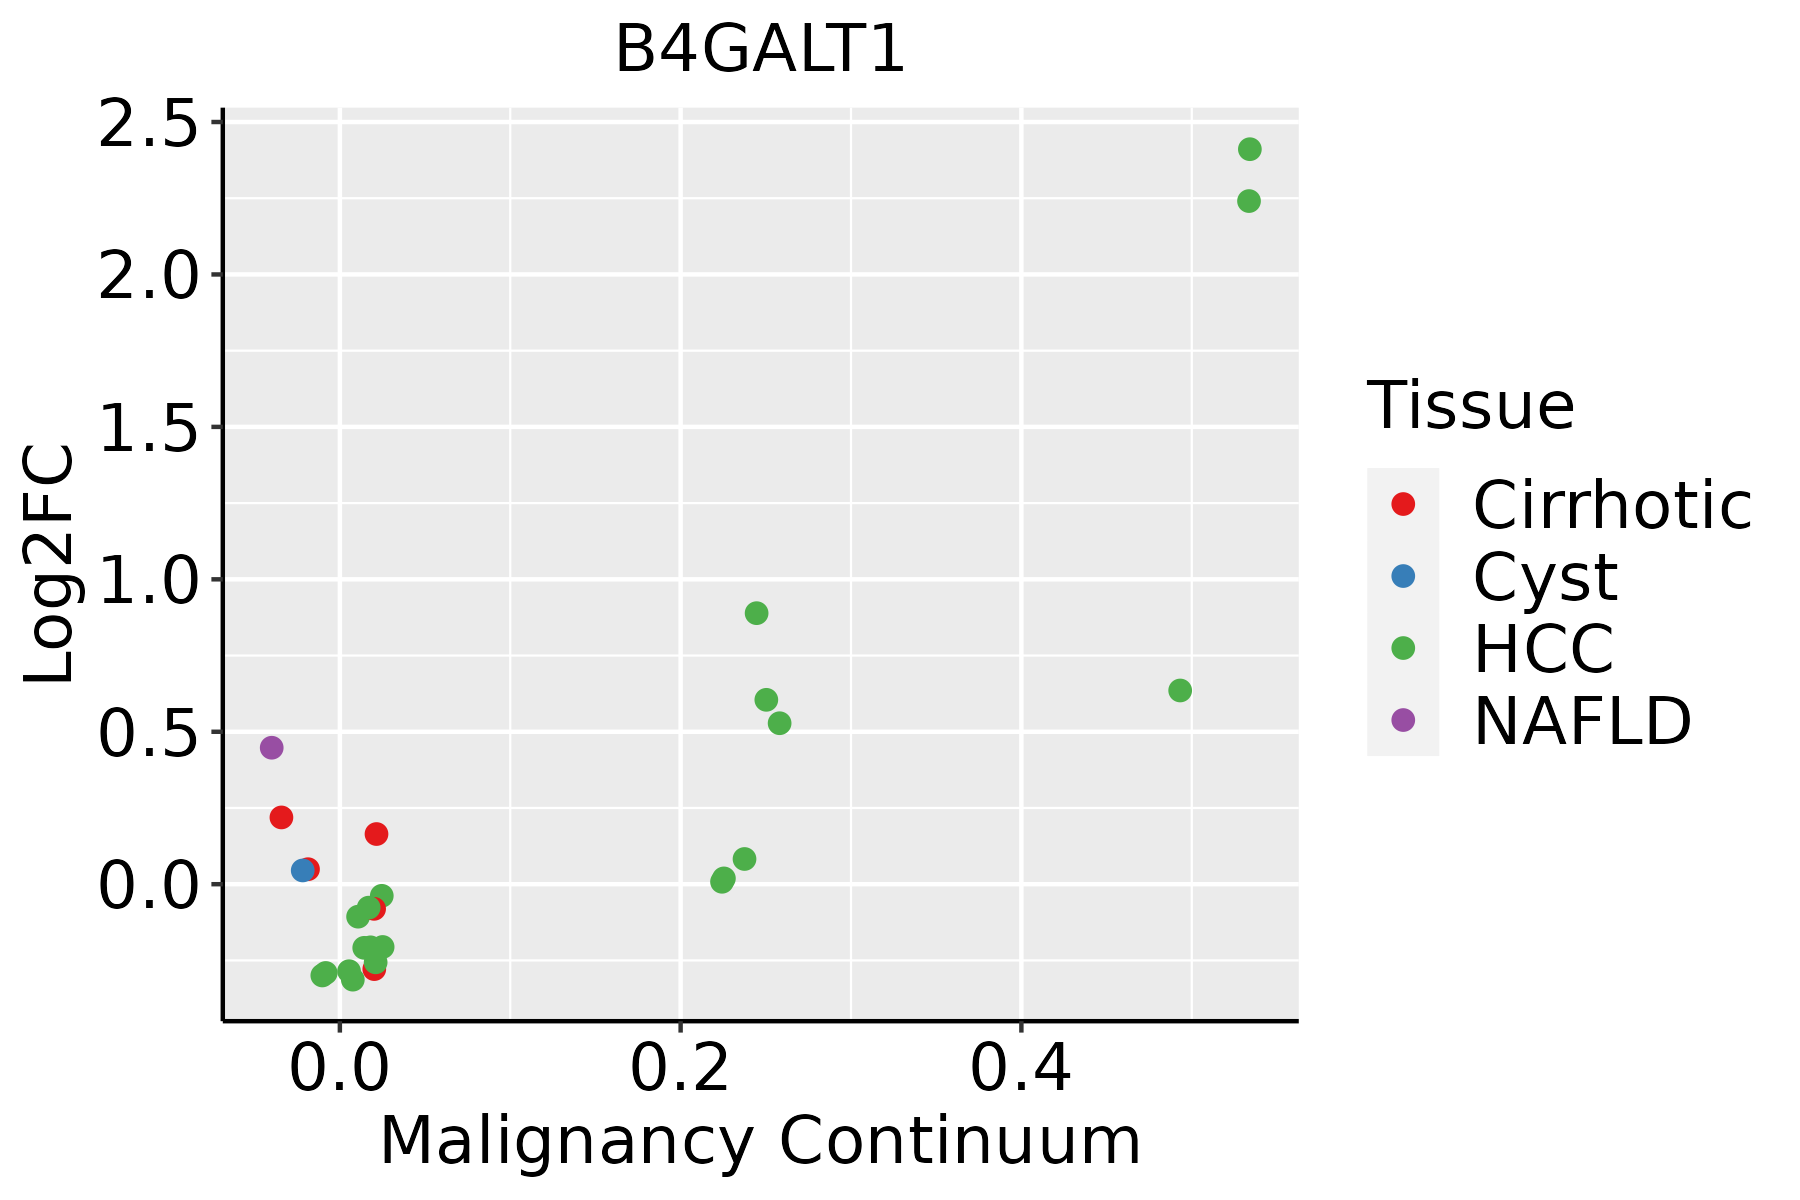 | HCC: Hepatocellular carcinoma |
| NAFLD: Non-alcoholic fatty liver disease | ||
| Lung | 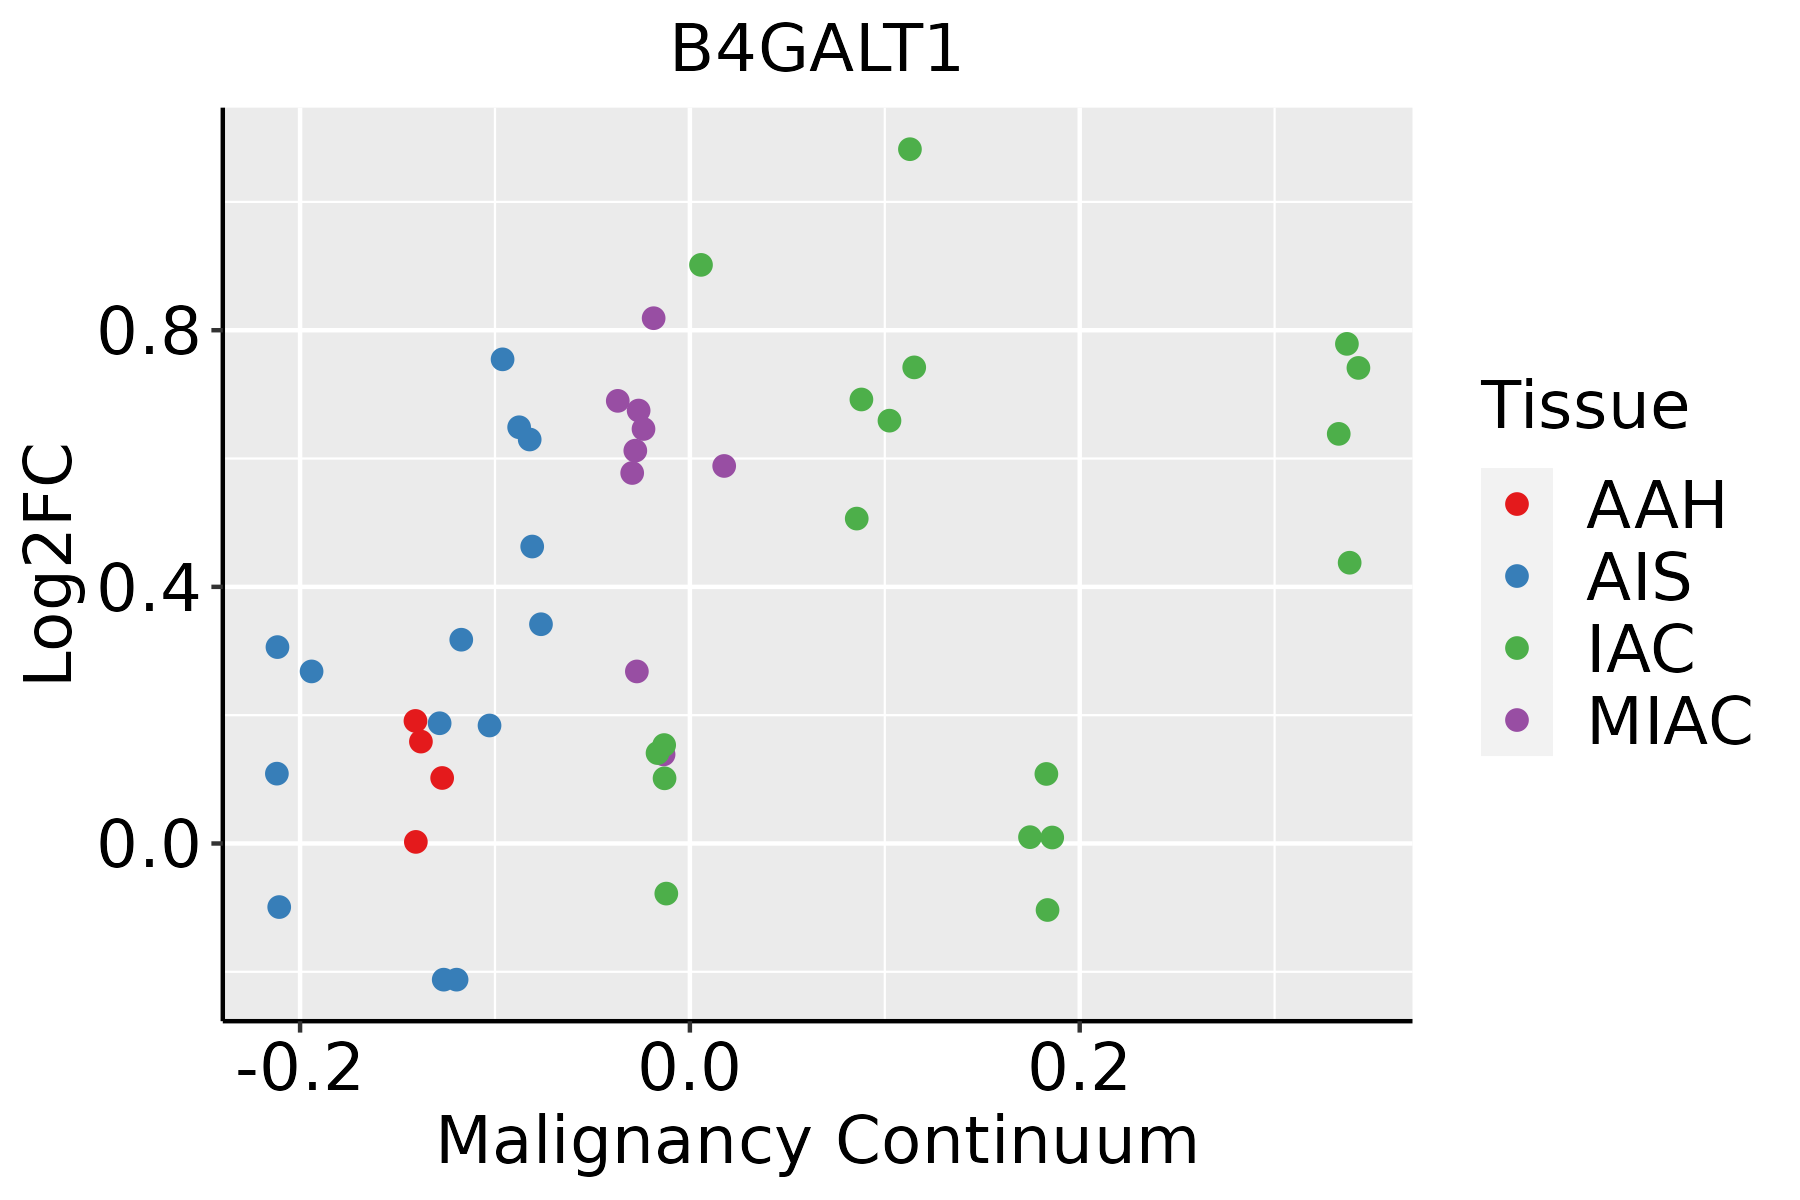 | AAH: Atypical adenomatous hyperplasia |
| AIS: Adenocarcinoma in situ | ||
| IAC: Invasive lung adenocarcinoma | ||
| MIA: Minimally invasive adenocarcinoma | ||
| Oral Cavity |  | EOLP: Erosive Oral lichen planus |
| LP: leukoplakia | ||
| NEOLP: Non-erosive oral lichen planus | ||
| OSCC: Oral squamous cell carcinoma | ||
| Prostate | 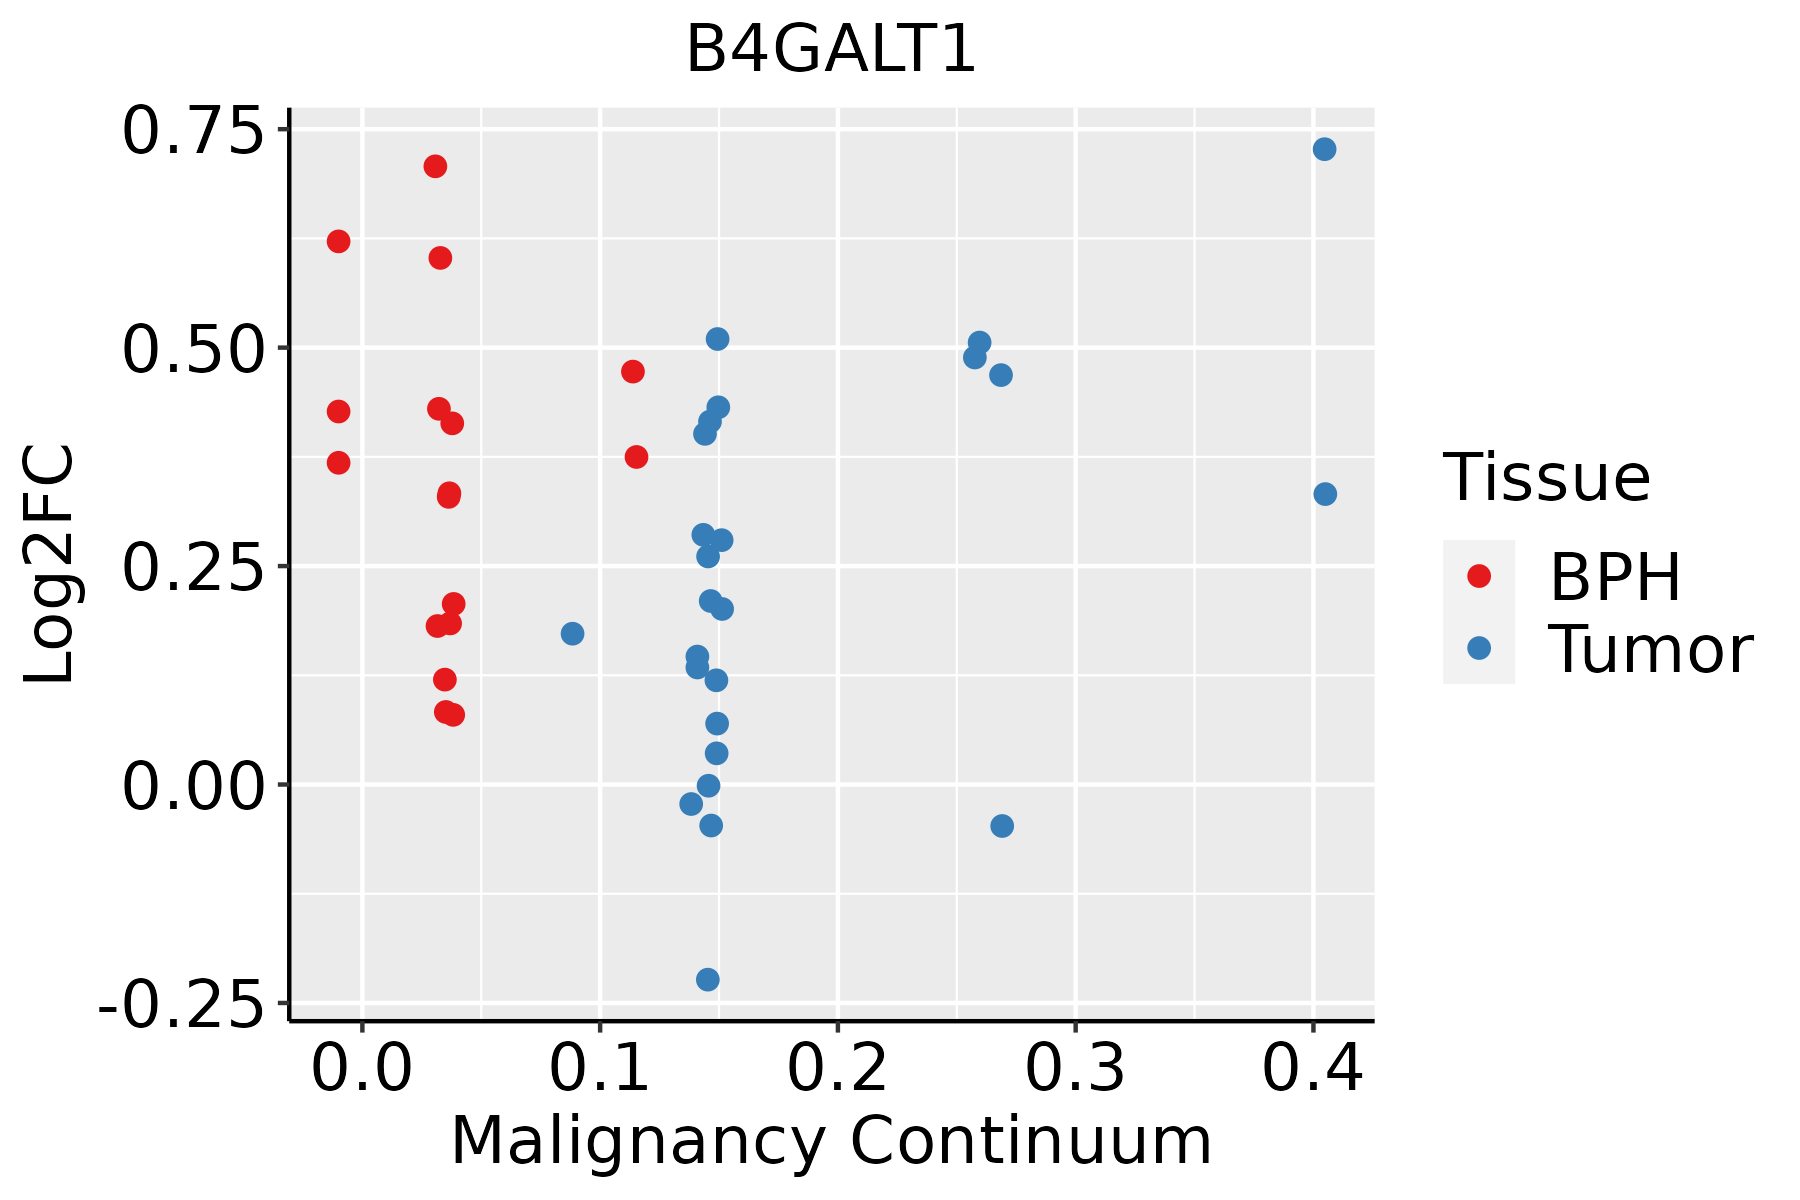 | BPH: Benign Prostatic Hyperplasia |
| Skin | 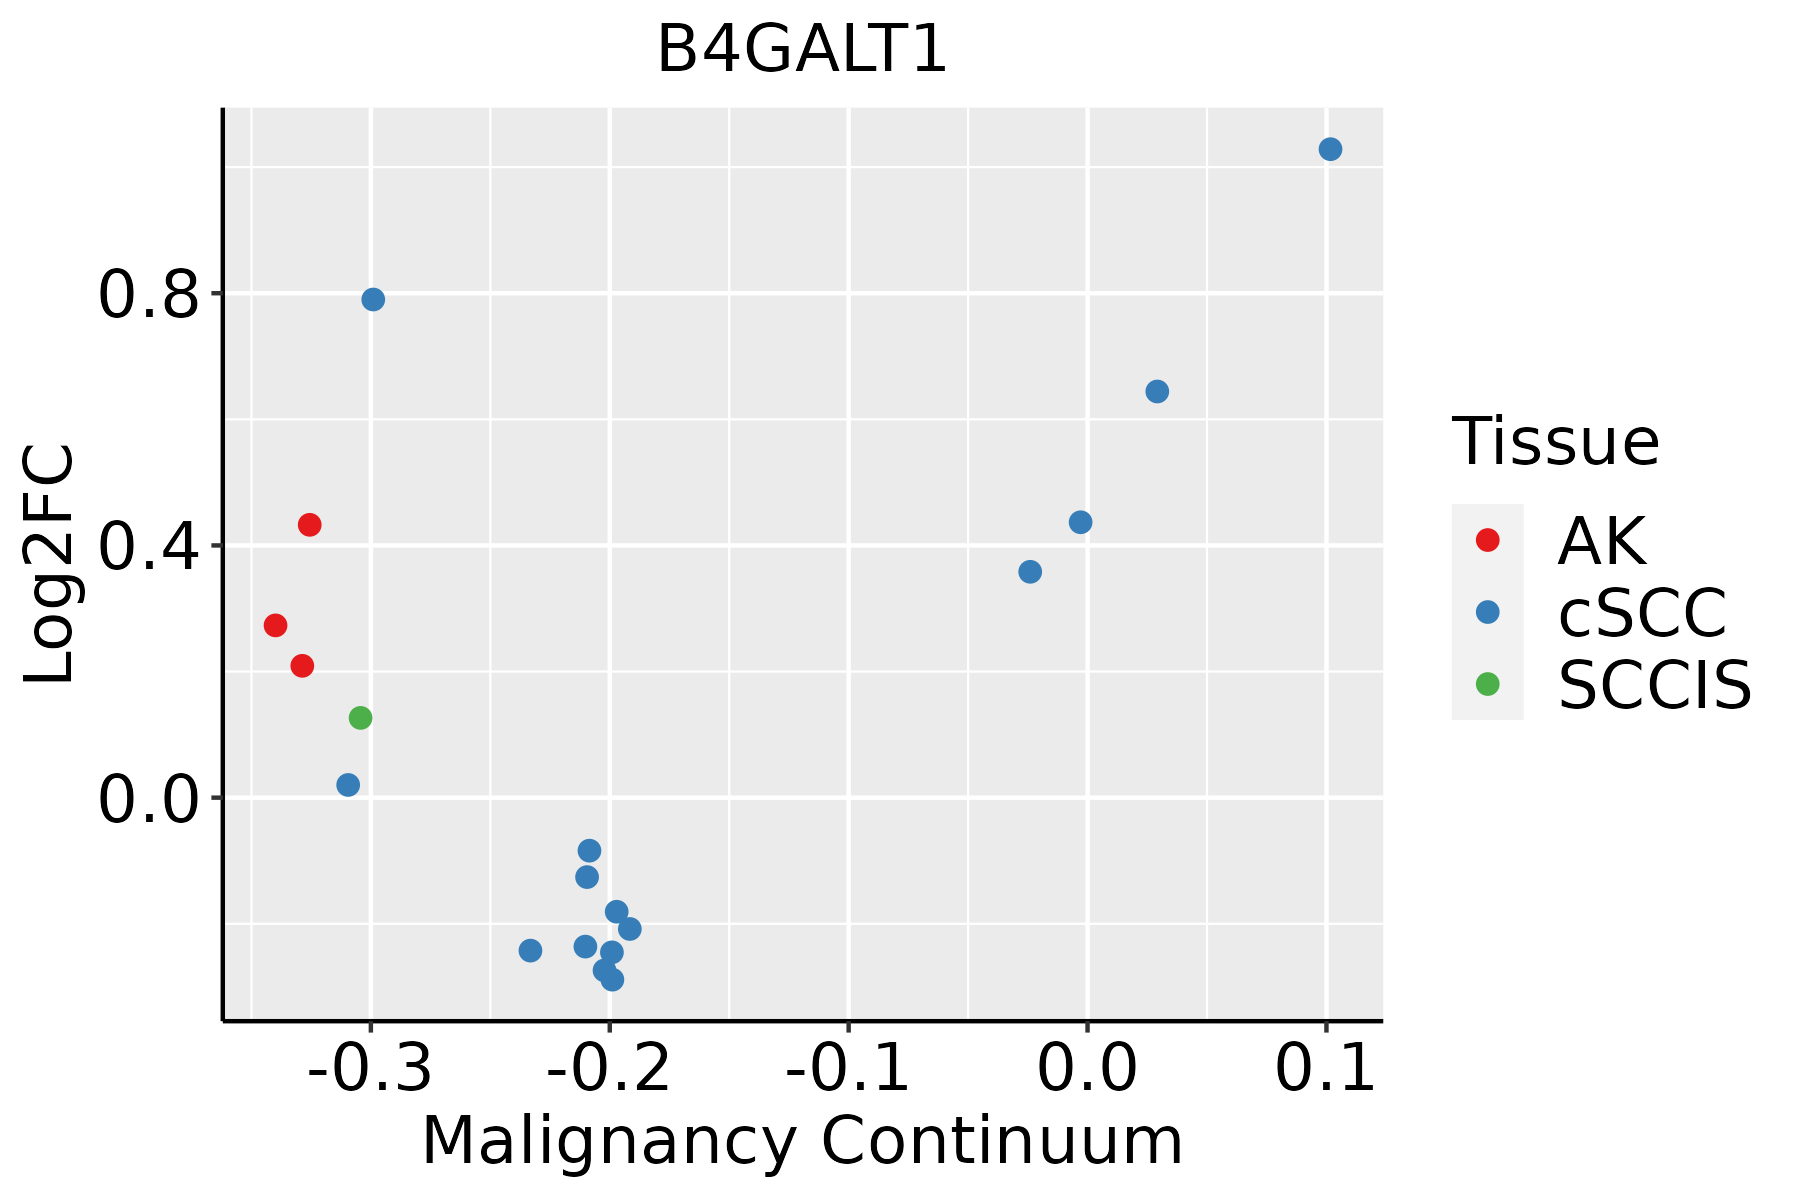 | AK: Actinic keratosis |
| cSCC: Cutaneous squamous cell carcinoma | ||
| SCCIS:squamous cell carcinoma in situ | ||
| Thyroid | 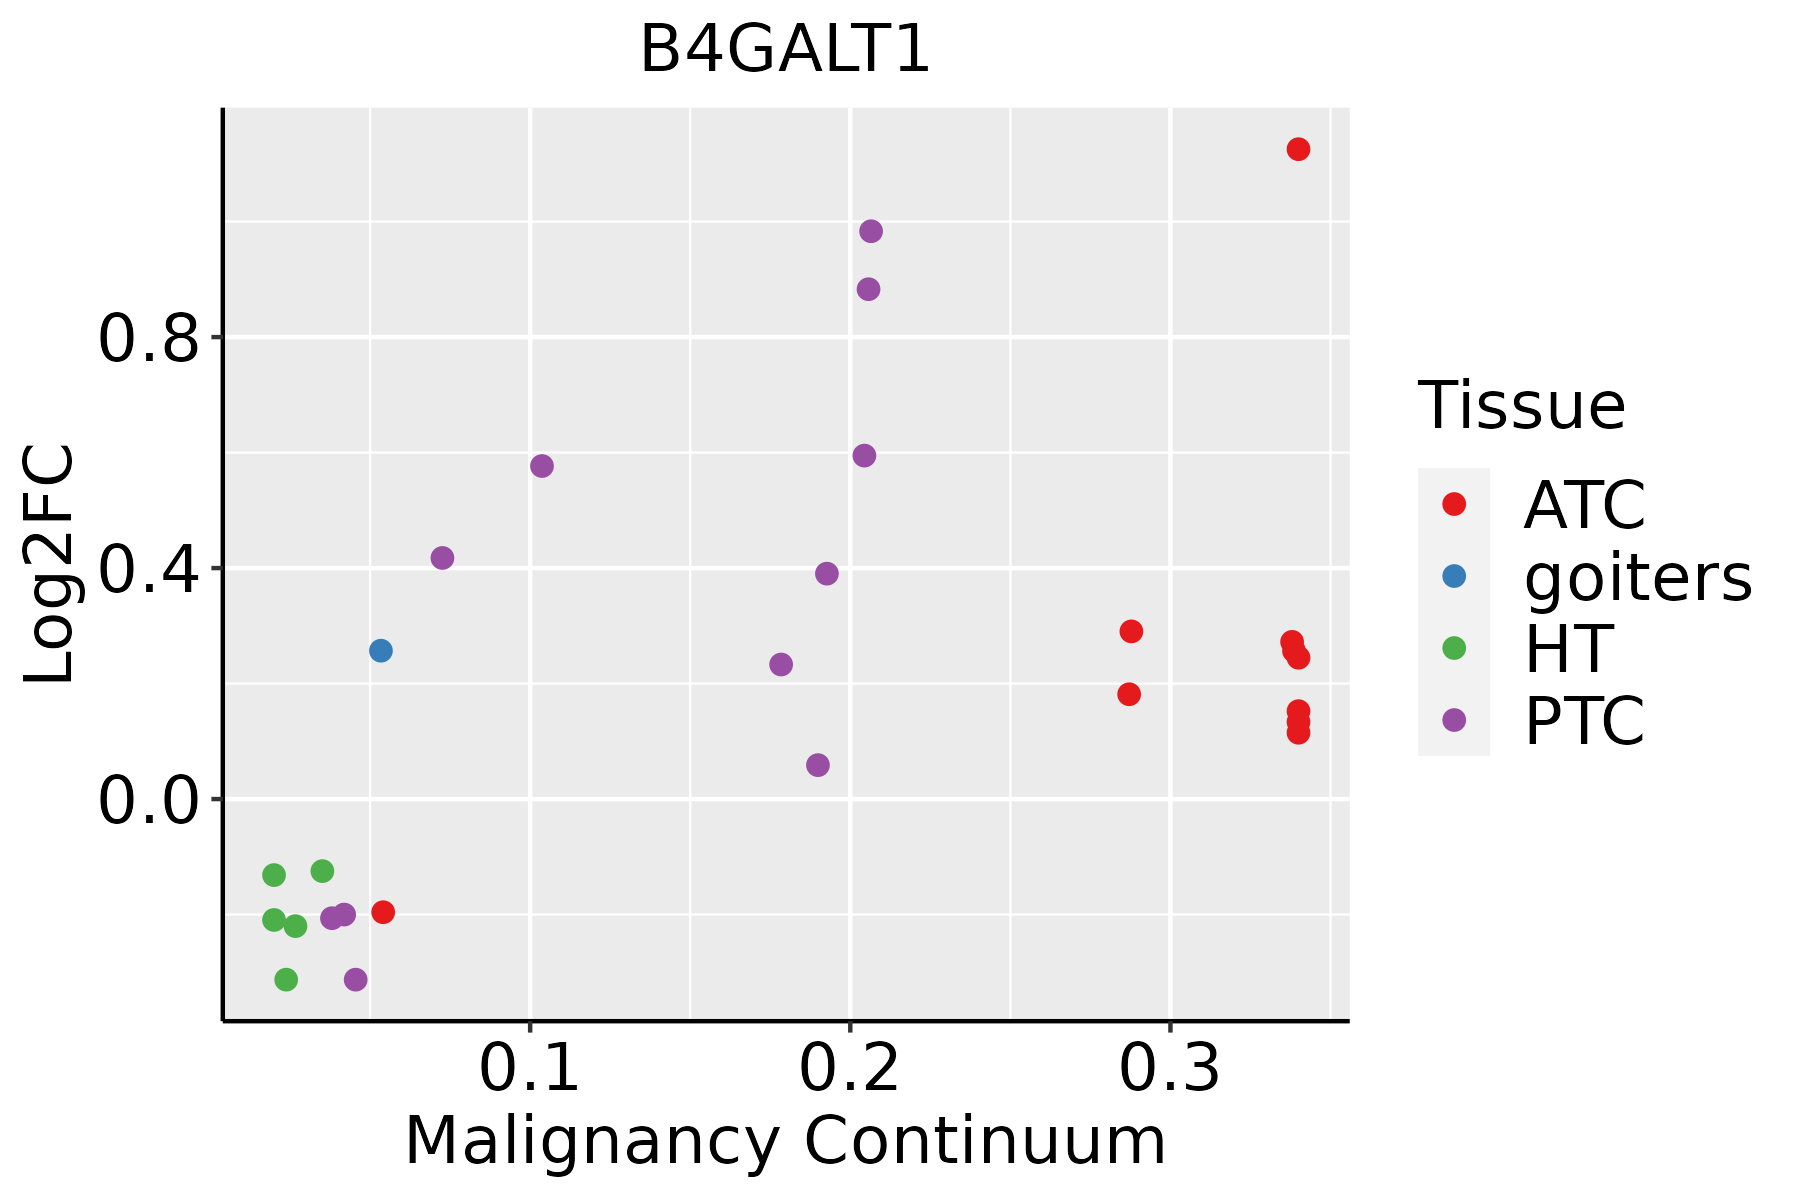 | ATC: Anaplastic thyroid cancer |
| HT: Hashimoto's thyroiditis | ||
| PTC: Papillary thyroid cancer |
| ∗log2FC in expression of this searched gene in stem-like cells from each diseased tissue sample relative to stem-like cells in normal samples in each tissue plotted against the malignancy continuum. Samples are colored based on if they are from different disease stage. |
Top |
Malignant transformation related pathway analysis |
| Find out the enriched GO biological processes and KEGG pathways involved in transition from healthy to precancer to cancer |
| Tissue | Disease Stage | Enriched GO biological Processes |
| Colorectum | AD |  |
| Colorectum | SER |  |
| Colorectum | MSS |  |
| Colorectum | MSI-H |  |
| Colorectum | FAP |  |
| ∗Top 15 enriched GO BP terms are showed in the bar plot of each disease state in each tissue. Each row represents a significant GO biological process which is colored according to the -log10(p.adjust). |
| Page: 1 2 3 4 5 6 7 8 9 |
| GO ID | Tissue | Disease Stage | Description | Gene Ratio | Bg Ratio | pvalue | p.adjust | Count |
| GO:00509006 | Breast | Precancer | leukocyte migration | 47/1080 | 369/18723 | 2.82e-07 | 1.39e-05 | 47 |
| GO:00447063 | Breast | Precancer | multi-multicellular organism process | 31/1080 | 220/18723 | 3.73e-06 | 1.19e-04 | 31 |
| GO:00420609 | Breast | Precancer | wound healing | 48/1080 | 422/18723 | 5.48e-06 | 1.63e-04 | 48 |
| GO:00506736 | Breast | Precancer | epithelial cell proliferation | 46/1080 | 437/18723 | 6.02e-05 | 1.23e-03 | 46 |
| GO:00506786 | Breast | Precancer | regulation of epithelial cell proliferation | 40/1080 | 381/18723 | 1.88e-04 | 3.03e-03 | 40 |
| GO:0035036 | Breast | Precancer | sperm-egg recognition | 10/1080 | 48/18723 | 3.43e-04 | 4.81e-03 | 10 |
| GO:0007339 | Breast | Precancer | binding of sperm to zona pellucida | 9/1080 | 40/18723 | 3.69e-04 | 5.03e-03 | 9 |
| GO:0009988 | Breast | Precancer | cell-cell recognition | 12/1080 | 68/18723 | 4.63e-04 | 6.12e-03 | 12 |
| GO:00025263 | Breast | Precancer | acute inflammatory response | 16/1080 | 112/18723 | 6.87e-04 | 8.36e-03 | 16 |
| GO:00506793 | Breast | Precancer | positive regulation of epithelial cell proliferation | 24/1080 | 207/18723 | 8.88e-04 | 1.02e-02 | 24 |
| GO:00059966 | Breast | Precancer | monosaccharide metabolic process | 27/1080 | 257/18723 | 1.94e-03 | 1.88e-02 | 27 |
| GO:00193186 | Breast | Precancer | hexose metabolic process | 25/1080 | 237/18723 | 2.64e-03 | 2.36e-02 | 25 |
| GO:00020649 | Breast | Precancer | epithelial cell development | 23/1080 | 220/18723 | 4.28e-03 | 3.35e-02 | 23 |
| GO:00447061 | Breast | IDC | multi-multicellular organism process | 41/1434 | 220/18723 | 8.58e-08 | 5.19e-06 | 41 |
| GO:005090011 | Breast | IDC | leukocyte migration | 54/1434 | 369/18723 | 3.10e-06 | 1.15e-04 | 54 |
| GO:005067313 | Breast | IDC | epithelial cell proliferation | 60/1434 | 437/18723 | 7.13e-06 | 2.15e-04 | 60 |
| GO:005067812 | Breast | IDC | regulation of epithelial cell proliferation | 54/1434 | 381/18723 | 8.07e-06 | 2.39e-04 | 54 |
| GO:004206014 | Breast | IDC | wound healing | 55/1434 | 422/18723 | 7.27e-05 | 1.45e-03 | 55 |
| GO:005067911 | Breast | IDC | positive regulation of epithelial cell proliferation | 29/1434 | 207/18723 | 1.14e-03 | 1.24e-02 | 29 |
| GO:00073391 | Breast | IDC | binding of sperm to zona pellucida | 9/1434 | 40/18723 | 2.76e-03 | 2.42e-02 | 9 |
| Page: 1 2 3 4 5 6 7 8 9 10 11 12 13 |
| Pathway ID | Tissue | Disease Stage | Description | Gene Ratio | Bg Ratio | pvalue | p.adjust | qvalue | Count |
| hsa00510 | Colorectum | AD | N-Glycan biosynthesis | 21/2092 | 53/8465 | 1.15e-02 | 4.24e-02 | 2.71e-02 | 21 |
| hsa005101 | Colorectum | AD | N-Glycan biosynthesis | 21/2092 | 53/8465 | 1.15e-02 | 4.24e-02 | 2.71e-02 | 21 |
| hsa005102 | Colorectum | MSS | N-Glycan biosynthesis | 20/1875 | 53/8465 | 7.17e-03 | 2.83e-02 | 1.73e-02 | 20 |
| hsa00513 | Colorectum | MSS | Various types of N-glycan biosynthesis | 16/1875 | 42/8465 | 1.39e-02 | 4.53e-02 | 2.77e-02 | 16 |
| hsa005103 | Colorectum | MSS | N-Glycan biosynthesis | 20/1875 | 53/8465 | 7.17e-03 | 2.83e-02 | 1.73e-02 | 20 |
| hsa005131 | Colorectum | MSS | Various types of N-glycan biosynthesis | 16/1875 | 42/8465 | 1.39e-02 | 4.53e-02 | 2.77e-02 | 16 |
| hsa00052 | Colorectum | FAP | Galactose metabolism | 12/1404 | 32/8465 | 3.61e-03 | 1.53e-02 | 9.29e-03 | 12 |
| hsa000521 | Colorectum | FAP | Galactose metabolism | 12/1404 | 32/8465 | 3.61e-03 | 1.53e-02 | 9.29e-03 | 12 |
| hsa005106 | Esophagus | HGIN | N-Glycan biosynthesis | 17/1383 | 53/8465 | 3.43e-03 | 2.54e-02 | 2.02e-02 | 17 |
| hsa0051013 | Esophagus | HGIN | N-Glycan biosynthesis | 17/1383 | 53/8465 | 3.43e-03 | 2.54e-02 | 2.02e-02 | 17 |
| hsa0051023 | Esophagus | ESCC | N-Glycan biosynthesis | 39/4205 | 53/8465 | 3.26e-04 | 1.15e-03 | 5.89e-04 | 39 |
| hsa005136 | Esophagus | ESCC | Various types of N-glycan biosynthesis | 31/4205 | 42/8465 | 1.23e-03 | 3.78e-03 | 1.93e-03 | 31 |
| hsa0051033 | Esophagus | ESCC | N-Glycan biosynthesis | 39/4205 | 53/8465 | 3.26e-04 | 1.15e-03 | 5.89e-04 | 39 |
| hsa0051313 | Esophagus | ESCC | Various types of N-glycan biosynthesis | 31/4205 | 42/8465 | 1.23e-03 | 3.78e-03 | 1.93e-03 | 31 |
| hsa005104 | Liver | Cirrhotic | N-Glycan biosynthesis | 32/2530 | 53/8465 | 3.82e-06 | 4.10e-05 | 2.53e-05 | 32 |
| hsa005134 | Liver | Cirrhotic | Various types of N-glycan biosynthesis | 26/2530 | 42/8465 | 1.65e-05 | 1.41e-04 | 8.69e-05 | 26 |
| hsa0051011 | Liver | Cirrhotic | N-Glycan biosynthesis | 32/2530 | 53/8465 | 3.82e-06 | 4.10e-05 | 2.53e-05 | 32 |
| hsa0051311 | Liver | Cirrhotic | Various types of N-glycan biosynthesis | 26/2530 | 42/8465 | 1.65e-05 | 1.41e-04 | 8.69e-05 | 26 |
| hsa0051021 | Liver | HCC | N-Glycan biosynthesis | 40/4020 | 53/8465 | 2.95e-05 | 1.87e-04 | 1.04e-04 | 40 |
| hsa005132 | Liver | HCC | Various types of N-glycan biosynthesis | 30/4020 | 42/8465 | 1.41e-03 | 5.07e-03 | 2.82e-03 | 30 |
| Page: 1 2 |
Top |
Cell-cell communication analysis |
| Identification of potential cell-cell interactions between two cell types and their ligand-receptor pairs for different disease states |
| Ligand | Receptor | LRpair | Pathway | Tissue | Disease Stage |
| Page: 1 |
Top |
Single-cell gene regulatory network inference analysis |
| Find out the significant the regulons (TFs) and the target genes of each regulon across cell types for different disease states |
| TF | Cell Type | Tissue | Disease Stage | Target Gene | RSS | Regulon Activity |
| ∗The dot plots of a searched regulon are shown for all cell subpopulations in each disease state of each tissue based on the regulon specific score inferred using pySCENIC and by calculating the average expression. |
| Page: 1 |
Top |
Somatic mutation of malignant transformation related genes |
| Annotation of somatic variants for genes involved in malignant transformation |
| Hugo Symbol | Variant Class | Variant Classification | dbSNP RS | HGVSc | HGVSp | HGVSp Short | SWISSPROT | BIOTYPE | SIFT | PolyPhen | Tumor Sample Barcode | Tissue | Histology | Sex | Age | Stage | Therapy Types | Drugs | Outcome |
| B4GALT1 | SNV | Missense_Mutation | c.548N>T | p.Pro183Leu | p.P183L | P15291 | protein_coding | deleterious(0) | probably_damaging(0.999) | TCGA-E2-A14T-01 | Breast | breast invasive carcinoma | Female | <65 | I/II | Chemotherapy | doxorubicin | SD | |
| B4GALT1 | SNV | Missense_Mutation | c.875N>C | p.Leu292Pro | p.L292P | P15291 | protein_coding | deleterious(0.04) | probably_damaging(0.997) | TCGA-E2-A158-01 | Breast | breast invasive carcinoma | Female | <65 | I/II | Chemotherapy | arimidex | SD | |
| B4GALT1 | insertion | Frame_Shift_Ins | novel | c.867_868insAGGAT | p.Ser290ArgfsTer5 | p.S290Rfs*5 | P15291 | protein_coding | TCGA-A8-A096-01 | Breast | breast invasive carcinoma | Female | >=65 | I/II | Unknown | Unknown | SD | ||
| B4GALT1 | insertion | Nonsense_Mutation | novel | c.909_910insGGAATACTTGTGCATTGCTGGTAGGAATGTA | p.Pro304GlyfsTer8 | p.P304Gfs*8 | P15291 | protein_coding | TCGA-A8-A0A1-01 | Breast | breast invasive carcinoma | Female | >=65 | I/II | Hormone Therapy | tamoxiphen | SD | ||
| B4GALT1 | insertion | In_Frame_Ins | novel | c.1150_1151insCCCACCCACAGGGCTGTCTGTCACAAACCCACCTCTGTTGGG | p.Tyr384delinsSerHisProGlnGlyCysLeuSerGlnThrHisLeuCysTrpAsp | p.Y384delinsSHPQGCLSQTHLCWD | P15291 | protein_coding | TCGA-AN-A0G0-01 | Breast | breast invasive carcinoma | Female | <65 | I/II | Unknown | Unknown | SD | ||
| B4GALT1 | SNV | Missense_Mutation | novel | c.125N>A | p.Leu42Gln | p.L42Q | P15291 | protein_coding | deleterious(0) | probably_damaging(0.968) | TCGA-DS-A1OA-01 | Cervix | cervical & endocervical cancer | Female | >=65 | I/II | Chemotherapy | carboplatin | PD |
| B4GALT1 | SNV | Missense_Mutation | novel | c.125N>A | p.Leu42Gln | p.L42Q | P15291 | protein_coding | deleterious(0) | probably_damaging(0.968) | TCGA-DS-A1OB-01 | Cervix | cervical & endocervical cancer | Female | <65 | I/II | Chemotherapy | carboplatin | PD |
| B4GALT1 | insertion | Frame_Shift_Ins | novel | c.123_124insAGGG | p.Leu42ArgfsTer72 | p.L42Rfs*72 | P15291 | protein_coding | TCGA-DS-A1OA-01 | Cervix | cervical & endocervical cancer | Female | >=65 | I/II | Chemotherapy | carboplatin | PD | ||
| B4GALT1 | insertion | Frame_Shift_Ins | novel | c.123_124insAGGG | p.Leu42ArgfsTer72 | p.L42Rfs*72 | P15291 | protein_coding | TCGA-DS-A1OB-01 | Cervix | cervical & endocervical cancer | Female | <65 | I/II | Chemotherapy | carboplatin | PD | ||
| B4GALT1 | deletion | Frame_Shift_Del | c.790delN | p.Ser264HisfsTer29 | p.S264Hfs*29 | P15291 | protein_coding | TCGA-EA-A410-01 | Cervix | cervical & endocervical cancer | Female | <65 | I/II | Unknown | Unknown | SD |
| Page: 1 2 3 4 5 |
Top |
Related drugs of malignant transformation related genes |
| Identification of chemicals and drugs interact with genes involved in malignant transfromation |
| (DGIdb 4.0) |
| Entrez ID | Symbol | Category | Interaction Types | Drug Claim Name | Drug Name | PMIDs |
| Page: 1 |

Copyright 2023-Present -The University of Texas Health Science Center at Houston |