
|
|||||
|
 | |
| |
| |
| |
| |
| |
|
Gene: B4GALNT1 |
Gene summary for B4GALNT1 |
| Gene information | Species | Human | Gene symbol | B4GALNT1 | Gene ID | 2583 |
| Gene name | beta-1,4-N-acetyl-galactosaminyltransferase 1 | |
| Gene Alias | GALGT | |
| Cytomap | 12q13.3 | |
| Gene Type | protein-coding | GO ID | GO:0000003 | UniProtAcc | Q00973 |
Top |
Malignant transformation analysis |
| Identification of the aberrant gene expression in precancerous and cancerous lesions by comparing the gene expression of stem-like cells in diseased tissues with normal stem cells |
| Entrez ID | Symbol | Replicates | Species | Organ | Tissue | Adj P-value | Log2FC | Malignancy |
| 2583 | B4GALNT1 | LZE4T | Human | Esophagus | ESCC | 1.70e-03 | 1.42e-01 | 0.0811 |
| 2583 | B4GALNT1 | LZE7T | Human | Esophagus | ESCC | 6.33e-03 | 1.95e-01 | 0.0667 |
| 2583 | B4GALNT1 | P2T-E | Human | Esophagus | ESCC | 1.88e-04 | 1.38e-01 | 0.1177 |
| 2583 | B4GALNT1 | P4T-E | Human | Esophagus | ESCC | 7.21e-12 | 2.79e-01 | 0.1323 |
| 2583 | B4GALNT1 | P5T-E | Human | Esophagus | ESCC | 1.66e-02 | 1.04e-01 | 0.1327 |
| 2583 | B4GALNT1 | P9T-E | Human | Esophagus | ESCC | 2.30e-02 | 1.01e-01 | 0.1131 |
| 2583 | B4GALNT1 | P11T-E | Human | Esophagus | ESCC | 6.27e-12 | 3.76e-01 | 0.1426 |
| 2583 | B4GALNT1 | P12T-E | Human | Esophagus | ESCC | 1.78e-03 | 9.03e-02 | 0.1122 |
| 2583 | B4GALNT1 | P15T-E | Human | Esophagus | ESCC | 1.32e-06 | 1.92e-01 | 0.1149 |
| 2583 | B4GALNT1 | P16T-E | Human | Esophagus | ESCC | 7.90e-03 | 9.63e-02 | 0.1153 |
| 2583 | B4GALNT1 | P19T-E | Human | Esophagus | ESCC | 1.65e-10 | 5.72e-01 | 0.1662 |
| 2583 | B4GALNT1 | P20T-E | Human | Esophagus | ESCC | 3.97e-02 | 1.01e-01 | 0.1124 |
| 2583 | B4GALNT1 | P21T-E | Human | Esophagus | ESCC | 3.19e-23 | 5.30e-01 | 0.1617 |
| 2583 | B4GALNT1 | P22T-E | Human | Esophagus | ESCC | 6.56e-15 | 2.80e-01 | 0.1236 |
| 2583 | B4GALNT1 | P24T-E | Human | Esophagus | ESCC | 2.05e-07 | 1.92e-01 | 0.1287 |
| 2583 | B4GALNT1 | P26T-E | Human | Esophagus | ESCC | 1.62e-13 | 2.80e-01 | 0.1276 |
| 2583 | B4GALNT1 | P28T-E | Human | Esophagus | ESCC | 1.96e-05 | 1.16e-01 | 0.1149 |
| 2583 | B4GALNT1 | P30T-E | Human | Esophagus | ESCC | 2.31e-10 | 3.56e-01 | 0.137 |
| 2583 | B4GALNT1 | P31T-E | Human | Esophagus | ESCC | 8.56e-12 | 2.79e-01 | 0.1251 |
| 2583 | B4GALNT1 | P32T-E | Human | Esophagus | ESCC | 2.87e-41 | 7.56e-01 | 0.1666 |
| Page: 1 2 3 |
| Tissue | Expression Dynamics | Abbreviation |
| Esophagus |  | ESCC: Esophageal squamous cell carcinoma |
| HGIN: High-grade intraepithelial neoplasias | ||
| LGIN: Low-grade intraepithelial neoplasias | ||
| Oral Cavity | 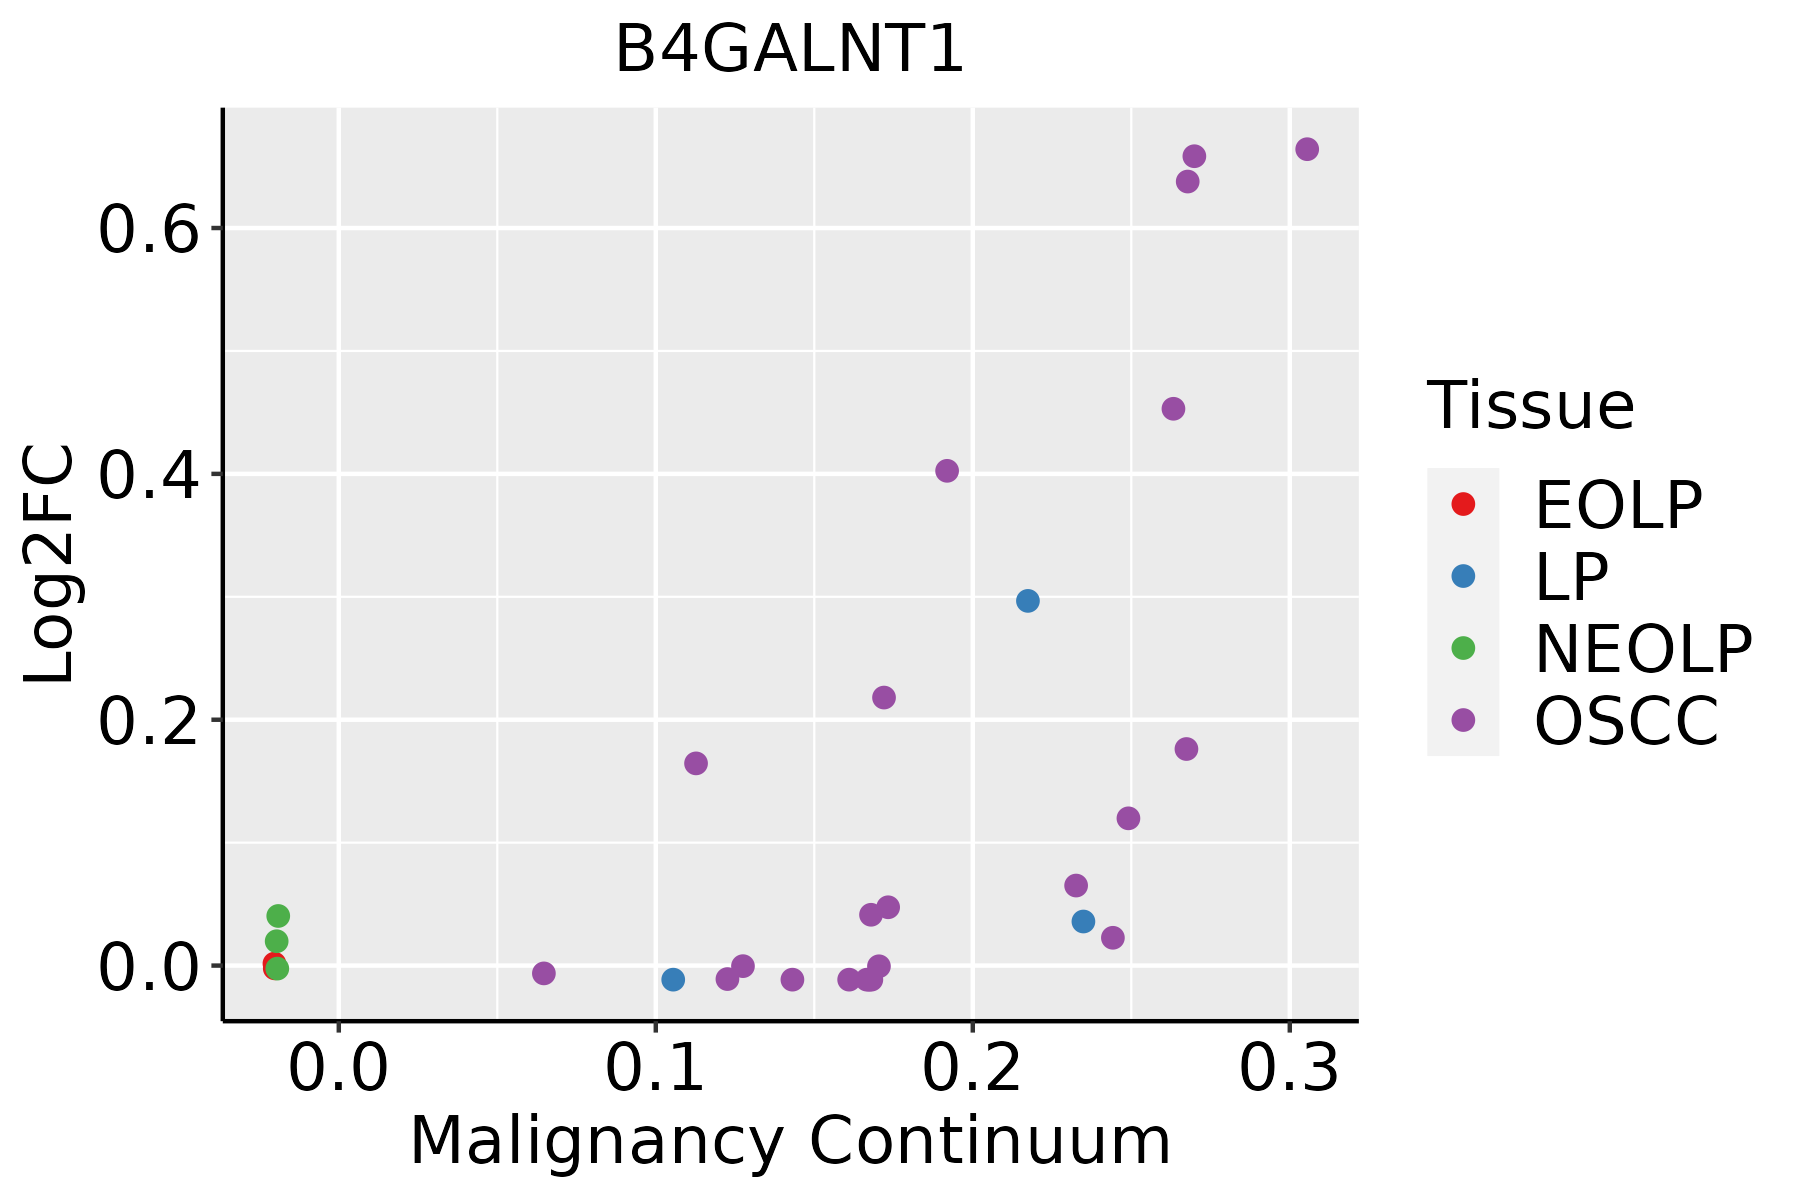 | EOLP: Erosive Oral lichen planus |
| LP: leukoplakia | ||
| NEOLP: Non-erosive oral lichen planus | ||
| OSCC: Oral squamous cell carcinoma |
| ∗log2FC in expression of this searched gene in stem-like cells from each diseased tissue sample relative to stem-like cells in normal samples in each tissue plotted against the malignancy continuum. Samples are colored based on if they are from different disease stage. |
Top |
Malignant transformation related pathway analysis |
| Find out the enriched GO biological processes and KEGG pathways involved in transition from healthy to precancer to cancer |
| Tissue | Disease Stage | Enriched GO biological Processes |
| Colorectum | AD |  |
| Colorectum | SER |  |
| Colorectum | MSS |  |
| Colorectum | MSI-H |  |
| Colorectum | FAP |  |
| ∗Top 15 enriched GO BP terms are showed in the bar plot of each disease state in each tissue. Each row represents a significant GO biological process which is colored according to the -log10(p.adjust). |
| Page: 1 2 3 4 5 6 7 8 9 |
| GO ID | Tissue | Disease Stage | Description | Gene Ratio | Bg Ratio | pvalue | p.adjust | Count |
| GO:0051235110 | Esophagus | ESCC | maintenance of location | 200/8552 | 327/18723 | 1.01e-08 | 2.02e-07 | 200 |
| GO:00066433 | Esophagus | ESCC | membrane lipid metabolic process | 130/8552 | 203/18723 | 9.29e-08 | 1.54e-06 | 130 |
| GO:00700854 | Esophagus | ESCC | glycosylation | 144/8552 | 240/18723 | 5.12e-06 | 5.38e-05 | 144 |
| GO:00464673 | Esophagus | ESCC | membrane lipid biosynthetic process | 91/8552 | 142/18723 | 7.19e-06 | 7.19e-05 | 91 |
| GO:00066652 | Esophagus | ESCC | sphingolipid metabolic process | 96/8552 | 155/18723 | 3.21e-05 | 2.66e-04 | 96 |
| GO:00199155 | Esophagus | ESCC | lipid storage | 58/8552 | 87/18723 | 6.15e-05 | 4.72e-04 | 58 |
| GO:00066642 | Esophagus | ESCC | glycolipid metabolic process | 63/8552 | 100/18723 | 3.55e-04 | 2.06e-03 | 63 |
| GO:19035092 | Esophagus | ESCC | liposaccharide metabolic process | 63/8552 | 101/18723 | 5.25e-04 | 2.90e-03 | 63 |
| GO:00301481 | Esophagus | ESCC | sphingolipid biosynthetic process | 62/8552 | 103/18723 | 2.10e-03 | 9.38e-03 | 62 |
| GO:00066721 | Esophagus | ESCC | ceramide metabolic process | 61/8552 | 102/18723 | 2.82e-03 | 1.19e-02 | 61 |
| GO:00302586 | Esophagus | ESCC | lipid modification | 116/8552 | 212/18723 | 4.90e-03 | 1.89e-02 | 116 |
| GO:0009247 | Esophagus | ESCC | glycolipid biosynthetic process | 42/8552 | 68/18723 | 5.48e-03 | 2.05e-02 | 42 |
| GO:0046513 | Esophagus | ESCC | ceramide biosynthetic process | 40/8552 | 65/18723 | 7.25e-03 | 2.63e-02 | 40 |
| GO:005123518 | Oral cavity | OSCC | maintenance of location | 182/7305 | 327/18723 | 6.16e-10 | 1.58e-08 | 182 |
| GO:00066432 | Oral cavity | OSCC | membrane lipid metabolic process | 111/7305 | 203/18723 | 4.02e-06 | 4.69e-05 | 111 |
| GO:00066651 | Oral cavity | OSCC | sphingolipid metabolic process | 84/7305 | 155/18723 | 8.64e-05 | 6.61e-04 | 84 |
| GO:00464672 | Oral cavity | OSCC | membrane lipid biosynthetic process | 77/7305 | 142/18723 | 1.63e-04 | 1.13e-03 | 77 |
| GO:00700853 | Oral cavity | OSCC | glycosylation | 117/7305 | 240/18723 | 1.29e-03 | 6.42e-03 | 117 |
| GO:00199154 | Oral cavity | OSCC | lipid storage | 48/7305 | 87/18723 | 1.60e-03 | 7.62e-03 | 48 |
| GO:00066641 | Oral cavity | OSCC | glycolipid metabolic process | 53/7305 | 100/18723 | 3.09e-03 | 1.33e-02 | 53 |
| Page: 1 2 |
| Pathway ID | Tissue | Disease Stage | Description | Gene Ratio | Bg Ratio | pvalue | p.adjust | qvalue | Count |
| hsa006003 | Esophagus | ESCC | Sphingolipid metabolism | 36/4205 | 53/8465 | 5.41e-03 | 1.36e-02 | 6.99e-03 | 36 |
| hsa0060012 | Esophagus | ESCC | Sphingolipid metabolism | 36/4205 | 53/8465 | 5.41e-03 | 1.36e-02 | 6.99e-03 | 36 |
| hsa006002 | Oral cavity | OSCC | Sphingolipid metabolism | 33/3704 | 53/8465 | 5.00e-03 | 1.20e-02 | 6.13e-03 | 33 |
| hsa0060011 | Oral cavity | OSCC | Sphingolipid metabolism | 33/3704 | 53/8465 | 5.00e-03 | 1.20e-02 | 6.13e-03 | 33 |
| Page: 1 |
Top |
Cell-cell communication analysis |
| Identification of potential cell-cell interactions between two cell types and their ligand-receptor pairs for different disease states |
| Ligand | Receptor | LRpair | Pathway | Tissue | Disease Stage |
| Page: 1 |
Top |
Single-cell gene regulatory network inference analysis |
| Find out the significant the regulons (TFs) and the target genes of each regulon across cell types for different disease states |
| TF | Cell Type | Tissue | Disease Stage | Target Gene | RSS | Regulon Activity |
| ∗The dot plots of a searched regulon are shown for all cell subpopulations in each disease state of each tissue based on the regulon specific score inferred using pySCENIC and by calculating the average expression. |
| Page: 1 |
Top |
Somatic mutation of malignant transformation related genes |
| Annotation of somatic variants for genes involved in malignant transformation |
| Hugo Symbol | Variant Class | Variant Classification | dbSNP RS | HGVSc | HGVSp | HGVSp Short | SWISSPROT | BIOTYPE | SIFT | PolyPhen | Tumor Sample Barcode | Tissue | Histology | Sex | Age | Stage | Therapy Types | Drugs | Outcome |
| B4GALNT1 | SNV | Missense_Mutation | novel | c.109N>T | p.Leu37Phe | p.L37F | Q00973 | protein_coding | tolerated(0.54) | benign(0.136) | TCGA-BH-A0B6-01 | Breast | breast invasive carcinoma | Female | <65 | I/II | Unknown | Unknown | SD |
| B4GALNT1 | insertion | Frame_Shift_Ins | rs778572229 | c.263dupG | p.Leu89ProfsTer13 | p.L89Pfs*13 | Q00973 | protein_coding | TCGA-BH-A0HA-01 | Breast | breast invasive carcinoma | Female | <65 | I/II | Unknown | Unknown | SD | ||
| B4GALNT1 | deletion | Frame_Shift_Del | novel | c.1039delN | p.Val347Ter | p.V347* | Q00973 | protein_coding | TCGA-D8-A27V-01 | Breast | breast invasive carcinoma | Female | <65 | I/II | Hormone Therapy | tamoxiphen | SD | ||
| B4GALNT1 | deletion | Frame_Shift_Del | novel | c.605delN | p.Gly202ValfsTer52 | p.G202Vfs*52 | Q00973 | protein_coding | TCGA-EW-A2FV-01 | Breast | breast invasive carcinoma | Female | <65 | III/IV | Chemotherapy | docetaxel | SD | ||
| B4GALNT1 | SNV | Missense_Mutation | rs200510000 | c.767C>T | p.Pro256Leu | p.P256L | Q00973 | protein_coding | deleterious(0.03) | benign(0.005) | TCGA-A6-2679-01 | Colorectum | colon adenocarcinoma | Female | >=65 | I/II | Unknown | Unknown | SD |
| B4GALNT1 | SNV | Missense_Mutation | c.1339N>T | p.Arg447Cys | p.R447C | Q00973 | protein_coding | deleterious(0) | probably_damaging(0.945) | TCGA-A6-2686-01 | Colorectum | colon adenocarcinoma | Female | >=65 | I/II | Unknown | Unknown | SD | |
| B4GALNT1 | SNV | Missense_Mutation | rs774565348 | c.862N>T | p.Arg288Cys | p.R288C | Q00973 | protein_coding | deleterious(0) | probably_damaging(1) | TCGA-A6-5661-01 | Colorectum | colon adenocarcinoma | Female | >=65 | I/II | Unknown | Unknown | SD |
| B4GALNT1 | SNV | Missense_Mutation | c.415N>T | p.Ala139Ser | p.A139S | Q00973 | protein_coding | deleterious(0.02) | possibly_damaging(0.539) | TCGA-AA-3715-01 | Colorectum | colon adenocarcinoma | Male | >=65 | I/II | Unknown | Unknown | PD | |
| B4GALNT1 | SNV | Missense_Mutation | c.1481N>T | p.Arg494Met | p.R494M | Q00973 | protein_coding | tolerated(0.12) | benign(0.258) | TCGA-AY-6197-01 | Colorectum | colon adenocarcinoma | Male | <65 | I/II | Unknown | Unknown | SD | |
| B4GALNT1 | SNV | Missense_Mutation | c.1447N>T | p.His483Tyr | p.H483Y | Q00973 | protein_coding | deleterious(0) | probably_damaging(0.997) | TCGA-AZ-4615-01 | Colorectum | colon adenocarcinoma | Male | >=65 | III/IV | Chemotherapy | xeloda | PD |
| Page: 1 2 3 4 5 6 7 8 |
Top |
Related drugs of malignant transformation related genes |
| Identification of chemicals and drugs interact with genes involved in malignant transfromation |
| (DGIdb 4.0) |
| Entrez ID | Symbol | Category | Interaction Types | Drug Claim Name | Drug Name | PMIDs |
| 2583 | B4GALNT1 | ENZYME | antibody | DINUTUXIMAB | DINUTUXIMAB |
| Page: 1 |

Copyright 2023-Present -The University of Texas Health Science Center at Houston |