
|
|||||
|
 | |
| |
| |
| |
| |
| |
|
Gene: B3GNT9 |
Gene summary for B3GNT9 |
| Gene information | Species | Human | Gene symbol | B3GNT9 | Gene ID | 84752 |
| Gene name | UDP-GlcNAc:betaGal beta-1,3-N-acetylglucosaminyltransferase 9 | |
| Gene Alias | B3GNT9 | |
| Cytomap | 16q22.1 | |
| Gene Type | protein-coding | GO ID | GO:0000271 | UniProtAcc | Q6UX72 |
Top |
Malignant transformation analysis |
| Identification of the aberrant gene expression in precancerous and cancerous lesions by comparing the gene expression of stem-like cells in diseased tissues with normal stem cells |
| Entrez ID | Symbol | Replicates | Species | Organ | Tissue | Adj P-value | Log2FC | Malignancy |
| 84752 | B3GNT9 | C21 | Human | Oral cavity | OSCC | 1.68e-06 | 2.85e-01 | 0.2678 |
| 84752 | B3GNT9 | C30 | Human | Oral cavity | OSCC | 1.81e-23 | 9.96e-01 | 0.3055 |
| 84752 | B3GNT9 | C57 | Human | Oral cavity | OSCC | 2.26e-02 | 1.63e-01 | 0.1679 |
| 84752 | B3GNT9 | C06 | Human | Oral cavity | OSCC | 1.71e-05 | 5.27e-01 | 0.2699 |
| 84752 | B3GNT9 | C08 | Human | Oral cavity | OSCC | 1.20e-09 | 1.89e-01 | 0.1919 |
| 84752 | B3GNT9 | C09 | Human | Oral cavity | OSCC | 2.35e-02 | 1.03e-01 | 0.1431 |
| 84752 | B3GNT9 | LN46 | Human | Oral cavity | OSCC | 9.12e-05 | 2.29e-01 | 0.1666 |
| Page: 1 |
| Tissue | Expression Dynamics | Abbreviation |
| Oral Cavity | 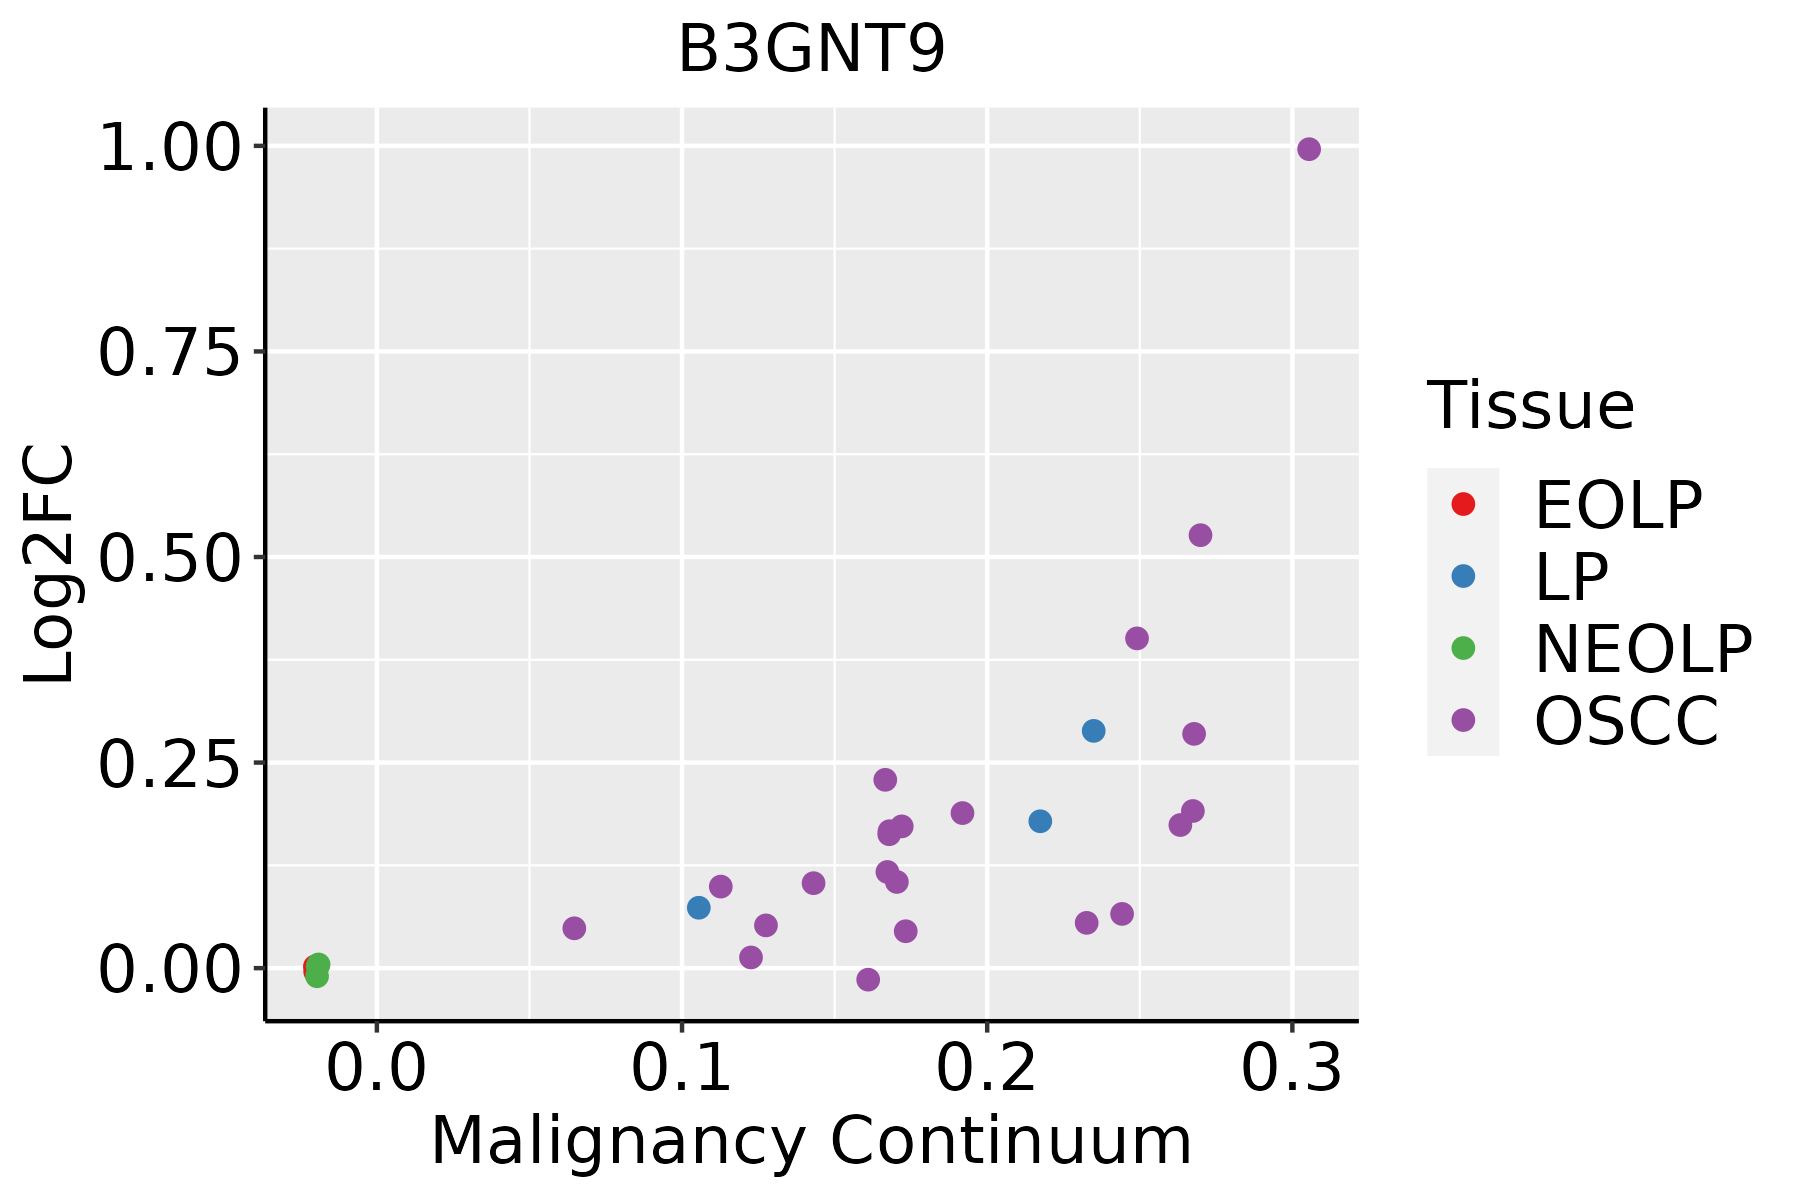 | EOLP: Erosive Oral lichen planus |
| LP: leukoplakia | ||
| NEOLP: Non-erosive oral lichen planus | ||
| OSCC: Oral squamous cell carcinoma |
| ∗log2FC in expression of this searched gene in stem-like cells from each diseased tissue sample relative to stem-like cells in normal samples in each tissue plotted against the malignancy continuum. Samples are colored based on if they are from different disease stage. |
Top |
Malignant transformation related pathway analysis |
| Find out the enriched GO biological processes and KEGG pathways involved in transition from healthy to precancer to cancer |
| Tissue | Disease Stage | Enriched GO biological Processes |
| Colorectum | AD |  |
| Colorectum | SER |  |
| Colorectum | MSS |  |
| Colorectum | MSI-H |  |
| Colorectum | FAP |  |
| ∗Top 15 enriched GO BP terms are showed in the bar plot of each disease state in each tissue. Each row represents a significant GO biological process which is colored according to the -log10(p.adjust). |
| Page: 1 2 3 4 5 6 7 8 9 |
| GO ID | Tissue | Disease Stage | Description | Gene Ratio | Bg Ratio | pvalue | p.adjust | Count |
| GO:00091001 | Oral cavity | OSCC | glycoprotein metabolic process | 185/7305 | 387/18723 | 2.37e-04 | 1.54e-03 | 185 |
| GO:00091011 | Oral cavity | OSCC | glycoprotein biosynthetic process | 151/7305 | 317/18723 | 1.01e-03 | 5.26e-03 | 151 |
| GO:00064864 | Oral cavity | OSCC | protein glycosylation | 111/7305 | 226/18723 | 1.22e-03 | 6.10e-03 | 111 |
| GO:00434134 | Oral cavity | OSCC | macromolecule glycosylation | 111/7305 | 226/18723 | 1.22e-03 | 6.10e-03 | 111 |
| GO:00700853 | Oral cavity | OSCC | glycosylation | 117/7305 | 240/18723 | 1.29e-03 | 6.42e-03 | 117 |
| GO:00160513 | Oral cavity | OSCC | carbohydrate biosynthetic process | 97/7305 | 202/18723 | 5.50e-03 | 2.13e-02 | 97 |
| GO:00442625 | Oral cavity | OSCC | cellular carbohydrate metabolic process | 130/7305 | 283/18723 | 9.98e-03 | 3.49e-02 | 130 |
| Page: 1 |
| Pathway ID | Tissue | Disease Stage | Description | Gene Ratio | Bg Ratio | pvalue | p.adjust | qvalue | Count |
| Page: 1 |
Top |
Cell-cell communication analysis |
| Identification of potential cell-cell interactions between two cell types and their ligand-receptor pairs for different disease states |
| Ligand | Receptor | LRpair | Pathway | Tissue | Disease Stage |
| Page: 1 |
Top |
Single-cell gene regulatory network inference analysis |
| Find out the significant the regulons (TFs) and the target genes of each regulon across cell types for different disease states |
| TF | Cell Type | Tissue | Disease Stage | Target Gene | RSS | Regulon Activity |
| ∗The dot plots of a searched regulon are shown for all cell subpopulations in each disease state of each tissue based on the regulon specific score inferred using pySCENIC and by calculating the average expression. |
| Page: 1 |
Top |
Somatic mutation of malignant transformation related genes |
| Annotation of somatic variants for genes involved in malignant transformation |
| Hugo Symbol | Variant Class | Variant Classification | dbSNP RS | HGVSc | HGVSp | HGVSp Short | SWISSPROT | BIOTYPE | SIFT | PolyPhen | Tumor Sample Barcode | Tissue | Histology | Sex | Age | Stage | Therapy Types | Drugs | Outcome |
| B3GNT9 | SNV | Missense_Mutation | c.746N>T | p.Ala249Val | p.A249V | Q6UX72 | protein_coding | tolerated(0.35) | benign(0.153) | TCGA-AO-A0JB-01 | Breast | breast invasive carcinoma | Female | <65 | III/IV | Chemotherapy | cyclophosphamide | SD | |
| B3GNT9 | SNV | Missense_Mutation | novel | c.656G>A | p.Cys219Tyr | p.C219Y | Q6UX72 | protein_coding | deleterious(0) | probably_damaging(0.998) | TCGA-AO-A0JG-01 | Breast | breast invasive carcinoma | Female | <65 | III/IV | Chemotherapy | doxorubicin | SD |
| B3GNT9 | SNV | Missense_Mutation | novel | c.884C>T | p.Ser295Phe | p.S295F | Q6UX72 | protein_coding | deleterious(0) | probably_damaging(0.996) | TCGA-B6-A0X1-01 | Breast | breast invasive carcinoma | Female | <65 | I/II | Unknown | Unknown | PD |
| B3GNT9 | SNV | Missense_Mutation | novel | c.1180G>A | p.Ala394Thr | p.A394T | Q6UX72 | protein_coding | tolerated(0.81) | benign(0.003) | TCGA-2W-A8YY-01 | Cervix | cervical & endocervical cancer | Female | <65 | I/II | Chemotherapy | cisplatin | CR |
| B3GNT9 | SNV | Missense_Mutation | c.997C>T | p.His333Tyr | p.H333Y | Q6UX72 | protein_coding | deleterious(0) | probably_damaging(1) | TCGA-EK-A2PG-01 | Cervix | cervical & endocervical cancer | Female | >=65 | I/II | Unknown | Unknown | SD | |
| B3GNT9 | SNV | Missense_Mutation | c.736N>T | p.Arg246Trp | p.R246W | Q6UX72 | protein_coding | deleterious(0.03) | benign(0.07) | TCGA-A6-3808-01 | Colorectum | colon adenocarcinoma | Male | >=65 | I/II | Unknown | Unknown | SD | |
| B3GNT9 | SNV | Missense_Mutation | rs759175026 | c.784N>T | p.Arg262Trp | p.R262W | Q6UX72 | protein_coding | deleterious(0) | benign(0.333) | TCGA-AA-3821-01 | Colorectum | colon adenocarcinoma | Female | >=65 | I/II | Unknown | Unknown | SD |
| B3GNT9 | SNV | Missense_Mutation | c.535N>T | p.Arg179Cys | p.R179C | Q6UX72 | protein_coding | deleterious(0) | possibly_damaging(0.892) | TCGA-AA-3821-01 | Colorectum | colon adenocarcinoma | Female | >=65 | I/II | Unknown | Unknown | SD | |
| B3GNT9 | SNV | Missense_Mutation | novel | c.592N>A | p.Asp198Asn | p.D198N | Q6UX72 | protein_coding | tolerated(0.37) | benign(0.041) | TCGA-AA-A00N-01 | Colorectum | colon adenocarcinoma | Male | >=65 | I/II | Unknown | Unknown | PD |
| B3GNT9 | SNV | Missense_Mutation | novel | c.946N>A | p.Asp316Asn | p.D316N | Q6UX72 | protein_coding | deleterious(0) | probably_damaging(1) | TCGA-AZ-4315-01 | Colorectum | colon adenocarcinoma | Male | <65 | I/II | Unknown | Unknown | SD |
| Page: 1 2 3 4 |
Top |
Related drugs of malignant transformation related genes |
| Identification of chemicals and drugs interact with genes involved in malignant transfromation |
| (DGIdb 4.0) |
| Entrez ID | Symbol | Category | Interaction Types | Drug Claim Name | Drug Name | PMIDs |
| Page: 1 |

Copyright 2023-Present -The University of Texas Health Science Center at Houston |