Schematic overview of the cellular and molecular mechanisms involved in the cancer progression, including the proposed cellular and molecular mechanisms in cancer cells trajectory. AT1: alveolar type 1 cells; AT2: alveolar type 2 cells; AAH: atypical adenomatous hyperplasia; AIS: adenocarcinoma in situ; MIA: minimally invasive adenocarcinoma; IA: invasive adenocarcinoma; EMT: epithelial-mesenchymal transition

Home

Download

Statistics

Help

Contact

Center for Computational Systems Medicine
leaf

Gene summary

leaf

Malignant transformation analysis

leaf

Malignant transformation related pathway analysis

leaf

Cell-cell communication analysis

leaf

Single-cell gene regulatory network inference analysis

leaf

Somatic mutation of malignant transformation related genes

leaf

Related drugs of malignant transformation related genes

Gene: B3GNT5

Gene summary for B3GNT5

check button Gene summary.

Gene informationSpeciesHuman
Gene symbol

B3GNT5

Gene ID

84002

Gene nameUDP-GlcNAc:betaGal beta-1,3-N-acetylglucosaminyltransferase 5
Gene AliasB3GN-T5
Cytomap3q27.1
Gene Typeprotein-coding
GO ID

GO:0006464

UniProtAcc

Q9BYG0


Top

Malignant transformation analysis

check button Identification of the aberrant gene expression in precancerous and cancerous lesions by comparing the gene expression of stem-like cells in diseased tissues with normal stem cells
check button Malignant transformation involving gene list.
Entrez IDSymbolReplicatesSpeciesOrganTissueAdj P-valueLog2FCMalignancy
84002B3GNT5LZE4THumanEsophagusESCC3.01e-108.57e-010.0811
84002B3GNT5LZE5THumanEsophagusESCC1.73e-031.71e-010.0514
84002B3GNT5LZE8THumanEsophagusESCC3.65e-042.77e-010.067
84002B3GNT5LZE24THumanEsophagusESCC1.46e-097.53e-010.0596
84002B3GNT5LZE21THumanEsophagusESCC1.39e-041.06e+000.0655
84002B3GNT5P1T-EHumanEsophagusESCC3.45e-041.20e+000.0875
84002B3GNT5P2T-EHumanEsophagusESCC2.22e-438.35e-010.1177
84002B3GNT5P4T-EHumanEsophagusESCC1.08e-251.21e+000.1323
84002B3GNT5P5T-EHumanEsophagusESCC1.19e-195.61e-010.1327
84002B3GNT5P8T-EHumanEsophagusESCC6.93e-277.25e-010.0889
84002B3GNT5P9T-EHumanEsophagusESCC5.91e-239.59e-010.1131
84002B3GNT5P10T-EHumanEsophagusESCC1.70e-171.48e-010.116
84002B3GNT5P11T-EHumanEsophagusESCC1.99e-051.11e+000.1426
84002B3GNT5P12T-EHumanEsophagusESCC3.41e-852.35e+000.1122
84002B3GNT5P15T-EHumanEsophagusESCC7.05e-227.47e-010.1149
84002B3GNT5P16T-EHumanEsophagusESCC3.45e-22-7.37e-020.1153
84002B3GNT5P20T-EHumanEsophagusESCC1.04e-125.93e-010.1124
84002B3GNT5P21T-EHumanEsophagusESCC4.84e-276.20e-010.1617
84002B3GNT5P22T-EHumanEsophagusESCC1.67e-194.79e-010.1236
84002B3GNT5P23T-EHumanEsophagusESCC7.03e-361.84e+000.108
Page: 1 2 3 4 5 6 

check button Transcriptomic changes along malignancy continuum.
TissueExpression DynamicsAbbreviation
EsophagusThe image shows the transcriptomic changes along malignancy continuum.log2FC in expression of this searched gene in stem-like cells from each diseased tissue sample relative to stem-like cells in normal samples in each tissue plotted against the malignancy continuum. Samples are colored based on if they are from different disease stage.
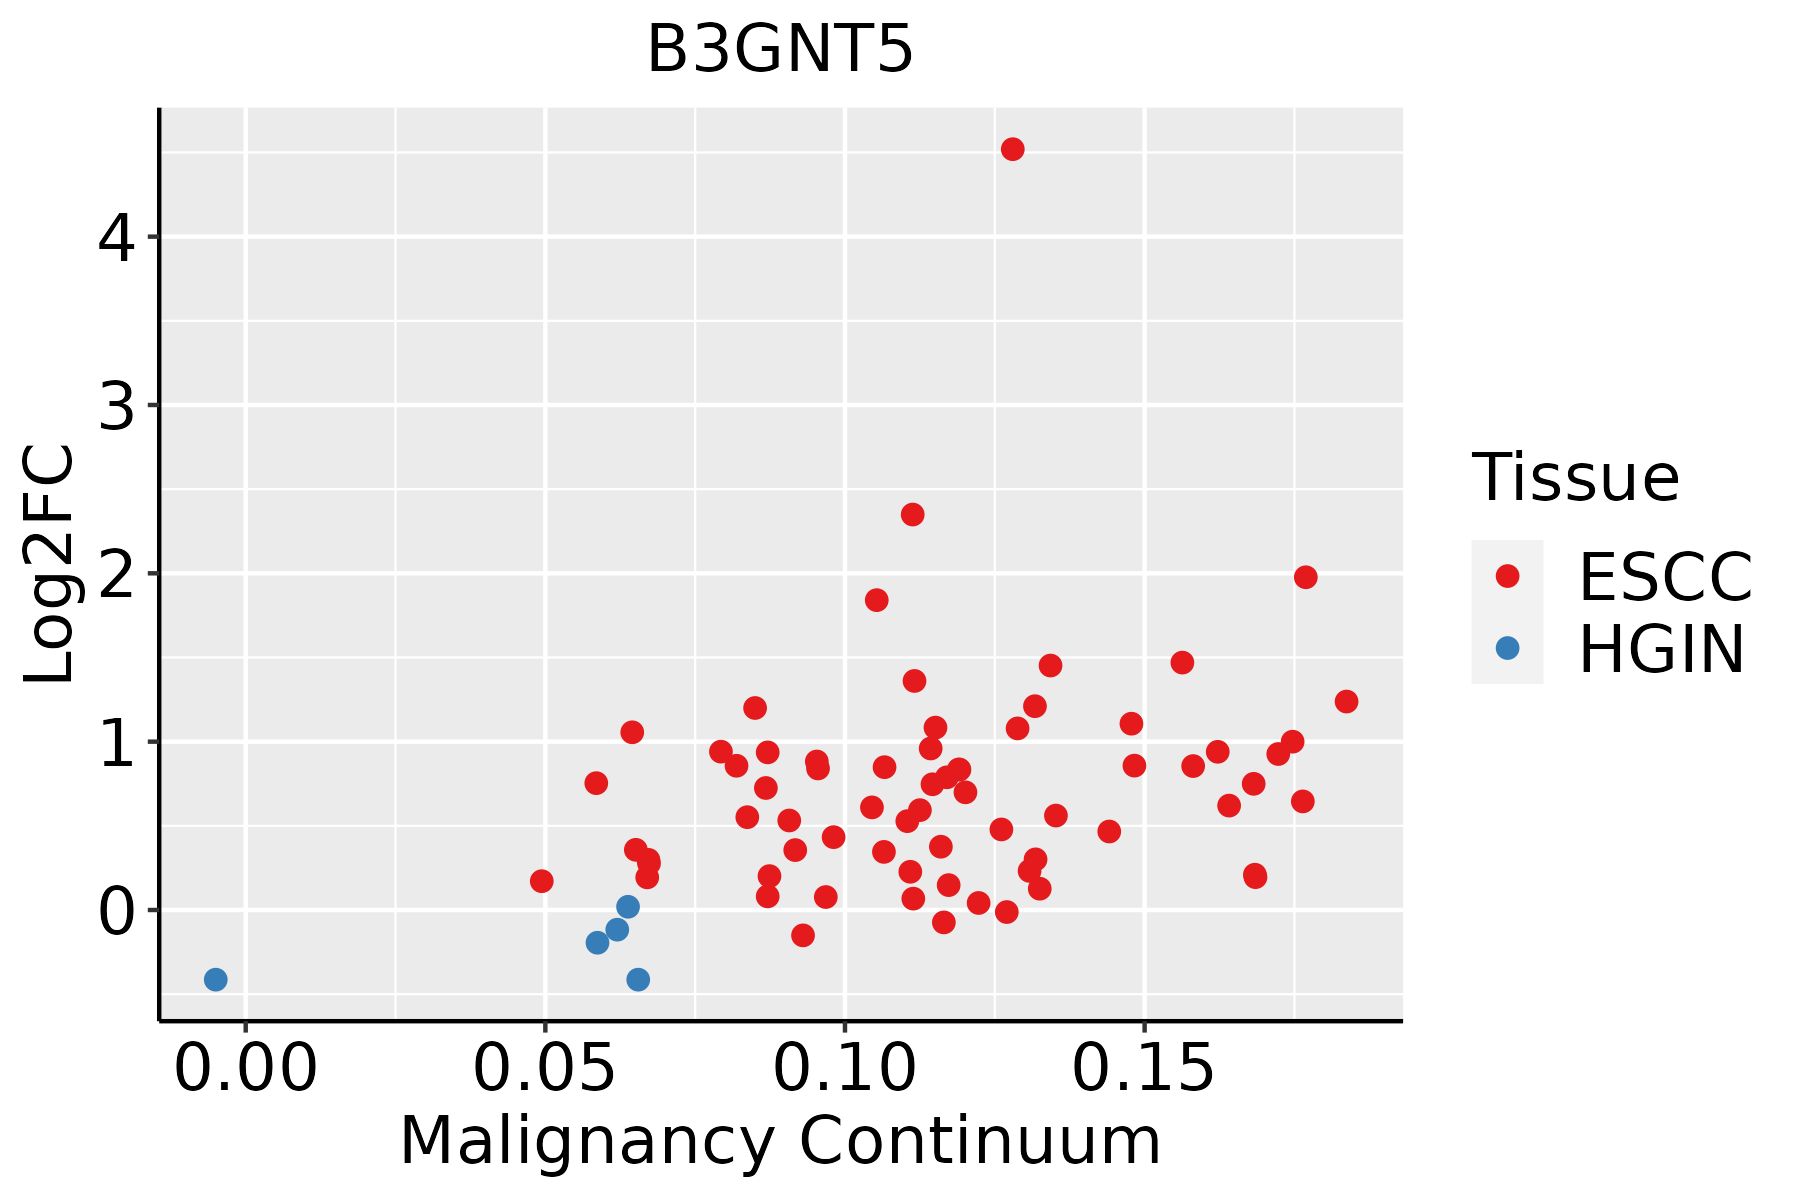
ESCC: Esophageal squamous cell carcinoma
HGIN: High-grade intraepithelial neoplasias
LGIN: Low-grade intraepithelial neoplasias
GCThe image shows the transcriptomic changes along malignancy continuum.log2FC in expression of this searched gene in stem-like cells from each diseased tissue sample relative to stem-like cells in normal samples in each tissue plotted against the malignancy continuum. Samples are colored based on if they are from different disease stage.CAG: Chronic atrophic gastritis
CAG with IM: Chronic atrophic gastritis with intestinal metaplasia
CSG: Chronic superficial gastritis
GC: Gastric cancer
SIM: Severe intestinal metaplasia
WIM: Wild intestinal metaplasia
LiverThe image shows the transcriptomic changes along malignancy continuum.log2FC in expression of this searched gene in stem-like cells from each diseased tissue sample relative to stem-like cells in normal samples in each tissue plotted against the malignancy continuum. Samples are colored based on if they are from different disease stage.
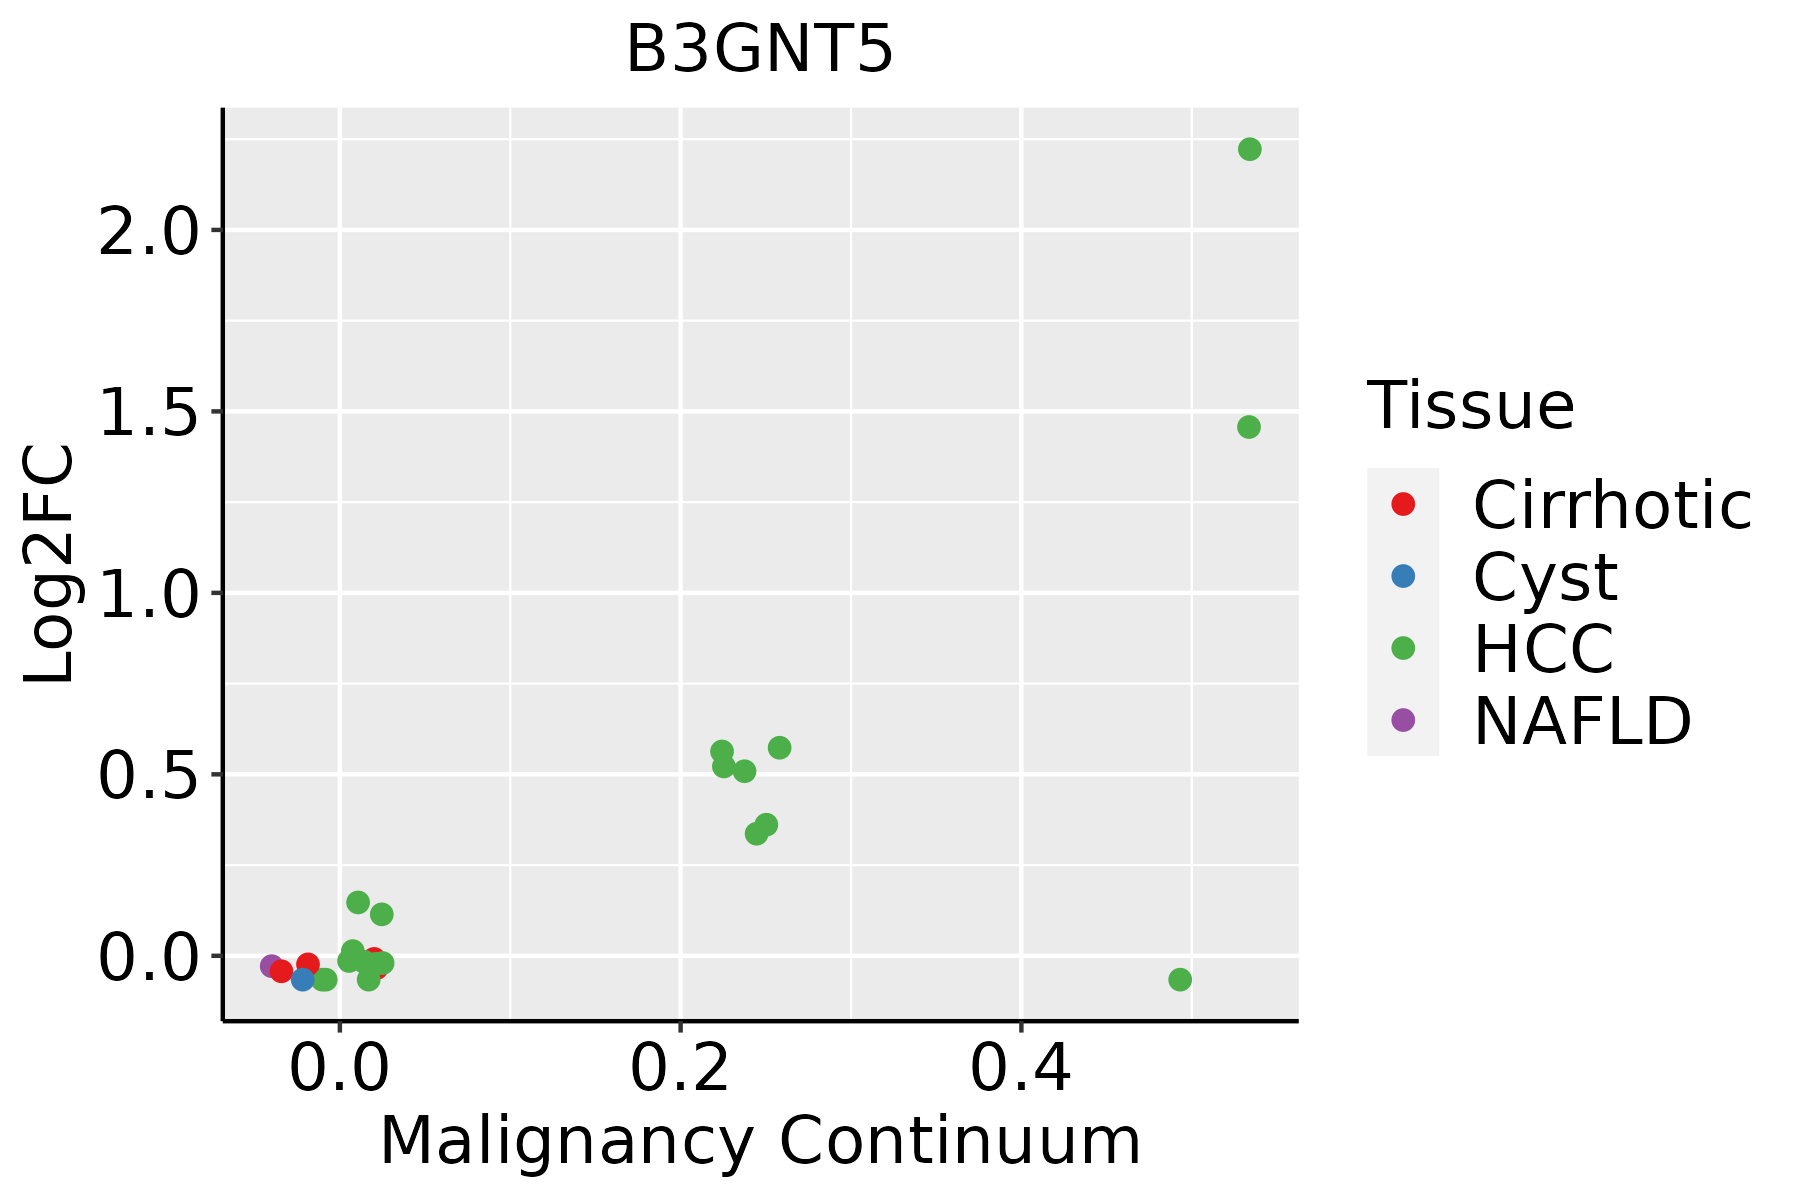
HCC: Hepatocellular carcinoma
NAFLD: Non-alcoholic fatty liver disease
Oral CavityThe image shows the transcriptomic changes along malignancy continuum.log2FC in expression of this searched gene in stem-like cells from each diseased tissue sample relative to stem-like cells in normal samples in each tissue plotted against the malignancy continuum. Samples are colored based on if they are from different disease stage.EOLP: Erosive Oral lichen planus
LP: leukoplakia
NEOLP: Non-erosive oral lichen planus
OSCC: Oral squamous cell carcinoma
SkinThe image shows the transcriptomic changes along malignancy continuum.log2FC in expression of this searched gene in stem-like cells from each diseased tissue sample relative to stem-like cells in normal samples in each tissue plotted against the malignancy continuum. Samples are colored based on if they are from different disease stage.AK: Actinic keratosis
cSCC: Cutaneous squamous cell carcinoma
SCCIS:squamous cell carcinoma in situ
∗log2FC in expression of this searched gene in stem-like cells from each diseased tissue sample relative to stem-like cells in normal samples in each tissue plotted against the malignancy continuum. Samples are colored based on if they are from different disease stage.

Top

Malignant transformation related pathway analysis

check buttonFind out the enriched GO biological processes and KEGG pathways involved in transition from healthy to precancer to cancer
check button Figure of enriched GO biological processes.
TissueDisease StageEnriched GO biological Processes
ColorectumADGO analysis - Figure of enriched GO biological processes: Top 15 enriched GO BP terms are showed in the bar plot of each disease state in each tissue. Each row represents a significant GO biological process which is colored according to the -log10(p.adjust).
ColorectumSERGO analysis - Figure of enriched GO biological processes: Top 15 enriched GO BP terms are showed in the bar plot of each disease state in each tissue. Each row represents a significant GO biological process which is colored according to the -log10(p.adjust).
ColorectumMSSGO analysis - Figure of enriched GO biological processes: Top 15 enriched GO BP terms are showed in the bar plot of each disease state in each tissue. Each row represents a significant GO biological process which is colored according to the -log10(p.adjust).
ColorectumMSI-HGO analysis - Figure of enriched GO biological processes: Top 15 enriched GO BP terms are showed in the bar plot of each disease state in each tissue. Each row represents a significant GO biological process which is colored according to the -log10(p.adjust).
ColorectumFAPGO analysis - Figure of enriched GO biological processes: Top 15 enriched GO BP terms are showed in the bar plot of each disease state in each tissue. Each row represents a significant GO biological process which is colored according to the -log10(p.adjust).
∗Top 15 enriched GO BP terms are showed in the bar plot of each disease state in each tissue. Each row represents a significant GO biological process which is colored according to the -log10(p.adjust).
Page: 1 2 3 4 5 6 7 8 9 

check button Enriched GO biological processes.
GO IDTissueDisease StageDescriptionGene RatioBg Ratiopvaluep.adjustCount
GO:00066433EsophagusESCCmembrane lipid metabolic process130/8552203/187239.29e-081.54e-06130
GO:00091002EsophagusESCCglycoprotein metabolic process226/8552387/187232.64e-073.94e-06226
GO:00700854EsophagusESCCglycosylation144/8552240/187235.12e-065.38e-05144
GO:00464673EsophagusESCCmembrane lipid biosynthetic process91/8552142/187237.19e-067.19e-0591
GO:00064865EsophagusESCCprotein glycosylation135/8552226/187231.36e-051.24e-04135
GO:00434135EsophagusESCCmacromolecule glycosylation135/8552226/187231.36e-051.24e-04135
GO:00091012EsophagusESCCglycoprotein biosynthetic process181/8552317/187232.54e-052.15e-04181
GO:00066642EsophagusESCCglycolipid metabolic process63/8552100/187233.55e-042.06e-0363
GO:19035092EsophagusESCCliposaccharide metabolic process63/8552101/187235.25e-042.90e-0363
GO:0009247EsophagusESCCglycolipid biosynthetic process42/855268/187235.48e-032.05e-0242
GO:00064931EsophagusESCCprotein O-linked glycosylation51/855286/187237.54e-032.70e-0251
GO:00066431LiverHCCmembrane lipid metabolic process115/7958203/187233.17e-053.22e-04115
GO:00064862LiverHCCprotein glycosylation122/7958226/187233.11e-042.21e-03122
GO:00434132LiverHCCmacromolecule glycosylation122/7958226/187233.11e-042.21e-03122
GO:00700852LiverHCCglycosylation128/7958240/187234.35e-042.92e-03128
GO:0046467LiverHCCmembrane lipid biosynthetic process78/7958142/187231.85e-039.46e-0378
GO:0009100LiverHCCglycoprotein metabolic process193/7958387/187231.89e-039.62e-03193
GO:0006664LiverHCCglycolipid metabolic process57/7958100/187232.40e-031.17e-0257
GO:1903509LiverHCCliposaccharide metabolic process57/7958101/187233.25e-031.49e-0257
GO:00066432Oral cavityOSCCmembrane lipid metabolic process111/7305203/187234.02e-064.69e-05111
Page: 1 2 

check button Enriched KEGG pathways.
Pathway IDTissueDisease StageDescriptionGene RatioBg Ratiopvaluep.adjustqvalueCount
Page: 1 

Top

Cell-cell communication analysis

check buttonIdentification of potential cell-cell interactions between two cell types and their ligand-receptor pairs for different disease states
LigandReceptorLRpairPathwayTissueDisease Stage
Page: 1 

Top

Single-cell gene regulatory network inference analysis

check buttonFind out the significant the regulons (TFs) and the target genes of each regulon across cell types for different disease states
TFCell TypeTissueDisease StageTarget GeneRSSRegulon Activity
∗The dot plots of a searched regulon are shown for all cell subpopulations in each disease state of each tissue based on the regulon specific score inferred using pySCENIC and by calculating the average expression.
Page: 1 

Top

Somatic mutation of malignant transformation related genes

check buttonAnnotation of somatic variants for genes involved in malignant transformation
Hugo SymbolVariant ClassVariant ClassificationdbSNP RSHGVScHGVSpHGVSp ShortSWISSPROTBIOTYPESIFTPolyPhenTumor Sample BarcodeTissueHistologySexAgeStageTherapy TypesDrugsOutcome
B3GNT5SNVMissense_Mutationc.190N>Gp.Leu64Valp.L64VQ9BYG0protein_codingtolerated(0.54)benign(0)TCGA-AC-A23H-01Breastbreast invasive carcinomaFemale>=65I/IIUnknownUnknownPD
B3GNT5SNVMissense_Mutationnovelc.1021N>Tp.Val341Leup.V341LQ9BYG0protein_codingtolerated(0.68)benign(0.123)TCGA-AN-A046-01Breastbreast invasive carcinomaFemale>=65I/IIUnknownUnknownSD
B3GNT5SNVMissense_Mutationc.448G>Cp.Asp150Hisp.D150HQ9BYG0protein_codingtolerated(0.07)benign(0.231)TCGA-C8-A26Y-01Breastbreast invasive carcinomaFemale>=65I/IIUnknownUnknownSD
B3GNT5SNVMissense_Mutationrs750480690c.787G>Ap.Asp263Asnp.D263NQ9BYG0protein_codingtolerated(0.28)probably_damaging(0.996)TCGA-C8-A26Y-01Breastbreast invasive carcinomaFemale>=65I/IIUnknownUnknownSD
B3GNT5insertionNonsense_Mutationnovelc.1010_1011insCTTCTTCTCAGTCCAAATAGAAGCAAACCCAGGTTGTATCTGp.Thr337_Asp338insPhePheSerValGlnIleGluAlaAsnProGlyCysIleTerp.T337_D338insFFSVQIEANPGCI*Q9BYG0protein_codingTCGA-A7-A0CG-01Breastbreast invasive carcinomaFemale>=65I/IIUnknownUnknownSD
B3GNT5SNVMissense_Mutationc.565C>Gp.Leu189Valp.L189VQ9BYG0protein_codingtolerated(0.24)benign(0.019)TCGA-C5-A2LY-01Cervixcervical & endocervical cancerFemale<65I/IIChemotherapycisplatinSD
B3GNT5SNVMissense_Mutationc.451N>Gp.Gln151Glup.Q151EQ9BYG0protein_codingtolerated(0.3)benign(0.003)TCGA-EK-A2PM-01Cervixcervical & endocervical cancerFemale>=65I/IIUnknownUnknownSD
B3GNT5insertionFrame_Shift_Insnovelc.87_88insTp.Trp32LeufsTer6p.W32Lfs*6Q9BYG0protein_codingTCGA-EA-A410-01Cervixcervical & endocervical cancerFemale<65I/IIUnknownUnknownSD
B3GNT5SNVMissense_Mutationc.565N>Ap.Leu189Ilep.L189IQ9BYG0protein_codingtolerated(0.2)benign(0.019)TCGA-AA-3977-01Colorectumcolon adenocarcinomaMale>=65I/IIUnknownUnknownSD
B3GNT5SNVMissense_Mutationnovelc.453N>Tp.Gln151Hisp.Q151HQ9BYG0protein_codingtolerated(0.2)benign(0.007)TCGA-AM-5820-01Colorectumcolon adenocarcinomaFemale<65I/IIUnknownUnknownSD
Page: 1 2 3 4 5 

Top

Related drugs of malignant transformation related genes

check buttonIdentification of chemicals and drugs interact with genes involved in malignant transfromation
(DGIdb 4.0)
Entrez IDSymbolCategoryInteraction TypesDrug Claim NameDrug NamePMIDs
Page: 1