
|
|||||
|
 | |
| |
| |
| |
| |
| |
|
Gene: B3GNT3 |
Gene summary for B3GNT3 |
| Gene information | Species | Human | Gene symbol | B3GNT3 | Gene ID | 10331 |
| Gene name | UDP-GlcNAc:betaGal beta-1,3-N-acetylglucosaminyltransferase 3 | |
| Gene Alias | B3GAL-T8 | |
| Cytomap | 19p13.11 | |
| Gene Type | protein-coding | GO ID | GO:0000271 | UniProtAcc | Q9Y2A9 |
Top |
Malignant transformation analysis |
| Identification of the aberrant gene expression in precancerous and cancerous lesions by comparing the gene expression of stem-like cells in diseased tissues with normal stem cells |
| Entrez ID | Symbol | Replicates | Species | Organ | Tissue | Adj P-value | Log2FC | Malignancy |
| 10331 | B3GNT3 | HTA11_411_2000001011 | Human | Colorectum | SER | 1.08e-02 | 7.13e-01 | -0.2602 |
| 10331 | B3GNT3 | HTA11_2112_2000001011 | Human | Colorectum | SER | 2.20e-05 | 7.56e-01 | -0.2196 |
| 10331 | B3GNT3 | HTA11_3361_2000001011 | Human | Colorectum | AD | 8.98e-05 | 2.99e-01 | -0.1207 |
| 10331 | B3GNT3 | HTA11_696_2000001011 | Human | Colorectum | AD | 1.18e-05 | 3.76e-01 | -0.1464 |
| 10331 | B3GNT3 | HTA11_7696_3000711011 | Human | Colorectum | AD | 3.71e-02 | 1.82e-01 | 0.0674 |
| 10331 | B3GNT3 | HTA11_99999971662_82457 | Human | Colorectum | MSS | 3.78e-02 | 2.50e-01 | 0.3859 |
| 10331 | B3GNT3 | HTA11_99999974143_84620 | Human | Colorectum | MSS | 5.35e-04 | 2.77e-01 | 0.3005 |
| 10331 | B3GNT3 | LZE22T | Human | Esophagus | ESCC | 3.35e-02 | 4.77e-01 | 0.068 |
| 10331 | B3GNT3 | LZE24T | Human | Esophagus | ESCC | 1.10e-12 | 5.45e-01 | 0.0596 |
| 10331 | B3GNT3 | P5T-E | Human | Esophagus | ESCC | 2.10e-02 | 1.56e-02 | 0.1327 |
| 10331 | B3GNT3 | P8T-E | Human | Esophagus | ESCC | 6.31e-56 | 1.34e+00 | 0.0889 |
| 10331 | B3GNT3 | P15T-E | Human | Esophagus | ESCC | 3.32e-02 | 1.21e-01 | 0.1149 |
| 10331 | B3GNT3 | P17T-E | Human | Esophagus | ESCC | 3.93e-04 | 2.32e-01 | 0.1278 |
| 10331 | B3GNT3 | P21T-E | Human | Esophagus | ESCC | 2.31e-12 | 2.95e-01 | 0.1617 |
| 10331 | B3GNT3 | P23T-E | Human | Esophagus | ESCC | 1.17e-08 | 5.40e-01 | 0.108 |
| 10331 | B3GNT3 | P24T-E | Human | Esophagus | ESCC | 1.61e-02 | 6.88e-02 | 0.1287 |
| 10331 | B3GNT3 | P28T-E | Human | Esophagus | ESCC | 1.03e-07 | 1.03e-01 | 0.1149 |
| 10331 | B3GNT3 | P39T-E | Human | Esophagus | ESCC | 2.12e-09 | 3.10e-01 | 0.0894 |
| 10331 | B3GNT3 | P54T-E | Human | Esophagus | ESCC | 5.37e-13 | 4.57e-01 | 0.0975 |
| 10331 | B3GNT3 | P57T-E | Human | Esophagus | ESCC | 3.04e-16 | 3.86e-01 | 0.0926 |
| Page: 1 2 |
| Tissue | Expression Dynamics | Abbreviation |
| Colorectum (GSE201348) |  | FAP: Familial adenomatous polyposis |
| CRC: Colorectal cancer | ||
| Colorectum (HTA11) |  | AD: Adenomas |
| SER: Sessile serrated lesions | ||
| MSI-H: Microsatellite-high colorectal cancer | ||
| MSS: Microsatellite stable colorectal cancer | ||
| Esophagus |  | ESCC: Esophageal squamous cell carcinoma |
| HGIN: High-grade intraepithelial neoplasias | ||
| LGIN: Low-grade intraepithelial neoplasias | ||
| Liver | 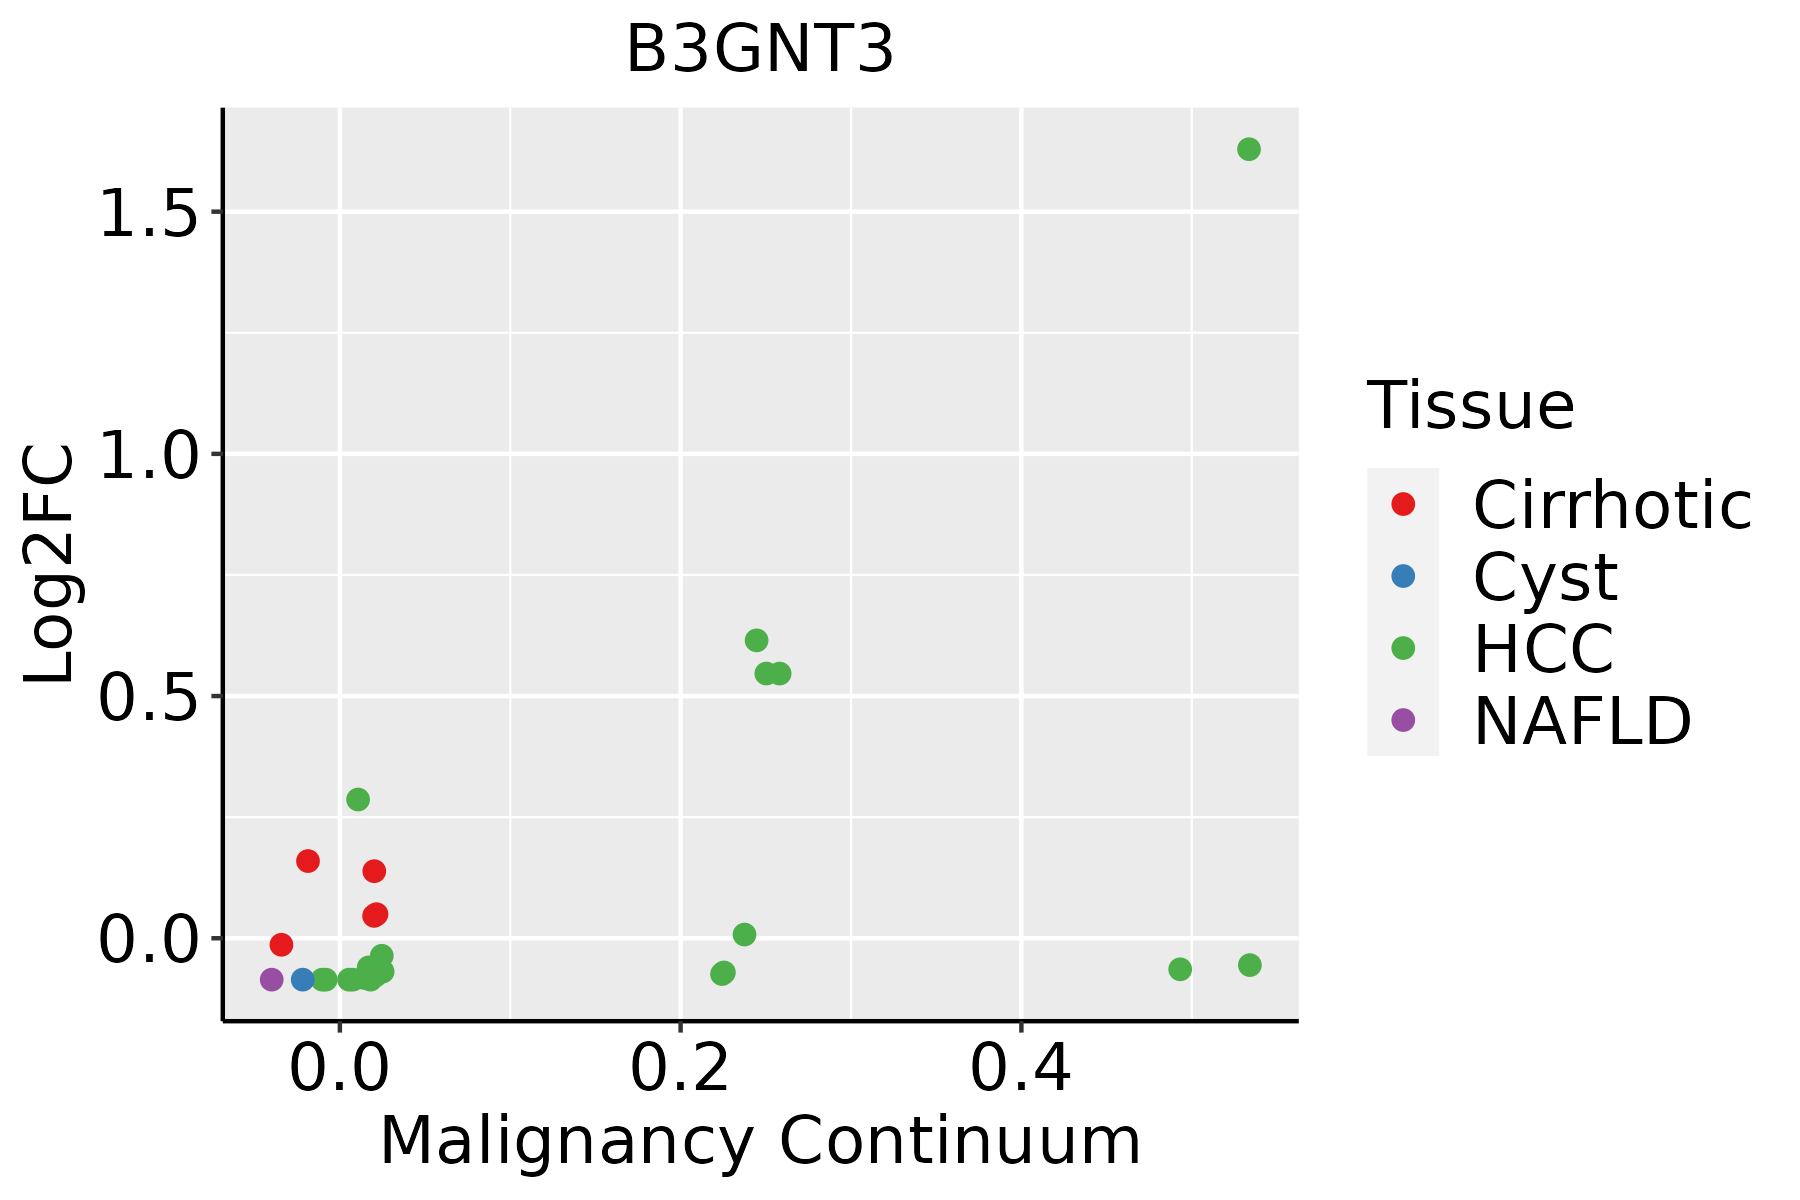 | HCC: Hepatocellular carcinoma |
| NAFLD: Non-alcoholic fatty liver disease |
| ∗log2FC in expression of this searched gene in stem-like cells from each diseased tissue sample relative to stem-like cells in normal samples in each tissue plotted against the malignancy continuum. Samples are colored based on if they are from different disease stage. |
Top |
Malignant transformation related pathway analysis |
| Find out the enriched GO biological processes and KEGG pathways involved in transition from healthy to precancer to cancer |
| Tissue | Disease Stage | Enriched GO biological Processes |
| Colorectum | AD |  |
| Colorectum | SER |  |
| Colorectum | MSS |  |
| Colorectum | MSI-H |  |
| Colorectum | FAP |  |
| ∗Top 15 enriched GO BP terms are showed in the bar plot of each disease state in each tissue. Each row represents a significant GO biological process which is colored according to the -log10(p.adjust). |
| Page: 1 2 3 4 5 6 7 8 9 |
| GO ID | Tissue | Disease Stage | Description | Gene Ratio | Bg Ratio | pvalue | p.adjust | Count |
| GO:0044262 | Colorectum | AD | cellular carbohydrate metabolic process | 87/3918 | 283/18723 | 6.00e-05 | 1.01e-03 | 87 |
| GO:0006790 | Colorectum | AD | sulfur compound metabolic process | 101/3918 | 339/18723 | 6.46e-05 | 1.07e-03 | 101 |
| GO:0006486 | Colorectum | AD | protein glycosylation | 64/3918 | 226/18723 | 4.86e-03 | 3.27e-02 | 64 |
| GO:0043413 | Colorectum | AD | macromolecule glycosylation | 64/3918 | 226/18723 | 4.86e-03 | 3.27e-02 | 64 |
| GO:0070085 | Colorectum | AD | glycosylation | 67/3918 | 240/18723 | 5.78e-03 | 3.67e-02 | 67 |
| GO:00067901 | Colorectum | SER | sulfur compound metabolic process | 73/2897 | 339/18723 | 1.75e-03 | 1.81e-02 | 73 |
| GO:00067902 | Colorectum | MSS | sulfur compound metabolic process | 85/3467 | 339/18723 | 1.52e-03 | 1.39e-02 | 85 |
| GO:00091002 | Esophagus | ESCC | glycoprotein metabolic process | 226/8552 | 387/18723 | 2.64e-07 | 3.94e-06 | 226 |
| GO:00067906 | Esophagus | ESCC | sulfur compound metabolic process | 201/8552 | 339/18723 | 2.64e-07 | 3.94e-06 | 201 |
| GO:00442725 | Esophagus | ESCC | sulfur compound biosynthetic process | 96/8552 | 148/18723 | 1.86e-06 | 2.16e-05 | 96 |
| GO:00700854 | Esophagus | ESCC | glycosylation | 144/8552 | 240/18723 | 5.12e-06 | 5.38e-05 | 144 |
| GO:00064865 | Esophagus | ESCC | protein glycosylation | 135/8552 | 226/18723 | 1.36e-05 | 1.24e-04 | 135 |
| GO:00434135 | Esophagus | ESCC | macromolecule glycosylation | 135/8552 | 226/18723 | 1.36e-05 | 1.24e-04 | 135 |
| GO:00091012 | Esophagus | ESCC | glycoprotein biosynthetic process | 181/8552 | 317/18723 | 2.54e-05 | 2.15e-04 | 181 |
| GO:00442626 | Esophagus | ESCC | cellular carbohydrate metabolic process | 160/8552 | 283/18723 | 1.43e-04 | 9.66e-04 | 160 |
| GO:00160514 | Esophagus | ESCC | carbohydrate biosynthetic process | 117/8552 | 202/18723 | 2.96e-04 | 1.79e-03 | 117 |
| GO:00064931 | Esophagus | ESCC | protein O-linked glycosylation | 51/8552 | 86/18723 | 7.54e-03 | 2.70e-02 | 51 |
| GO:0006024 | Esophagus | ESCC | glycosaminoglycan biosynthetic process | 45/8552 | 75/18723 | 8.75e-03 | 3.08e-02 | 45 |
| GO:0006023 | Esophagus | ESCC | aminoglycan biosynthetic process | 47/8552 | 79/18723 | 9.29e-03 | 3.23e-02 | 47 |
| GO:00346372 | Esophagus | ESCC | cellular carbohydrate biosynthetic process | 46/8552 | 78/18723 | 1.24e-02 | 4.13e-02 | 46 |
| Page: 1 2 |
| Pathway ID | Tissue | Disease Stage | Description | Gene Ratio | Bg Ratio | pvalue | p.adjust | qvalue | Count |
| Page: 1 |
Top |
Cell-cell communication analysis |
| Identification of potential cell-cell interactions between two cell types and their ligand-receptor pairs for different disease states |
| Ligand | Receptor | LRpair | Pathway | Tissue | Disease Stage |
| Page: 1 |
Top |
Single-cell gene regulatory network inference analysis |
| Find out the significant the regulons (TFs) and the target genes of each regulon across cell types for different disease states |
| TF | Cell Type | Tissue | Disease Stage | Target Gene | RSS | Regulon Activity |
| ∗The dot plots of a searched regulon are shown for all cell subpopulations in each disease state of each tissue based on the regulon specific score inferred using pySCENIC and by calculating the average expression. |
| Page: 1 |
Top |
Somatic mutation of malignant transformation related genes |
| Annotation of somatic variants for genes involved in malignant transformation |
| Hugo Symbol | Variant Class | Variant Classification | dbSNP RS | HGVSc | HGVSp | HGVSp Short | SWISSPROT | BIOTYPE | SIFT | PolyPhen | Tumor Sample Barcode | Tissue | Histology | Sex | Age | Stage | Therapy Types | Drugs | Outcome |
| B3GNT3 | SNV | Missense_Mutation | c.766N>C | p.Glu256Gln | p.E256Q | Q9Y2A9 | protein_coding | tolerated(0.57) | benign(0.027) | TCGA-A8-A06T-01 | Breast | breast invasive carcinoma | Female | >=65 | III/IV | Hormone Therapy | anastrozole | SD | |
| B3GNT3 | SNV | Missense_Mutation | c.383N>A | p.Arg128His | p.R128H | Q9Y2A9 | protein_coding | deleterious(0.03) | probably_damaging(0.975) | TCGA-AR-A1AU-01 | Breast | breast invasive carcinoma | Female | <65 | III/IV | Chemotherapy | doxorubicin | SD | |
| B3GNT3 | SNV | Missense_Mutation | c.542N>G | p.Ser181Cys | p.S181C | Q9Y2A9 | protein_coding | deleterious(0) | probably_damaging(0.948) | TCGA-C5-A1MH-01 | Cervix | cervical & endocervical cancer | Female | >=65 | III/IV | Chemotherapy | cisplatin | PD | |
| B3GNT3 | SNV | Missense_Mutation | novel | c.1094N>C | p.Cys365Ser | p.C365S | Q9Y2A9 | protein_coding | deleterious(0) | probably_damaging(0.992) | TCGA-VS-A9UM-01 | Cervix | cervical & endocervical cancer | Female | <65 | I/II | Chemotherapy | cisplatin | CR |
| B3GNT3 | SNV | Missense_Mutation | rs763164172 | c.787N>T | p.Arg263Trp | p.R263W | Q9Y2A9 | protein_coding | tolerated(0.19) | possibly_damaging(0.892) | TCGA-D5-6928-01 | Colorectum | colon adenocarcinoma | Male | >=65 | I/II | Unknown | Unknown | SD |
| B3GNT3 | SNV | Missense_Mutation | c.919N>A | p.Glu307Lys | p.E307K | Q9Y2A9 | protein_coding | tolerated(0.12) | benign(0.122) | TCGA-DM-A1D9-01 | Colorectum | colon adenocarcinoma | Female | >=65 | I/II | Unknown | Unknown | SD | |
| B3GNT3 | SNV | Missense_Mutation | c.584N>T | p.Trp195Leu | p.W195L | Q9Y2A9 | protein_coding | deleterious(0) | probably_damaging(1) | TCGA-AP-A051-01 | Endometrium | uterine corpus endometrioid carcinoma | Female | >=65 | I/II | Unknown | Unknown | SD | |
| B3GNT3 | SNV | Missense_Mutation | c.607G>A | p.Ala203Thr | p.A203T | Q9Y2A9 | protein_coding | deleterious(0.03) | benign(0.365) | TCGA-AP-A0LJ-01 | Endometrium | uterine corpus endometrioid carcinoma | Female | <65 | I/II | Unknown | Unknown | SD | |
| B3GNT3 | SNV | Missense_Mutation | novel | c.676N>A | p.Asp226Asn | p.D226N | Q9Y2A9 | protein_coding | tolerated(0.53) | benign(0.026) | TCGA-AP-A1DV-01 | Endometrium | uterine corpus endometrioid carcinoma | Female | <65 | I/II | Unknown | Unknown | SD |
| B3GNT3 | SNV | Missense_Mutation | rs199719531 | c.1034N>A | p.Arg345His | p.R345H | Q9Y2A9 | protein_coding | deleterious(0) | probably_damaging(0.996) | TCGA-AX-A0J1-01 | Endometrium | uterine corpus endometrioid carcinoma | Female | >=65 | I/II | Unknown | Unknown | SD |
| Page: 1 2 3 4 5 |
Top |
Related drugs of malignant transformation related genes |
| Identification of chemicals and drugs interact with genes involved in malignant transfromation |
| (DGIdb 4.0) |
| Entrez ID | Symbol | Category | Interaction Types | Drug Claim Name | Drug Name | PMIDs |
| Page: 1 |

Copyright 2023-Present -The University of Texas Health Science Center at Houston |