
|
|||||
|
 | |
| |
| |
| |
| |
| |
|
Gene: B3GALT5 |
Gene summary for B3GALT5 |
| Gene information | Species | Human | Gene symbol | B3GALT5 | Gene ID | 10317 |
| Gene name | beta-1,3-galactosyltransferase 5 | |
| Gene Alias | B3GalT-V | |
| Cytomap | 21q22.2 | |
| Gene Type | protein-coding | GO ID | GO:0005975 | UniProtAcc | Q9Y2C3 |
Top |
Malignant transformation analysis |
| Identification of the aberrant gene expression in precancerous and cancerous lesions by comparing the gene expression of stem-like cells in diseased tissues with normal stem cells |
| Entrez ID | Symbol | Replicates | Species | Organ | Tissue | Adj P-value | Log2FC | Malignancy |
| 10317 | B3GALT5 | HTA11_347_2000001011 | Human | Colorectum | AD | 1.97e-14 | 6.59e-01 | -0.1954 |
| 10317 | B3GALT5 | HTA11_411_2000001011 | Human | Colorectum | SER | 2.68e-09 | 1.45e+00 | -0.2602 |
| 10317 | B3GALT5 | HTA11_2112_2000001011 | Human | Colorectum | SER | 1.30e-05 | 9.27e-01 | -0.2196 |
| 10317 | B3GALT5 | HTA11_696_2000001011 | Human | Colorectum | AD | 2.48e-18 | 7.18e-01 | -0.1464 |
| 10317 | B3GALT5 | HTA11_2992_2000001011 | Human | Colorectum | SER | 3.11e-06 | 9.33e-01 | -0.1706 |
| 10317 | B3GALT5 | HTA11_5212_2000001011 | Human | Colorectum | AD | 1.63e-17 | 1.07e+00 | -0.2061 |
| 10317 | B3GALT5 | HTA11_866_3004761011 | Human | Colorectum | AD | 2.14e-03 | -1.64e-01 | 0.096 |
| 10317 | B3GALT5 | HTA11_7696_3000711011 | Human | Colorectum | AD | 4.07e-04 | -1.64e-01 | 0.0674 |
| 10317 | B3GALT5 | HTA11_99999971662_82457 | Human | Colorectum | MSS | 4.25e-05 | -1.64e-01 | 0.3859 |
| 10317 | B3GALT5 | HTA11_99999974143_84620 | Human | Colorectum | MSS | 2.00e-05 | -1.64e-01 | 0.3005 |
| 10317 | B3GALT5 | A002-C-010 | Human | Colorectum | FAP | 1.80e-03 | -1.52e-01 | 0.242 |
| 10317 | B3GALT5 | A002-C-201 | Human | Colorectum | FAP | 5.51e-03 | -1.51e-01 | 0.0324 |
| 10317 | B3GALT5 | A002-C-205 | Human | Colorectum | FAP | 6.81e-05 | -1.64e-01 | -0.1236 |
| 10317 | B3GALT5 | A015-C-104 | Human | Colorectum | FAP | 3.85e-03 | -1.64e-01 | -0.1899 |
| 10317 | B3GALT5 | A015-C-202 | Human | Colorectum | FAP | 4.67e-05 | -1.64e-01 | -0.0849 |
| 10317 | B3GALT5 | A002-C-016 | Human | Colorectum | FAP | 3.37e-03 | -1.46e-01 | 0.0521 |
| 10317 | B3GALT5 | A001-C-203 | Human | Colorectum | FAP | 7.55e-03 | -1.51e-01 | -0.0481 |
| 10317 | B3GALT5 | A002-C-116 | Human | Colorectum | FAP | 8.62e-04 | -1.42e-01 | -0.0452 |
| 10317 | B3GALT5 | A014-C-008 | Human | Colorectum | FAP | 3.72e-02 | -1.64e-01 | -0.191 |
| 10317 | B3GALT5 | F034 | Human | Colorectum | FAP | 1.92e-04 | -1.64e-01 | -0.0665 |
| Page: 1 2 |
| Tissue | Expression Dynamics | Abbreviation |
| Colorectum (GSE201348) | 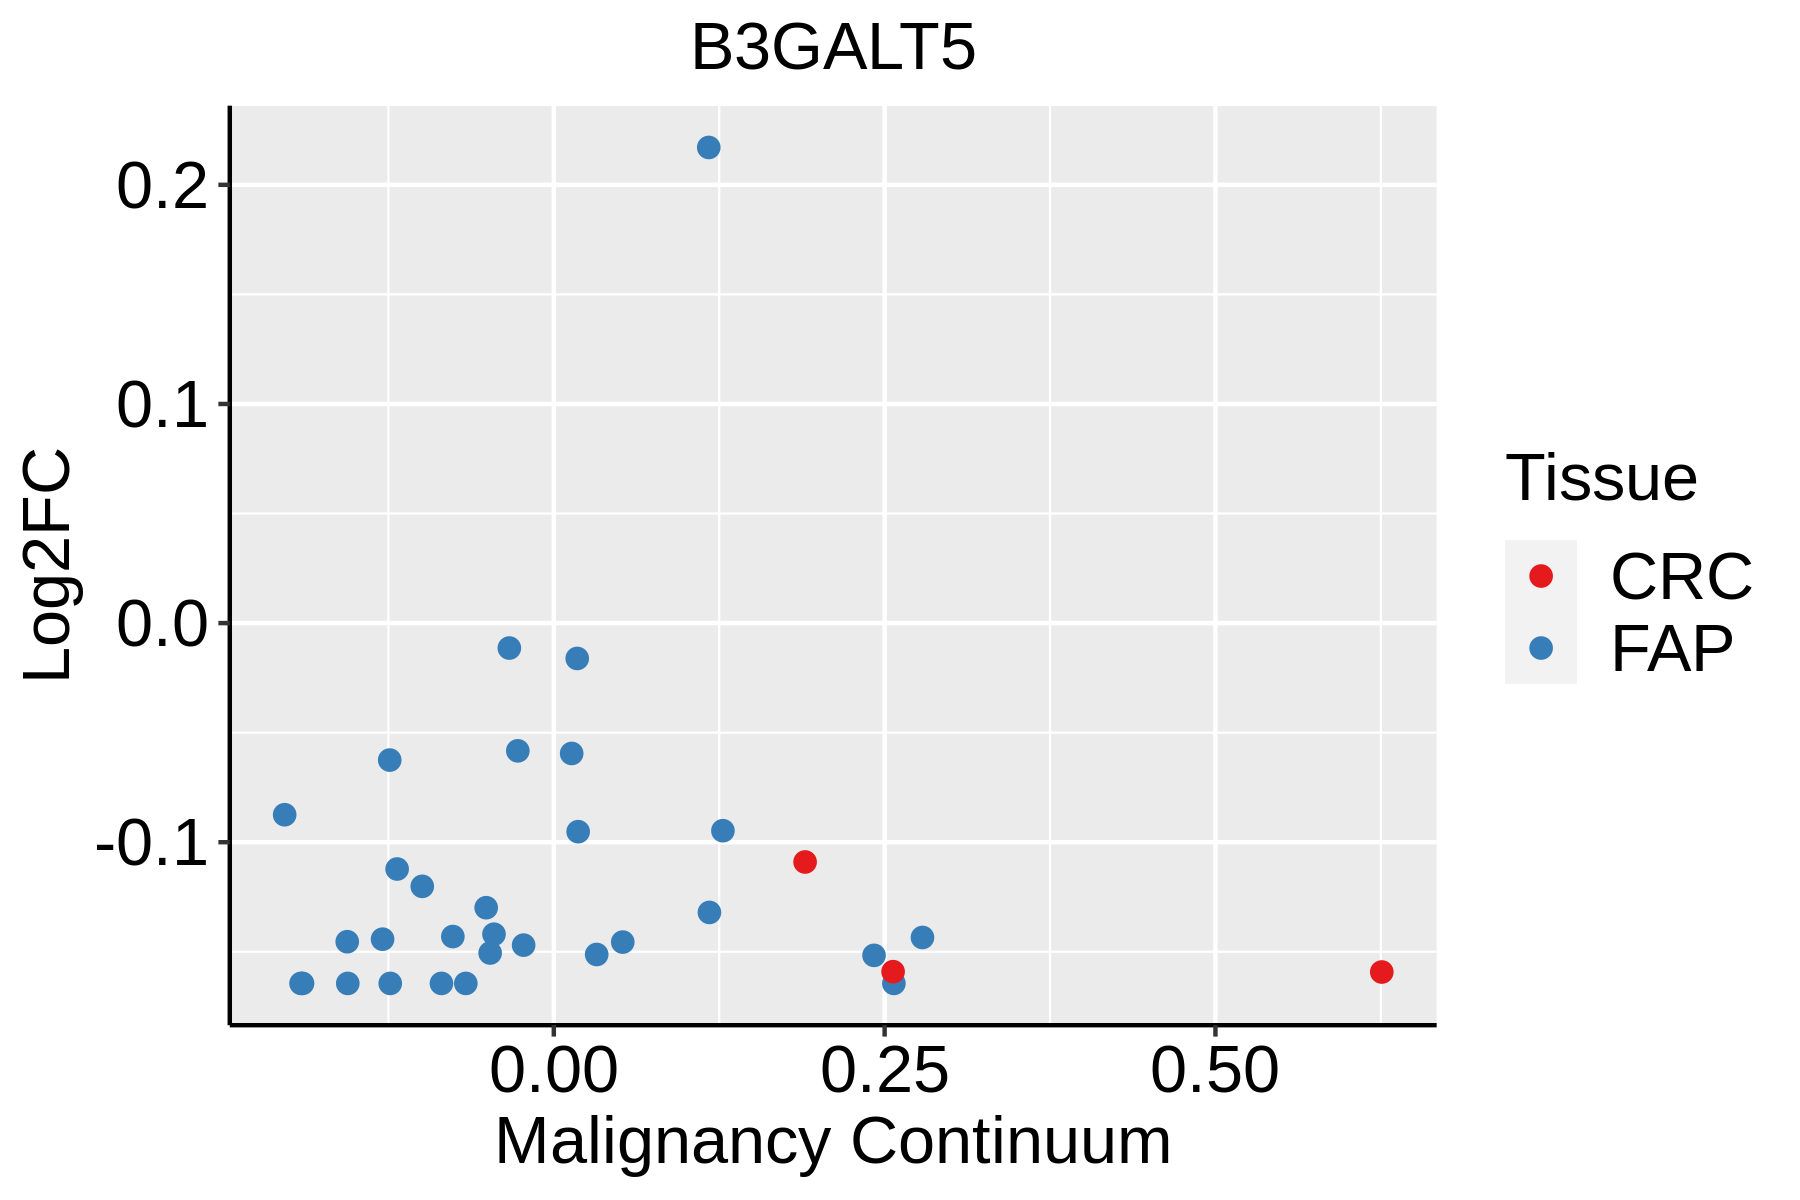 | FAP: Familial adenomatous polyposis |
| CRC: Colorectal cancer | ||
| Colorectum (HTA11) | 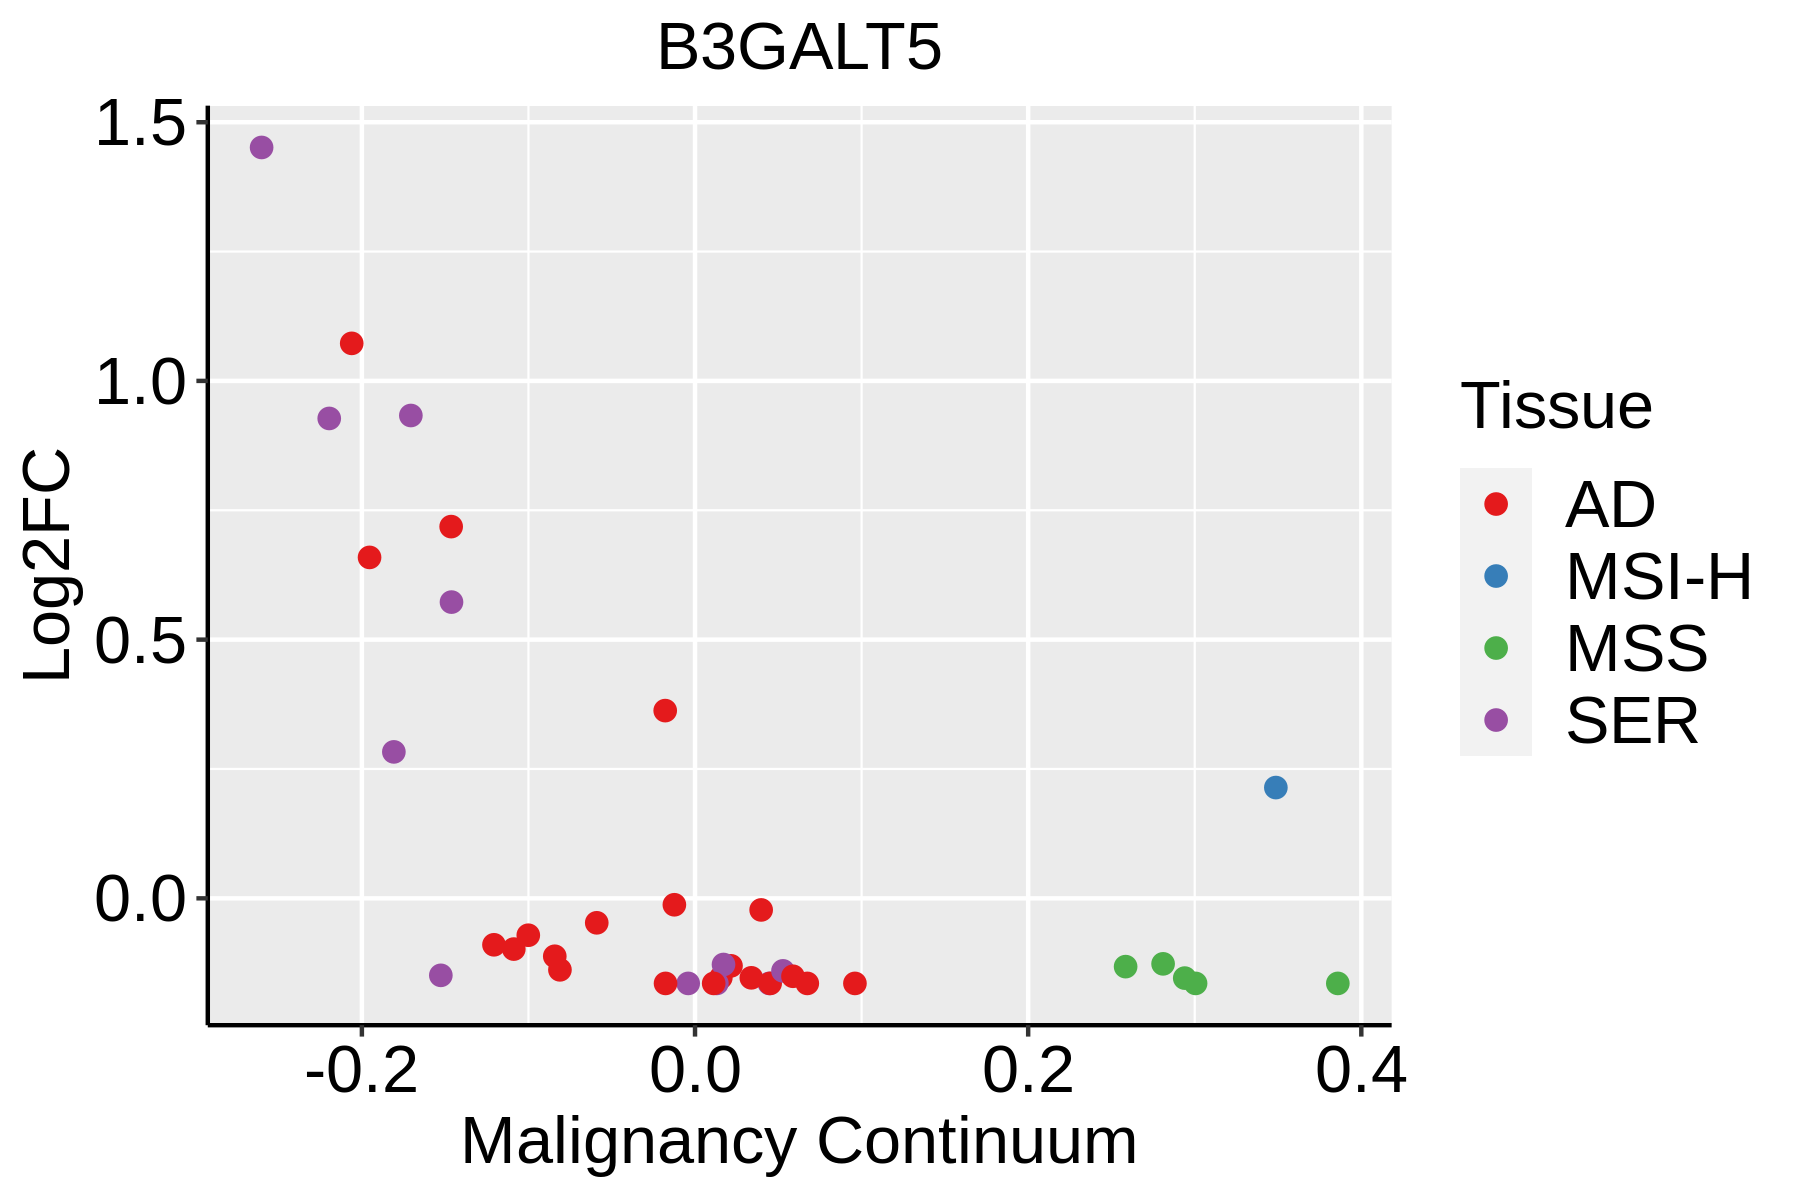 | AD: Adenomas |
| SER: Sessile serrated lesions | ||
| MSI-H: Microsatellite-high colorectal cancer | ||
| MSS: Microsatellite stable colorectal cancer |
| ∗log2FC in expression of this searched gene in stem-like cells from each diseased tissue sample relative to stem-like cells in normal samples in each tissue plotted against the malignancy continuum. Samples are colored based on if they are from different disease stage. |
Top |
Malignant transformation related pathway analysis |
| Find out the enriched GO biological processes and KEGG pathways involved in transition from healthy to precancer to cancer |
| Tissue | Disease Stage | Enriched GO biological Processes |
| Colorectum | AD |  |
| Colorectum | SER |  |
| Colorectum | MSS |  |
| Colorectum | MSI-H |  |
| Colorectum | FAP |  |
| ∗Top 15 enriched GO BP terms are showed in the bar plot of each disease state in each tissue. Each row represents a significant GO biological process which is colored according to the -log10(p.adjust). |
| Page: 1 2 3 4 5 6 7 8 9 |
| GO ID | Tissue | Disease Stage | Description | Gene Ratio | Bg Ratio | pvalue | p.adjust | Count |
| GO:0006486 | Colorectum | AD | protein glycosylation | 64/3918 | 226/18723 | 4.86e-03 | 3.27e-02 | 64 |
| GO:0043413 | Colorectum | AD | macromolecule glycosylation | 64/3918 | 226/18723 | 4.86e-03 | 3.27e-02 | 64 |
| GO:0070085 | Colorectum | AD | glycosylation | 67/3918 | 240/18723 | 5.78e-03 | 3.67e-02 | 67 |
| GO:00064861 | Colorectum | FAP | protein glycosylation | 48/2622 | 226/18723 | 1.85e-03 | 1.57e-02 | 48 |
| GO:00434131 | Colorectum | FAP | macromolecule glycosylation | 48/2622 | 226/18723 | 1.85e-03 | 1.57e-02 | 48 |
| GO:00700851 | Colorectum | FAP | glycosylation | 50/2622 | 240/18723 | 2.30e-03 | 1.85e-02 | 50 |
| GO:0009101 | Colorectum | FAP | glycoprotein biosynthetic process | 63/2622 | 317/18723 | 2.31e-03 | 1.86e-02 | 63 |
| Page: 1 |
| Pathway ID | Tissue | Disease Stage | Description | Gene Ratio | Bg Ratio | pvalue | p.adjust | qvalue | Count |
| Page: 1 |
Top |
Cell-cell communication analysis |
| Identification of potential cell-cell interactions between two cell types and their ligand-receptor pairs for different disease states |
| Ligand | Receptor | LRpair | Pathway | Tissue | Disease Stage |
| Page: 1 |
Top |
Single-cell gene regulatory network inference analysis |
| Find out the significant the regulons (TFs) and the target genes of each regulon across cell types for different disease states |
| TF | Cell Type | Tissue | Disease Stage | Target Gene | RSS | Regulon Activity |
| ∗The dot plots of a searched regulon are shown for all cell subpopulations in each disease state of each tissue based on the regulon specific score inferred using pySCENIC and by calculating the average expression. |
| Page: 1 |
Top |
Somatic mutation of malignant transformation related genes |
| Annotation of somatic variants for genes involved in malignant transformation |
| Hugo Symbol | Variant Class | Variant Classification | dbSNP RS | HGVSc | HGVSp | HGVSp Short | SWISSPROT | BIOTYPE | SIFT | PolyPhen | Tumor Sample Barcode | Tissue | Histology | Sex | Age | Stage | Therapy Types | Drugs | Outcome |
| B3GALT5 | SNV | Missense_Mutation | novel | c.233N>G | p.Met78Arg | p.M78R | protein_coding | tolerated(0.53) | benign(0.355) | TCGA-AO-A0J4-01 | Breast | breast invasive carcinoma | Female | <65 | I/II | Chemotherapy | doxorubicin | SD | |
| B3GALT5 | SNV | Missense_Mutation | c.136N>C | p.Gly46Arg | p.G46R | protein_coding | tolerated(0.11) | benign(0.044) | TCGA-AR-A1AY-01 | Breast | breast invasive carcinoma | Female | >=65 | I/II | Unspecific | Doxorubicin | SD | ||
| B3GALT5 | SNV | Missense_Mutation | c.320C>T | p.Ala107Val | p.A107V | protein_coding | tolerated(0.27) | benign(0.003) | TCGA-B6-A1KN-01 | Breast | breast invasive carcinoma | Female | <65 | III/IV | Unknown | Unknown | SD | ||
| B3GALT5 | SNV | Missense_Mutation | c.364G>A | p.Asp122Asn | p.D122N | protein_coding | deleterious(0) | probably_damaging(1) | TCGA-IR-A3LK-01 | Cervix | cervical & endocervical cancer | Female | >=65 | I/II | Chemotherapy | cisplatin | PD | ||
| B3GALT5 | SNV | Missense_Mutation | rs766898271 | c.835G>A | p.Val279Ile | p.V279I | protein_coding | tolerated(0.42) | benign(0.013) | TCGA-A6-6650-01 | Colorectum | colon adenocarcinoma | Female | >=65 | I/II | Unknown | Unknown | SD | |
| B3GALT5 | SNV | Missense_Mutation | rs763079633 | c.267N>A | p.Met89Ile | p.M89I | protein_coding | tolerated(0.22) | benign(0) | TCGA-AA-3672-01 | Colorectum | colon adenocarcinoma | Female | >=65 | III/IV | Unknown | Unknown | SD | |
| B3GALT5 | SNV | Missense_Mutation | c.461N>T | p.Ala154Val | p.A154V | protein_coding | deleterious(0.01) | possibly_damaging(0.852) | TCGA-AA-A010-01 | Colorectum | colon adenocarcinoma | Female | <65 | I/II | Chemotherapy | folinic | CR | ||
| B3GALT5 | SNV | Missense_Mutation | c.362N>T | p.Gly121Val | p.G121V | protein_coding | deleterious(0.03) | benign(0.119) | TCGA-G4-6302-01 | Colorectum | colon adenocarcinoma | Female | >=65 | I/II | Unknown | Unknown | SD | ||
| B3GALT5 | SNV | Missense_Mutation | rs372607334 | c.458N>T | p.Ala153Val | p.A153V | protein_coding | tolerated(0.11) | benign(0.11) | TCGA-QG-A5Z1-01 | Colorectum | colon adenocarcinoma | Male | >=65 | III/IV | Unspecific | Complete Response | ||
| B3GALT5 | SNV | Missense_Mutation | c.356N>A | p.Arg119Gln | p.R119Q | protein_coding | tolerated(1) | benign(0.006) | TCGA-AG-A002-01 | Colorectum | rectum adenocarcinoma | Male | <65 | I/II | Unknown | Unknown | SD |
| Page: 1 2 3 4 |
Top |
Related drugs of malignant transformation related genes |
| Identification of chemicals and drugs interact with genes involved in malignant transfromation |
| (DGIdb 4.0) |
| Entrez ID | Symbol | Category | Interaction Types | Drug Claim Name | Drug Name | PMIDs |
| Page: 1 |

Copyright 2023-Present -The University of Texas Health Science Center at Houston |