
|
|||||
|
 | |
| |
| |
| |
| |
| |
|
Gene: B3GALT4 |
Gene summary for B3GALT4 |
| Gene information | Species | Human | Gene symbol | B3GALT4 | Gene ID | 8705 |
| Gene name | beta-1,3-galactosyltransferase 4 | |
| Gene Alias | BETA3GALT4 | |
| Cytomap | 6p21.32 | |
| Gene Type | protein-coding | GO ID | GO:0001573 | UniProtAcc | B3KQP5 |
Top |
Malignant transformation analysis |
| Identification of the aberrant gene expression in precancerous and cancerous lesions by comparing the gene expression of stem-like cells in diseased tissues with normal stem cells |
| Entrez ID | Symbol | Replicates | Species | Organ | Tissue | Adj P-value | Log2FC | Malignancy |
| 8705 | B3GALT4 | LZE4T | Human | Esophagus | ESCC | 1.96e-02 | 1.07e-01 | 0.0811 |
| 8705 | B3GALT4 | LZE20T | Human | Esophagus | ESCC | 2.92e-05 | 1.94e-01 | 0.0662 |
| 8705 | B3GALT4 | LZE24T | Human | Esophagus | ESCC | 3.74e-15 | 3.91e-01 | 0.0596 |
| 8705 | B3GALT4 | LZE21T | Human | Esophagus | ESCC | 2.61e-03 | 1.82e-01 | 0.0655 |
| 8705 | B3GALT4 | P1T-E | Human | Esophagus | ESCC | 1.33e-10 | 4.07e-01 | 0.0875 |
| 8705 | B3GALT4 | P2T-E | Human | Esophagus | ESCC | 7.99e-11 | 1.13e-01 | 0.1177 |
| 8705 | B3GALT4 | P4T-E | Human | Esophagus | ESCC | 2.32e-13 | 2.55e-01 | 0.1323 |
| 8705 | B3GALT4 | P5T-E | Human | Esophagus | ESCC | 2.61e-02 | 3.51e-02 | 0.1327 |
| 8705 | B3GALT4 | P8T-E | Human | Esophagus | ESCC | 6.84e-08 | 1.48e-01 | 0.0889 |
| 8705 | B3GALT4 | P9T-E | Human | Esophagus | ESCC | 6.99e-13 | 2.60e-01 | 0.1131 |
| 8705 | B3GALT4 | P11T-E | Human | Esophagus | ESCC | 1.14e-07 | 3.91e-01 | 0.1426 |
| 8705 | B3GALT4 | P15T-E | Human | Esophagus | ESCC | 1.03e-08 | 1.73e-01 | 0.1149 |
| 8705 | B3GALT4 | P16T-E | Human | Esophagus | ESCC | 4.05e-03 | 5.60e-02 | 0.1153 |
| 8705 | B3GALT4 | P17T-E | Human | Esophagus | ESCC | 2.09e-05 | 2.60e-01 | 0.1278 |
| 8705 | B3GALT4 | P19T-E | Human | Esophagus | ESCC | 2.97e-08 | 4.38e-01 | 0.1662 |
| 8705 | B3GALT4 | P20T-E | Human | Esophagus | ESCC | 9.56e-04 | 8.34e-02 | 0.1124 |
| 8705 | B3GALT4 | P22T-E | Human | Esophagus | ESCC | 1.17e-23 | 4.13e-01 | 0.1236 |
| 8705 | B3GALT4 | P23T-E | Human | Esophagus | ESCC | 1.74e-15 | 3.82e-01 | 0.108 |
| 8705 | B3GALT4 | P24T-E | Human | Esophagus | ESCC | 1.52e-10 | 1.99e-01 | 0.1287 |
| 8705 | B3GALT4 | P26T-E | Human | Esophagus | ESCC | 3.07e-12 | 1.46e-01 | 0.1276 |
| Page: 1 2 3 4 |
| Tissue | Expression Dynamics | Abbreviation |
| Esophagus | 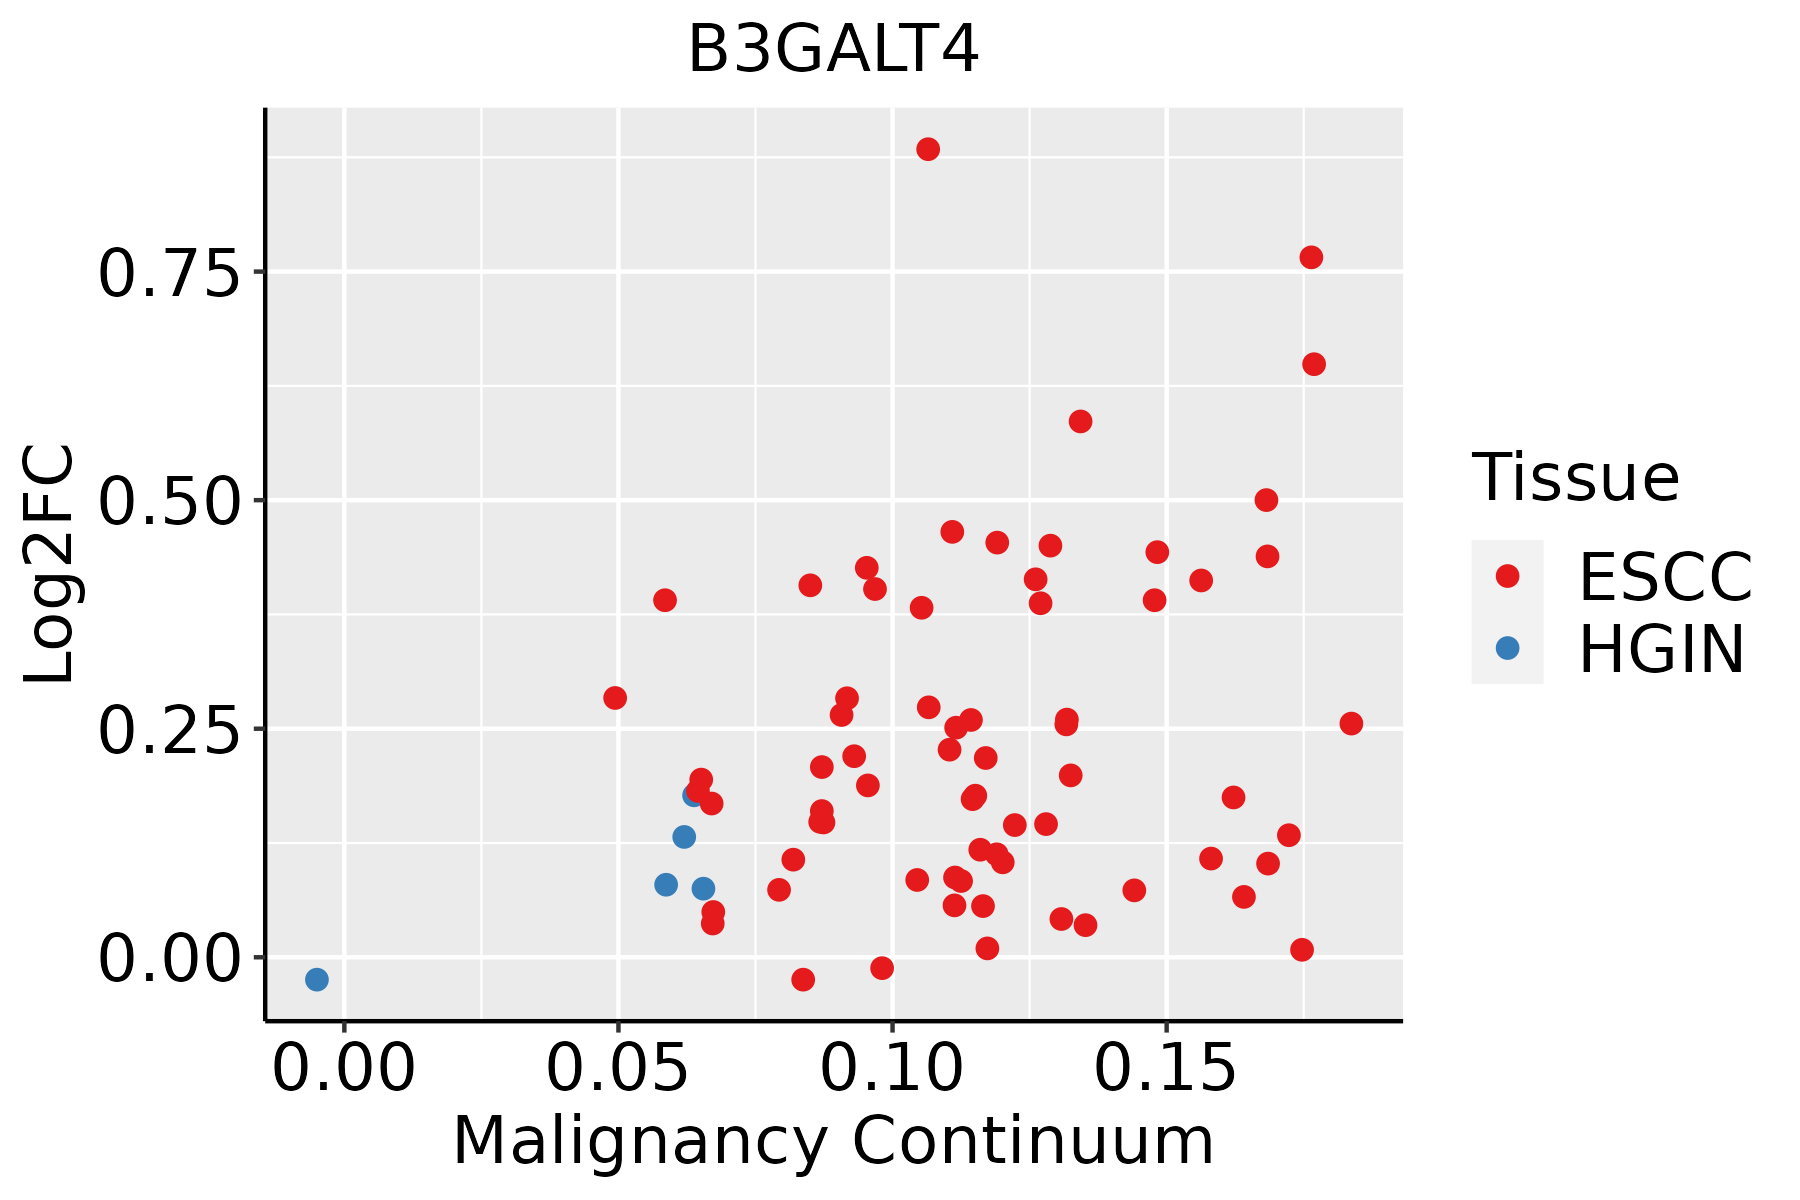 | ESCC: Esophageal squamous cell carcinoma |
| HGIN: High-grade intraepithelial neoplasias | ||
| LGIN: Low-grade intraepithelial neoplasias | ||
| Oral Cavity | 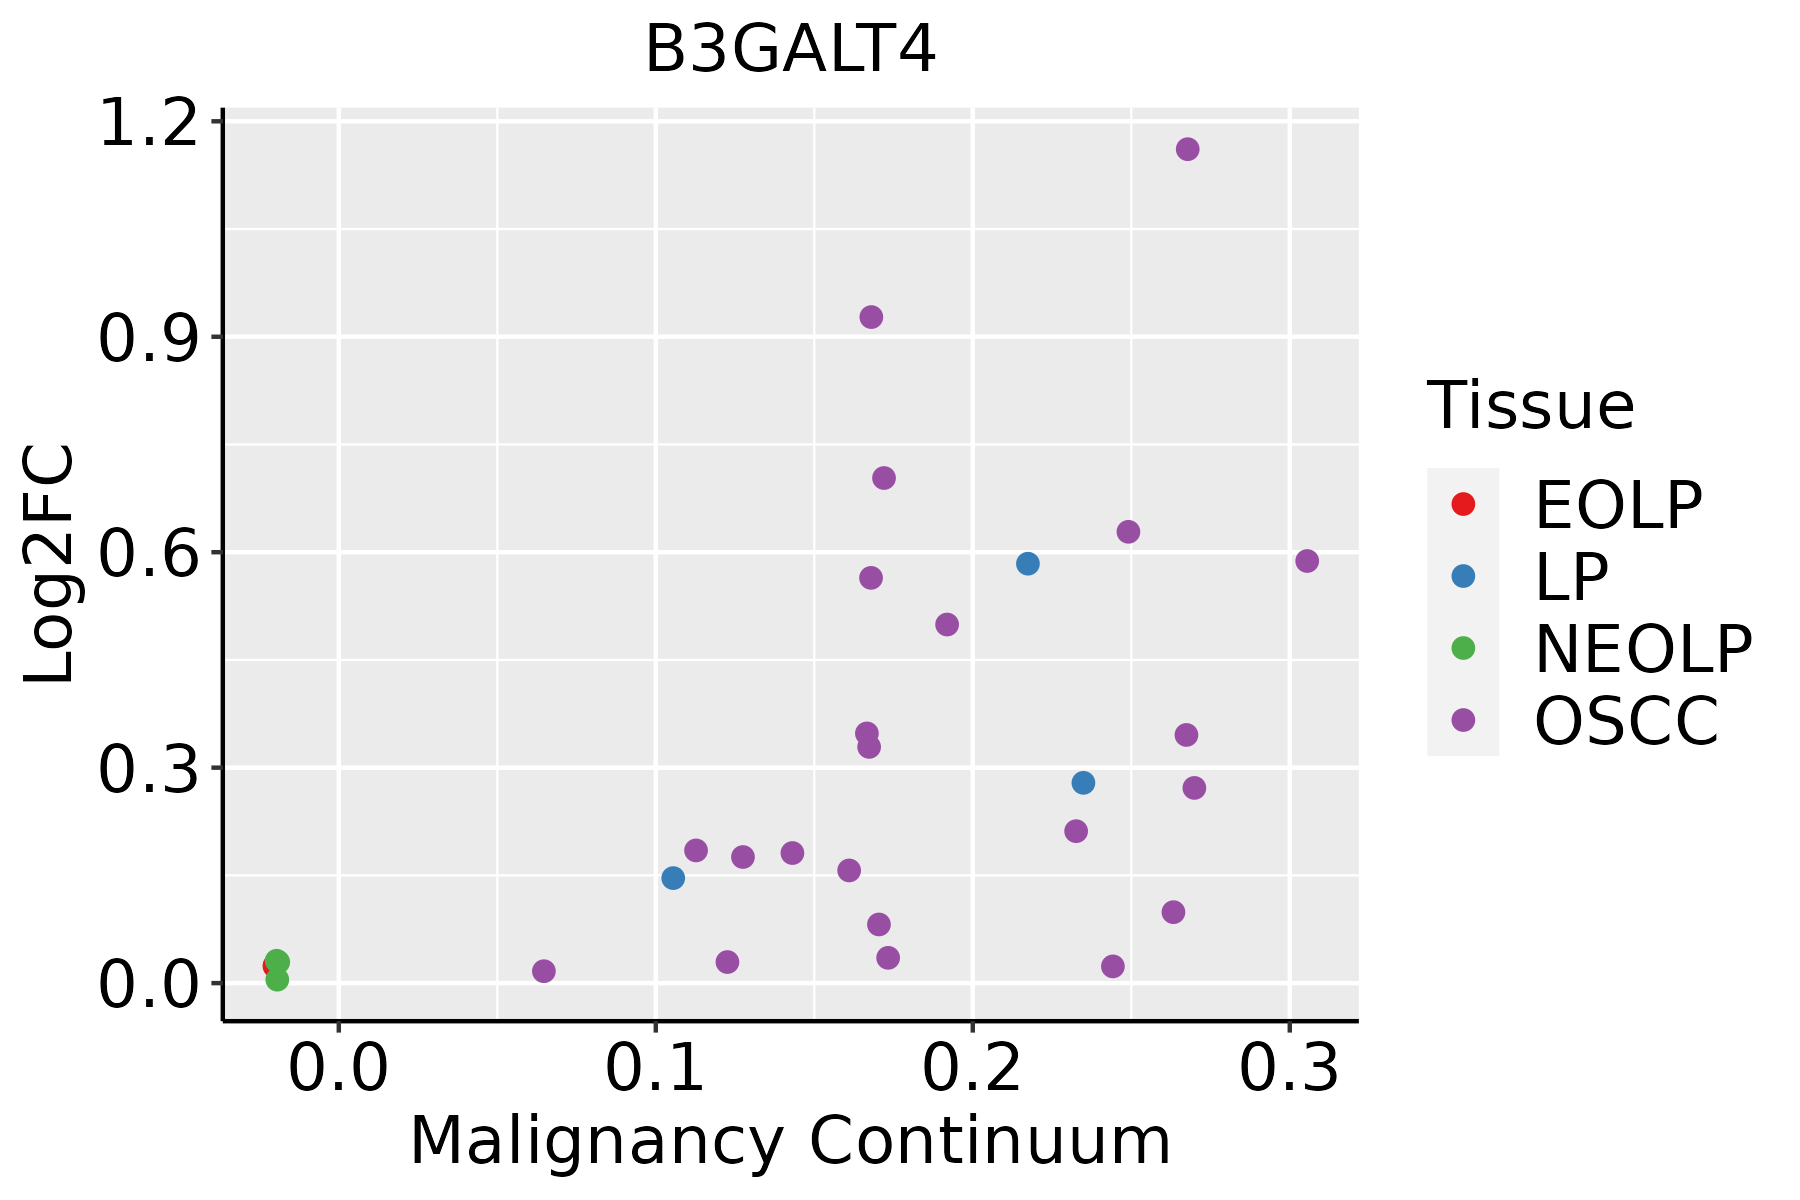 | EOLP: Erosive Oral lichen planus |
| LP: leukoplakia | ||
| NEOLP: Non-erosive oral lichen planus | ||
| OSCC: Oral squamous cell carcinoma |
| ∗log2FC in expression of this searched gene in stem-like cells from each diseased tissue sample relative to stem-like cells in normal samples in each tissue plotted against the malignancy continuum. Samples are colored based on if they are from different disease stage. |
Top |
Malignant transformation related pathway analysis |
| Find out the enriched GO biological processes and KEGG pathways involved in transition from healthy to precancer to cancer |
| Tissue | Disease Stage | Enriched GO biological Processes |
| Colorectum | AD |  |
| Colorectum | SER |  |
| Colorectum | MSS |  |
| Colorectum | MSI-H |  |
| Colorectum | FAP |  |
| ∗Top 15 enriched GO BP terms are showed in the bar plot of each disease state in each tissue. Each row represents a significant GO biological process which is colored according to the -log10(p.adjust). |
| Page: 1 2 3 4 5 6 7 8 9 |
| GO ID | Tissue | Disease Stage | Description | Gene Ratio | Bg Ratio | pvalue | p.adjust | Count |
| GO:00066433 | Esophagus | ESCC | membrane lipid metabolic process | 130/8552 | 203/18723 | 9.29e-08 | 1.54e-06 | 130 |
| GO:00091002 | Esophagus | ESCC | glycoprotein metabolic process | 226/8552 | 387/18723 | 2.64e-07 | 3.94e-06 | 226 |
| GO:00700854 | Esophagus | ESCC | glycosylation | 144/8552 | 240/18723 | 5.12e-06 | 5.38e-05 | 144 |
| GO:00464673 | Esophagus | ESCC | membrane lipid biosynthetic process | 91/8552 | 142/18723 | 7.19e-06 | 7.19e-05 | 91 |
| GO:00064865 | Esophagus | ESCC | protein glycosylation | 135/8552 | 226/18723 | 1.36e-05 | 1.24e-04 | 135 |
| GO:00434135 | Esophagus | ESCC | macromolecule glycosylation | 135/8552 | 226/18723 | 1.36e-05 | 1.24e-04 | 135 |
| GO:00091012 | Esophagus | ESCC | glycoprotein biosynthetic process | 181/8552 | 317/18723 | 2.54e-05 | 2.15e-04 | 181 |
| GO:00066652 | Esophagus | ESCC | sphingolipid metabolic process | 96/8552 | 155/18723 | 3.21e-05 | 2.66e-04 | 96 |
| GO:00160514 | Esophagus | ESCC | carbohydrate biosynthetic process | 117/8552 | 202/18723 | 2.96e-04 | 1.79e-03 | 117 |
| GO:00066642 | Esophagus | ESCC | glycolipid metabolic process | 63/8552 | 100/18723 | 3.55e-04 | 2.06e-03 | 63 |
| GO:19035092 | Esophagus | ESCC | liposaccharide metabolic process | 63/8552 | 101/18723 | 5.25e-04 | 2.90e-03 | 63 |
| GO:00301481 | Esophagus | ESCC | sphingolipid biosynthetic process | 62/8552 | 103/18723 | 2.10e-03 | 9.38e-03 | 62 |
| GO:00066721 | Esophagus | ESCC | ceramide metabolic process | 61/8552 | 102/18723 | 2.82e-03 | 1.19e-02 | 61 |
| GO:0009247 | Esophagus | ESCC | glycolipid biosynthetic process | 42/8552 | 68/18723 | 5.48e-03 | 2.05e-02 | 42 |
| GO:0046513 | Esophagus | ESCC | ceramide biosynthetic process | 40/8552 | 65/18723 | 7.25e-03 | 2.63e-02 | 40 |
| GO:00066432 | Oral cavity | OSCC | membrane lipid metabolic process | 111/7305 | 203/18723 | 4.02e-06 | 4.69e-05 | 111 |
| GO:00066651 | Oral cavity | OSCC | sphingolipid metabolic process | 84/7305 | 155/18723 | 8.64e-05 | 6.61e-04 | 84 |
| GO:00464672 | Oral cavity | OSCC | membrane lipid biosynthetic process | 77/7305 | 142/18723 | 1.63e-04 | 1.13e-03 | 77 |
| GO:00091001 | Oral cavity | OSCC | glycoprotein metabolic process | 185/7305 | 387/18723 | 2.37e-04 | 1.54e-03 | 185 |
| GO:00091011 | Oral cavity | OSCC | glycoprotein biosynthetic process | 151/7305 | 317/18723 | 1.01e-03 | 5.26e-03 | 151 |
| Page: 1 2 |
| Pathway ID | Tissue | Disease Stage | Description | Gene Ratio | Bg Ratio | pvalue | p.adjust | qvalue | Count |
| Page: 1 |
Top |
Cell-cell communication analysis |
| Identification of potential cell-cell interactions between two cell types and their ligand-receptor pairs for different disease states |
| Ligand | Receptor | LRpair | Pathway | Tissue | Disease Stage |
| Page: 1 |
Top |
Single-cell gene regulatory network inference analysis |
| Find out the significant the regulons (TFs) and the target genes of each regulon across cell types for different disease states |
| TF | Cell Type | Tissue | Disease Stage | Target Gene | RSS | Regulon Activity |
| ∗The dot plots of a searched regulon are shown for all cell subpopulations in each disease state of each tissue based on the regulon specific score inferred using pySCENIC and by calculating the average expression. |
| Page: 1 |
Top |
Somatic mutation of malignant transformation related genes |
| Annotation of somatic variants for genes involved in malignant transformation |
| Hugo Symbol | Variant Class | Variant Classification | dbSNP RS | HGVSc | HGVSp | HGVSp Short | SWISSPROT | BIOTYPE | SIFT | PolyPhen | Tumor Sample Barcode | Tissue | Histology | Sex | Age | Stage | Therapy Types | Drugs | Outcome |
| B3GALT4 | SNV | Missense_Mutation | c.899G>A | p.Arg300Gln | p.R300Q | O96024 | protein_coding | tolerated(0.17) | possibly_damaging(0.772) | TCGA-A2-A0YK-01 | Breast | breast invasive carcinoma | Female | <65 | I/II | Chemotherapy | cytoxan | SD | |
| B3GALT4 | SNV | Missense_Mutation | c.700G>A | p.Val234Met | p.V234M | O96024 | protein_coding | deleterious(0) | probably_damaging(0.927) | TCGA-A7-A26G-01 | Breast | breast invasive carcinoma | Female | <65 | I/II | Chemotherapy | taxotere | SD | |
| B3GALT4 | SNV | Missense_Mutation | c.13N>A | p.Leu5Ile | p.L5I | O96024 | protein_coding | tolerated(0.54) | benign(0.081) | TCGA-A8-A09A-01 | Breast | breast invasive carcinoma | Female | <65 | I/II | Hormone Therapy | tamoxiphen | SD | |
| B3GALT4 | SNV | Missense_Mutation | c.218N>G | p.Leu73Arg | p.L73R | O96024 | protein_coding | deleterious(0) | probably_damaging(0.998) | TCGA-C8-A135-01 | Breast | breast invasive carcinoma | Female | <65 | I/II | Chemotherapy | 5-fluorouracil | CR | |
| B3GALT4 | insertion | Frame_Shift_Ins | novel | c.278_279insACACCAAGACCACTGGCCGCCGTGGCCGCACCGTGGGT | p.Trp94HisfsTer72 | p.W94Hfs*72 | O96024 | protein_coding | TCGA-A2-A0EV-01 | Breast | breast invasive carcinoma | Female | >=65 | I/II | Unknown | Unknown | SD | ||
| B3GALT4 | insertion | Frame_Shift_Ins | novel | c.943_944insATCTCATCTACTTCGGCTTCTACAGCTT | p.Thr315AsnfsTer45 | p.T315Nfs*45 | O96024 | protein_coding | TCGA-AO-A0J3-01 | Breast | breast invasive carcinoma | Female | >=65 | I/II | Chemotherapy | cyclophosphamide | SD | ||
| B3GALT4 | insertion | Nonsense_Mutation | novel | c.1126_1127insACTGTCCTAGGTTTATACCCAAGAGAAACTTTTGA | p.Leu376HisfsTer12 | p.L376Hfs*12 | O96024 | protein_coding | TCGA-AO-A0JJ-01 | Breast | breast invasive carcinoma | Female | <65 | I/II | Chemotherapy | cyclophospamide | SD | ||
| B3GALT4 | SNV | Missense_Mutation | c.896N>A | p.Arg299Gln | p.R299Q | O96024 | protein_coding | tolerated(0.07) | benign(0.348) | TCGA-C5-A1MH-01 | Cervix | cervical & endocervical cancer | Female | >=65 | III/IV | Chemotherapy | cisplatin | PD | |
| B3GALT4 | SNV | Missense_Mutation | c.229G>A | p.Val77Met | p.V77M | O96024 | protein_coding | deleterious(0) | probably_damaging(0.998) | TCGA-JW-A5VH-01 | Cervix | cervical & endocervical cancer | Female | <65 | I/II | Chemotherapy | carboplatin | PD | |
| B3GALT4 | SNV | Missense_Mutation | novel | c.628N>A | p.Glu210Lys | p.E210K | O96024 | protein_coding | tolerated(0.55) | benign(0.001) | TCGA-MA-AA41-01 | Cervix | cervical & endocervical cancer | Female | <65 | I/II | Unknown | Unknown | SD |
| Page: 1 2 3 4 5 |
Top |
Related drugs of malignant transformation related genes |
| Identification of chemicals and drugs interact with genes involved in malignant transfromation |
| (DGIdb 4.0) |
| Entrez ID | Symbol | Category | Interaction Types | Drug Claim Name | Drug Name | PMIDs |
| Page: 1 |

Copyright 2023-Present -The University of Texas Health Science Center at Houston |