
|
|||||
|
 | |
| |
| |
| |
| |
| |
|
Gene: B3GALNT2 |
Gene summary for B3GALNT2 |
| Gene information | Species | Human | Gene symbol | B3GALNT2 | Gene ID | 148789 |
| Gene name | beta-1,3-N-acetylgalactosaminyltransferase 2 | |
| Gene Alias | B3GalNAc-T2 | |
| Cytomap | 1q42.3 | |
| Gene Type | protein-coding | GO ID | GO:0006464 | UniProtAcc | Q8NCR0 |
Top |
Malignant transformation analysis |
| Identification of the aberrant gene expression in precancerous and cancerous lesions by comparing the gene expression of stem-like cells in diseased tissues with normal stem cells |
| Entrez ID | Symbol | Replicates | Species | Organ | Tissue | Adj P-value | Log2FC | Malignancy |
| 148789 | B3GALNT2 | CCI_1 | Human | Cervix | CC | 1.52e-08 | 7.56e-01 | 0.528 |
| 148789 | B3GALNT2 | CCI_2 | Human | Cervix | CC | 2.00e-05 | 7.22e-01 | 0.5249 |
| 148789 | B3GALNT2 | CCI_3 | Human | Cervix | CC | 2.71e-07 | 8.09e-01 | 0.516 |
| 148789 | B3GALNT2 | T3 | Human | Cervix | CC | 4.09e-06 | 2.30e-01 | 0.1389 |
| 148789 | B3GALNT2 | LZE4T | Human | Esophagus | ESCC | 1.88e-04 | 1.68e-01 | 0.0811 |
| 148789 | B3GALNT2 | LZE7T | Human | Esophagus | ESCC | 3.54e-08 | 5.10e-01 | 0.0667 |
| 148789 | B3GALNT2 | LZE8T | Human | Esophagus | ESCC | 4.42e-02 | 1.42e-01 | 0.067 |
| 148789 | B3GALNT2 | LZE24T | Human | Esophagus | ESCC | 3.19e-11 | 4.02e-01 | 0.0596 |
| 148789 | B3GALNT2 | LZE21T | Human | Esophagus | ESCC | 6.31e-05 | 2.75e-01 | 0.0655 |
| 148789 | B3GALNT2 | P1T-E | Human | Esophagus | ESCC | 1.07e-03 | 4.38e-01 | 0.0875 |
| 148789 | B3GALNT2 | P2T-E | Human | Esophagus | ESCC | 1.33e-30 | 5.17e-01 | 0.1177 |
| 148789 | B3GALNT2 | P4T-E | Human | Esophagus | ESCC | 7.66e-15 | 3.03e-01 | 0.1323 |
| 148789 | B3GALNT2 | P5T-E | Human | Esophagus | ESCC | 1.30e-22 | 3.95e-01 | 0.1327 |
| 148789 | B3GALNT2 | P8T-E | Human | Esophagus | ESCC | 1.07e-07 | 1.30e-01 | 0.0889 |
| 148789 | B3GALNT2 | P9T-E | Human | Esophagus | ESCC | 4.70e-08 | 3.71e-01 | 0.1131 |
| 148789 | B3GALNT2 | P10T-E | Human | Esophagus | ESCC | 7.27e-37 | 6.04e-01 | 0.116 |
| 148789 | B3GALNT2 | P11T-E | Human | Esophagus | ESCC | 2.36e-11 | 4.65e-01 | 0.1426 |
| 148789 | B3GALNT2 | P12T-E | Human | Esophagus | ESCC | 5.02e-15 | 3.25e-01 | 0.1122 |
| 148789 | B3GALNT2 | P15T-E | Human | Esophagus | ESCC | 6.87e-09 | 3.06e-01 | 0.1149 |
| 148789 | B3GALNT2 | P16T-E | Human | Esophagus | ESCC | 1.42e-19 | 4.03e-01 | 0.1153 |
| Page: 1 2 3 4 5 |
| Tissue | Expression Dynamics | Abbreviation |
| Cervix | 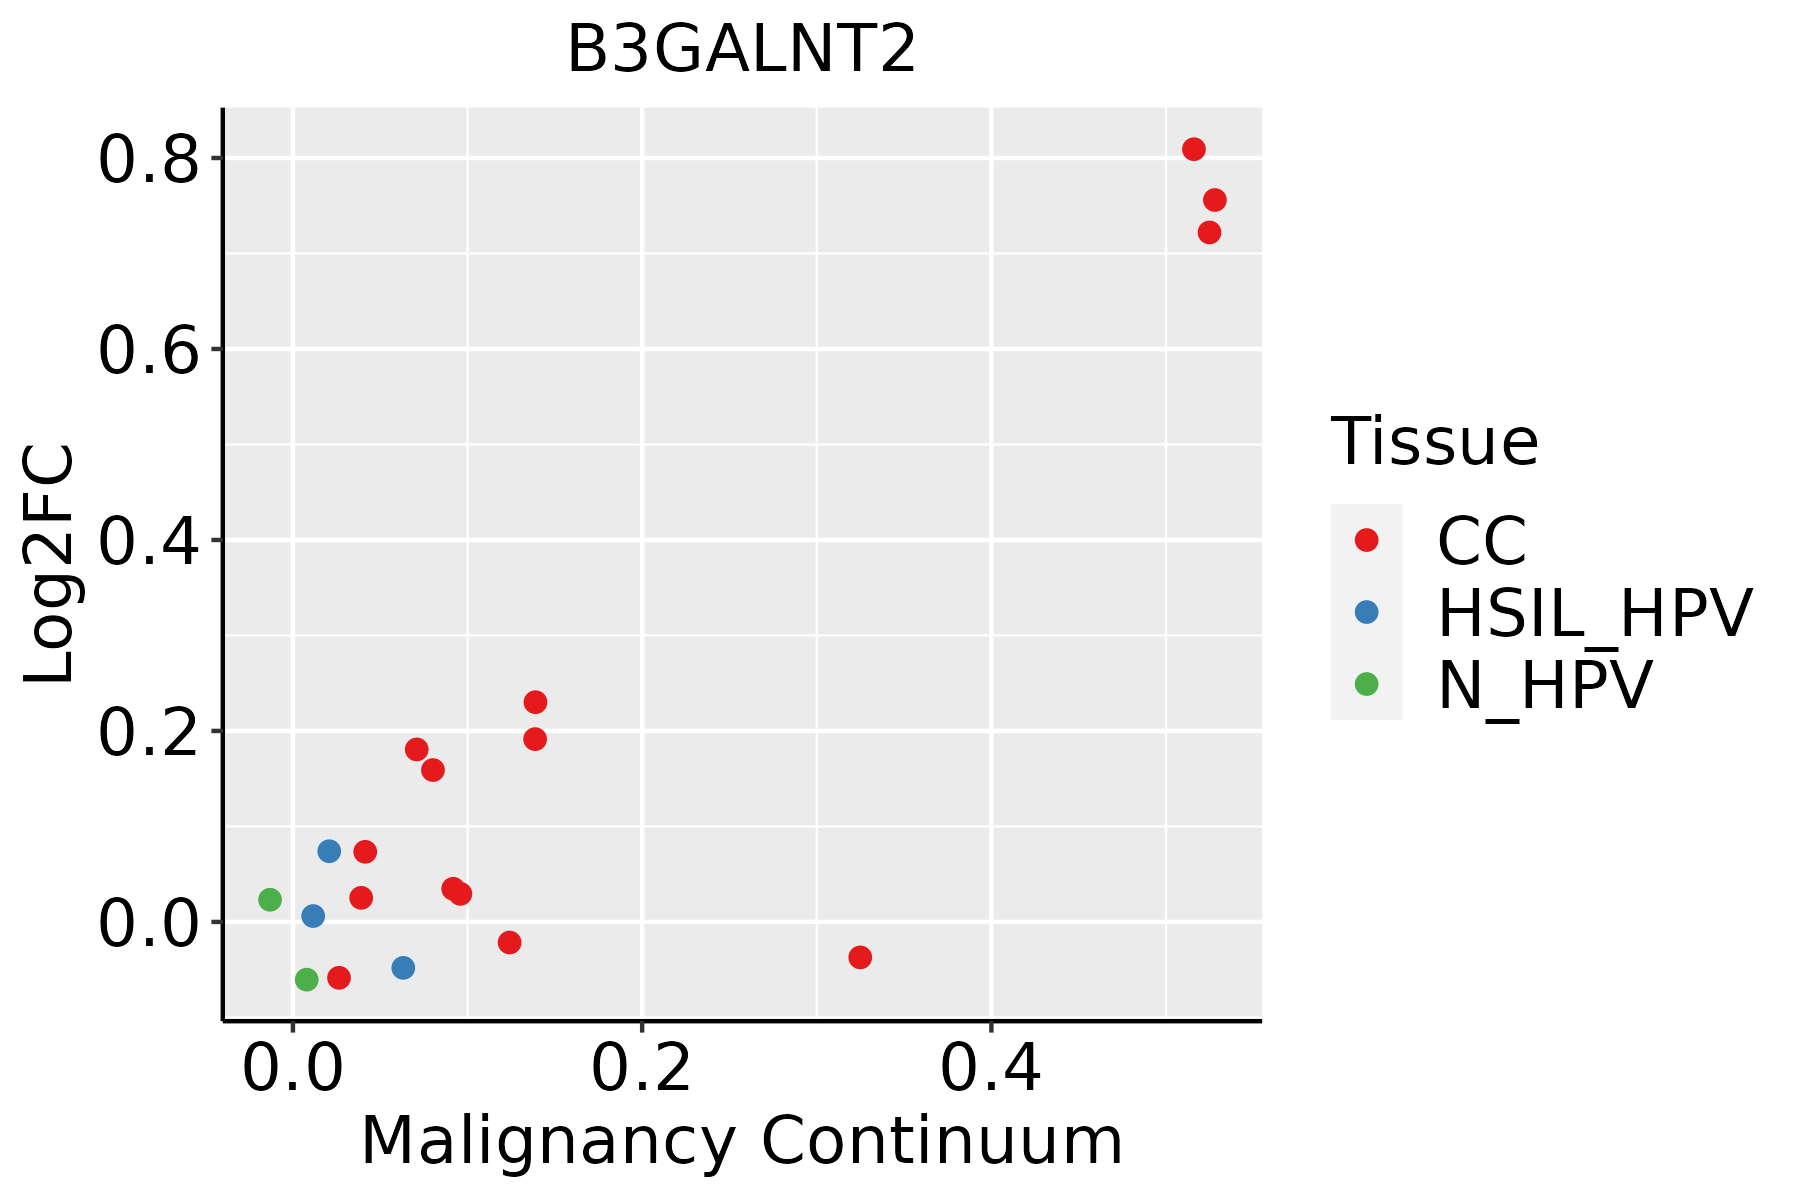 | CC: Cervix cancer |
| HSIL_HPV: HPV-infected high-grade squamous intraepithelial lesions | ||
| N_HPV: HPV-infected normal cervix | ||
| Esophagus |  | ESCC: Esophageal squamous cell carcinoma |
| HGIN: High-grade intraepithelial neoplasias | ||
| LGIN: Low-grade intraepithelial neoplasias | ||
| Lung |  | AAH: Atypical adenomatous hyperplasia |
| AIS: Adenocarcinoma in situ | ||
| IAC: Invasive lung adenocarcinoma | ||
| MIA: Minimally invasive adenocarcinoma | ||
| Thyroid |  | ATC: Anaplastic thyroid cancer |
| HT: Hashimoto's thyroiditis | ||
| PTC: Papillary thyroid cancer |
| ∗log2FC in expression of this searched gene in stem-like cells from each diseased tissue sample relative to stem-like cells in normal samples in each tissue plotted against the malignancy continuum. Samples are colored based on if they are from different disease stage. |
Top |
Malignant transformation related pathway analysis |
| Find out the enriched GO biological processes and KEGG pathways involved in transition from healthy to precancer to cancer |
| Tissue | Disease Stage | Enriched GO biological Processes |
| Colorectum | AD |  |
| Colorectum | SER |  |
| Colorectum | MSS |  |
| Colorectum | MSI-H |  |
| Colorectum | FAP |  |
| ∗Top 15 enriched GO BP terms are showed in the bar plot of each disease state in each tissue. Each row represents a significant GO biological process which is colored according to the -log10(p.adjust). |
| Page: 1 2 3 4 5 6 7 8 9 |
| GO ID | Tissue | Disease Stage | Description | Gene Ratio | Bg Ratio | pvalue | p.adjust | Count |
| GO:00091002 | Esophagus | ESCC | glycoprotein metabolic process | 226/8552 | 387/18723 | 2.64e-07 | 3.94e-06 | 226 |
| GO:00700854 | Esophagus | ESCC | glycosylation | 144/8552 | 240/18723 | 5.12e-06 | 5.38e-05 | 144 |
| GO:00064865 | Esophagus | ESCC | protein glycosylation | 135/8552 | 226/18723 | 1.36e-05 | 1.24e-04 | 135 |
| GO:00434135 | Esophagus | ESCC | macromolecule glycosylation | 135/8552 | 226/18723 | 1.36e-05 | 1.24e-04 | 135 |
| GO:00091012 | Esophagus | ESCC | glycoprotein biosynthetic process | 181/8552 | 317/18723 | 2.54e-05 | 2.15e-04 | 181 |
| GO:00064931 | Esophagus | ESCC | protein O-linked glycosylation | 51/8552 | 86/18723 | 7.54e-03 | 2.70e-02 | 51 |
| GO:0006493 | Lung | AIS | protein O-linked glycosylation | 17/1849 | 86/18723 | 4.04e-03 | 3.65e-02 | 17 |
| GO:00064863 | Lung | AIS | protein glycosylation | 35/1849 | 226/18723 | 4.93e-03 | 4.27e-02 | 35 |
| GO:00434133 | Lung | AIS | macromolecule glycosylation | 35/1849 | 226/18723 | 4.93e-03 | 4.27e-02 | 35 |
| GO:00064866 | Thyroid | PTC | protein glycosylation | 94/5968 | 226/18723 | 1.25e-03 | 7.13e-03 | 94 |
| GO:00434136 | Thyroid | PTC | macromolecule glycosylation | 94/5968 | 226/18723 | 1.25e-03 | 7.13e-03 | 94 |
| GO:00700855 | Thyroid | PTC | glycosylation | 96/5968 | 240/18723 | 4.57e-03 | 2.15e-02 | 96 |
| GO:00091013 | Thyroid | PTC | glycoprotein biosynthetic process | 123/5968 | 317/18723 | 5.05e-03 | 2.33e-02 | 123 |
| GO:00091003 | Thyroid | PTC | glycoprotein metabolic process | 147/5968 | 387/18723 | 5.87e-03 | 2.64e-02 | 147 |
| GO:000648612 | Thyroid | ATC | protein glycosylation | 94/6293 | 226/18723 | 7.11e-03 | 2.82e-02 | 94 |
| GO:004341312 | Thyroid | ATC | macromolecule glycosylation | 94/6293 | 226/18723 | 7.11e-03 | 2.82e-02 | 94 |
| GO:000910011 | Thyroid | ATC | glycoprotein metabolic process | 153/6293 | 387/18723 | 7.90e-03 | 3.06e-02 | 153 |
| Page: 1 |
| Pathway ID | Tissue | Disease Stage | Description | Gene Ratio | Bg Ratio | pvalue | p.adjust | qvalue | Count |
| Page: 1 |
Top |
Cell-cell communication analysis |
| Identification of potential cell-cell interactions between two cell types and their ligand-receptor pairs for different disease states |
| Ligand | Receptor | LRpair | Pathway | Tissue | Disease Stage |
| Page: 1 |
Top |
Single-cell gene regulatory network inference analysis |
| Find out the significant the regulons (TFs) and the target genes of each regulon across cell types for different disease states |
| TF | Cell Type | Tissue | Disease Stage | Target Gene | RSS | Regulon Activity |
| ∗The dot plots of a searched regulon are shown for all cell subpopulations in each disease state of each tissue based on the regulon specific score inferred using pySCENIC and by calculating the average expression. |
| Page: 1 |
Top |
Somatic mutation of malignant transformation related genes |
| Annotation of somatic variants for genes involved in malignant transformation |
| Hugo Symbol | Variant Class | Variant Classification | dbSNP RS | HGVSc | HGVSp | HGVSp Short | SWISSPROT | BIOTYPE | SIFT | PolyPhen | Tumor Sample Barcode | Tissue | Histology | Sex | Age | Stage | Therapy Types | Drugs | Outcome |
| B3GALNT2 | SNV | Missense_Mutation | novel | c.179N>T | p.Ala60Val | p.A60V | Q8NCR0 | protein_coding | deleterious(0) | probably_damaging(0.989) | TCGA-LL-A73Z-01 | Breast | breast invasive carcinoma | Female | <65 | III/IV | Chemotherapy | adriamycin | PD |
| B3GALNT2 | insertion | Nonsense_Mutation | novel | c.778_779insAGAGAAAGAAAG | p.Leu260delinsTer | p.L260delins* | Q8NCR0 | protein_coding | TCGA-AR-A0U2-01 | Breast | breast invasive carcinoma | Female | <65 | III/IV | Hormone Therapy | tamoxiphen | PD | ||
| B3GALNT2 | SNV | Missense_Mutation | rs747653180 | c.259C>T | p.Arg87Cys | p.R87C | Q8NCR0 | protein_coding | deleterious(0.01) | probably_damaging(0.98) | TCGA-2W-A8YY-01 | Cervix | cervical & endocervical cancer | Female | <65 | I/II | Chemotherapy | cisplatin | CR |
| B3GALNT2 | SNV | Missense_Mutation | c.1479T>G | p.Asp493Glu | p.D493E | Q8NCR0 | protein_coding | deleterious(0.01) | benign(0.424) | TCGA-FU-A3HZ-01 | Cervix | cervical & endocervical cancer | Female | <65 | I/II | Chemotherapy | cisplatin | CR | |
| B3GALNT2 | SNV | Missense_Mutation | c.148C>G | p.His50Asp | p.H50D | Q8NCR0 | protein_coding | deleterious(0.04) | benign(0.108) | TCGA-Q1-A73O-01 | Cervix | cervical & endocervical cancer | Female | <65 | I/II | Chemotherapy | cisplatin | CR | |
| B3GALNT2 | deletion | Frame_Shift_Del | c.1148delG | p.Gly383GlufsTer5 | p.G383Efs*5 | Q8NCR0 | protein_coding | TCGA-AA-3973-01 | Colorectum | colon adenocarcinoma | Male | >=65 | III/IV | Targeted Molecular therapy | bevacizumab | SD | |||
| B3GALNT2 | SNV | Missense_Mutation | novel | c.973N>C | p.Val325Leu | p.V325L | Q8NCR0 | protein_coding | tolerated(0.05) | benign(0.015) | TCGA-A5-A0G2-01 | Endometrium | uterine corpus endometrioid carcinoma | Female | <65 | III/IV | Unknown | Unknown | SD |
| B3GALNT2 | SNV | Missense_Mutation | rs377646173 | c.493N>A | p.Asp165Asn | p.D165N | Q8NCR0 | protein_coding | tolerated(0.25) | benign(0.003) | TCGA-A5-A0G2-01 | Endometrium | uterine corpus endometrioid carcinoma | Female | <65 | III/IV | Unknown | Unknown | SD |
| B3GALNT2 | SNV | Missense_Mutation | novel | c.1076N>A | p.Cys359Tyr | p.C359Y | Q8NCR0 | protein_coding | deleterious(0.04) | possibly_damaging(0.586) | TCGA-A5-A2K3-01 | Endometrium | uterine corpus endometrioid carcinoma | Female | >=65 | I/II | Chemotherapy | carboplatin | SD |
| B3GALNT2 | SNV | Missense_Mutation | novel | c.256N>A | p.Gln86Lys | p.Q86K | Q8NCR0 | protein_coding | tolerated(0.32) | benign(0) | TCGA-A5-A2K5-01 | Endometrium | uterine corpus endometrioid carcinoma | Female | >=65 | I/II | Unknown | Unknown | SD |
| Page: 1 2 3 4 |
Top |
Related drugs of malignant transformation related genes |
| Identification of chemicals and drugs interact with genes involved in malignant transfromation |
| (DGIdb 4.0) |
| Entrez ID | Symbol | Category | Interaction Types | Drug Claim Name | Drug Name | PMIDs |
| Page: 1 |

Copyright 2023-Present -The University of Texas Health Science Center at Houston |