Schematic overview of the cellular and molecular mechanisms involved in the cancer progression, including the proposed cellular and molecular mechanisms in cancer cells trajectory. AT1: alveolar type 1 cells; AT2: alveolar type 2 cells; AAH: atypical adenomatous hyperplasia; AIS: adenocarcinoma in situ; MIA: minimally invasive adenocarcinoma; IA: invasive adenocarcinoma; EMT: epithelial-mesenchymal transition

Home

Download

Statistics

Help

Contact

Center for Computational Systems Medicine
leaf

Gene summary

leaf

Malignant transformation analysis

leaf

Malignant transformation related pathway analysis

leaf

Cell-cell communication analysis

leaf

Single-cell gene regulatory network inference analysis

leaf

Somatic mutation of malignant transformation related genes

leaf

Related drugs of malignant transformation related genes

Gene: AZIN1

Gene summary for AZIN1

check button Gene summary.

Gene informationSpeciesHuman
Gene symbol

AZIN1

Gene ID

51582

Gene nameantizyme inhibitor 1
Gene AliasAZI
Cytomap8q22.3
Gene Typeprotein-coding
GO ID

GO:0006082

UniProtAcc

B3KTF6


Top

Malignant transformation analysis

check button Identification of the aberrant gene expression in precancerous and cancerous lesions by comparing the gene expression of stem-like cells in diseased tissues with normal stem cells
check button Malignant transformation involving gene list.
Entrez IDSymbolReplicatesSpeciesOrganTissueAdj P-valueLog2FCMalignancy
51582AZIN1LZE2DHumanEsophagusHGIN1.42e-02-1.80e-020.0642
51582AZIN1LZE4THumanEsophagusESCC1.62e-271.18e+000.0811
51582AZIN1LZE5THumanEsophagusESCC2.03e-022.77e-010.0514
51582AZIN1LZE7THumanEsophagusESCC6.25e-073.78e-010.0667
51582AZIN1LZE8THumanEsophagusESCC8.61e-114.85e-010.067
51582AZIN1LZE20THumanEsophagusESCC2.23e-107.28e-010.0662
51582AZIN1LZE22D1HumanEsophagusHGIN2.93e-03-3.64e-020.0595
51582AZIN1LZE22THumanEsophagusESCC5.45e-075.51e-010.068
51582AZIN1LZE24THumanEsophagusESCC6.51e-321.26e+000.0596
51582AZIN1LZE21THumanEsophagusESCC4.17e-037.36e-010.0655
51582AZIN1P1T-EHumanEsophagusESCC9.28e-066.25e-010.0875
51582AZIN1P2T-EHumanEsophagusESCC5.31e-529.78e-010.1177
51582AZIN1P4T-EHumanEsophagusESCC2.09e-389.73e-010.1323
51582AZIN1P5T-EHumanEsophagusESCC5.29e-429.89e-010.1327
51582AZIN1P8T-EHumanEsophagusESCC7.30e-276.80e-010.0889
51582AZIN1P9T-EHumanEsophagusESCC4.07e-144.08e-010.1131
51582AZIN1P10T-EHumanEsophagusESCC1.72e-154.99e-010.116
51582AZIN1P11T-EHumanEsophagusESCC5.30e-171.11e+000.1426
51582AZIN1P12T-EHumanEsophagusESCC3.44e-501.35e+000.1122
51582AZIN1P15T-EHumanEsophagusESCC4.70e-369.75e-010.1149
Page: 1 2 3 4 5 6 7 

check button Transcriptomic changes along malignancy continuum.
TissueExpression DynamicsAbbreviation
EsophagusThe image shows the transcriptomic changes along malignancy continuum.log2FC in expression of this searched gene in stem-like cells from each diseased tissue sample relative to stem-like cells in normal samples in each tissue plotted against the malignancy continuum. Samples are colored based on if they are from different disease stage.ESCC: Esophageal squamous cell carcinoma
HGIN: High-grade intraepithelial neoplasias
LGIN: Low-grade intraepithelial neoplasias
LiverThe image shows the transcriptomic changes along malignancy continuum.log2FC in expression of this searched gene in stem-like cells from each diseased tissue sample relative to stem-like cells in normal samples in each tissue plotted against the malignancy continuum. Samples are colored based on if they are from different disease stage.
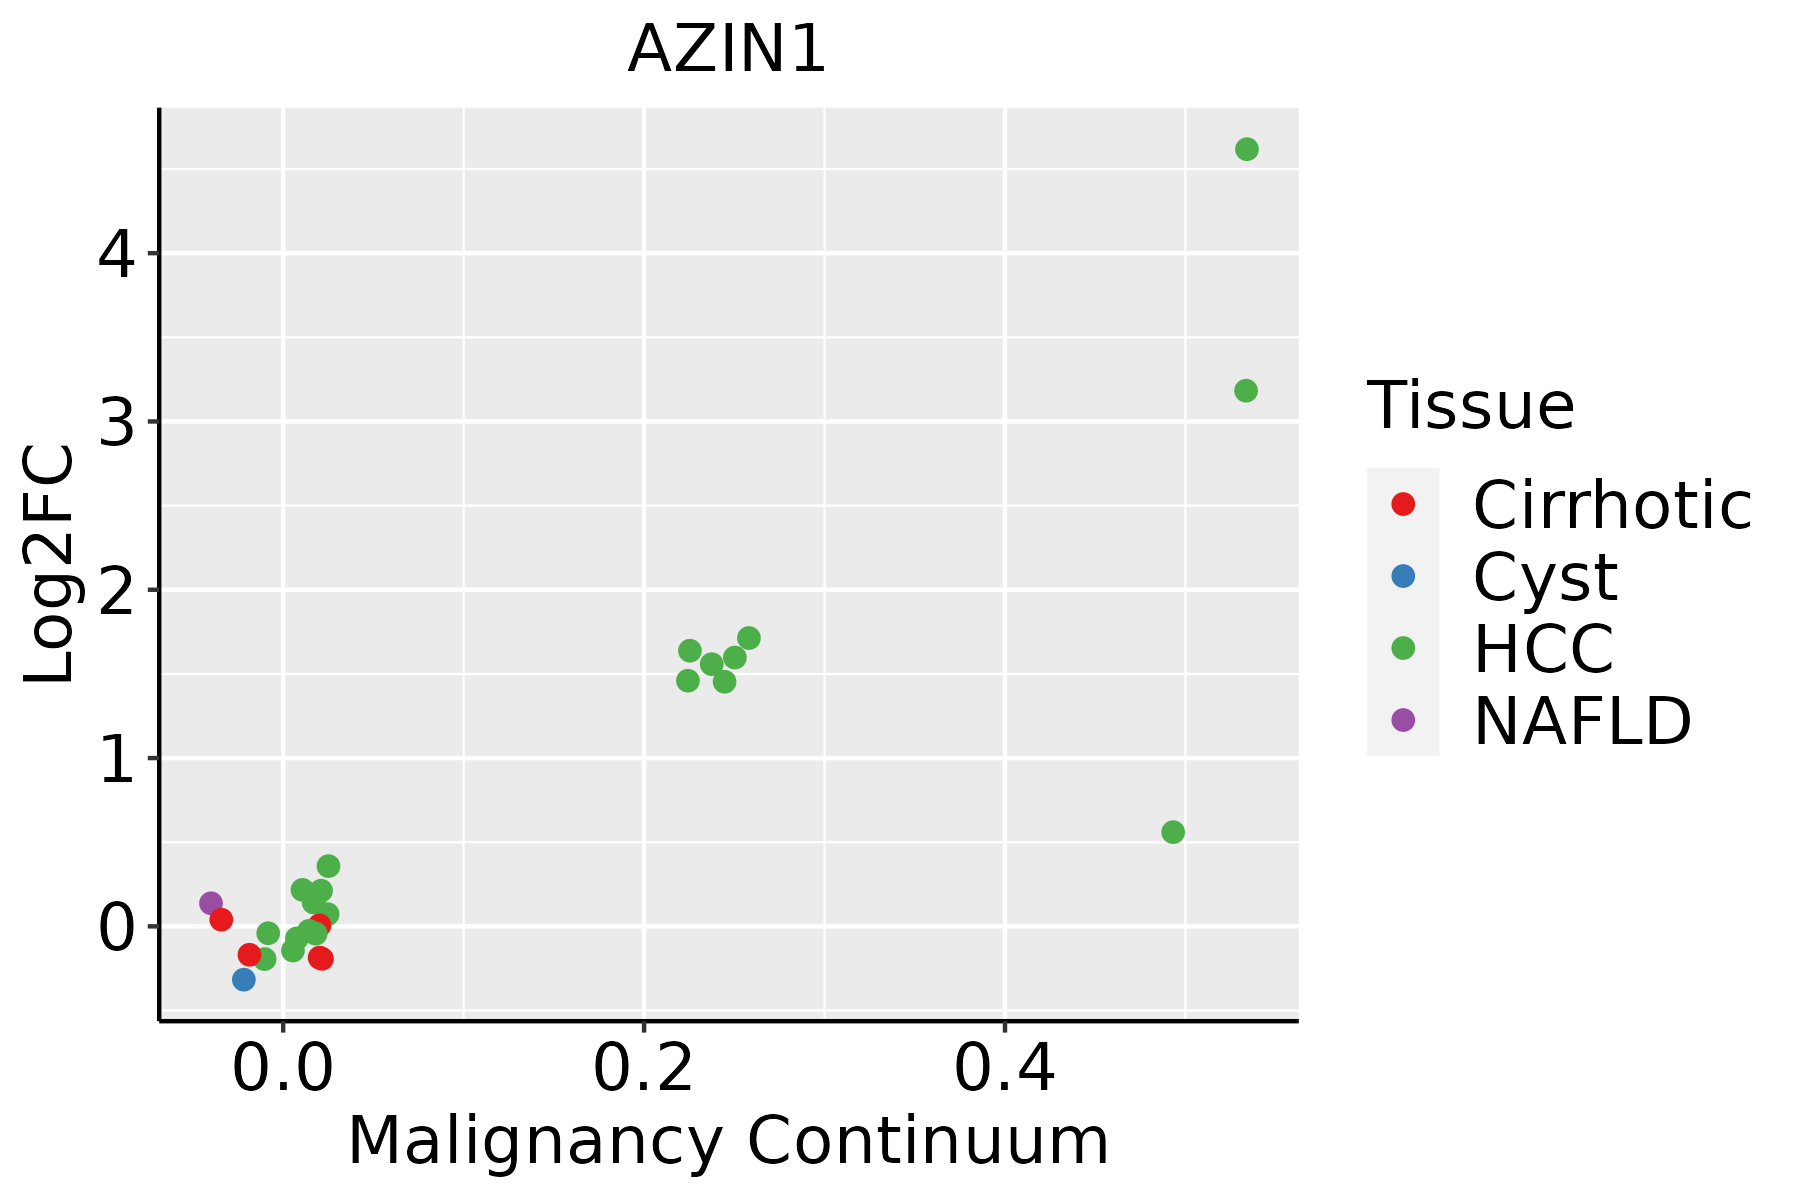
HCC: Hepatocellular carcinoma
NAFLD: Non-alcoholic fatty liver disease
LungThe image shows the transcriptomic changes along malignancy continuum.log2FC in expression of this searched gene in stem-like cells from each diseased tissue sample relative to stem-like cells in normal samples in each tissue plotted against the malignancy continuum. Samples are colored based on if they are from different disease stage.
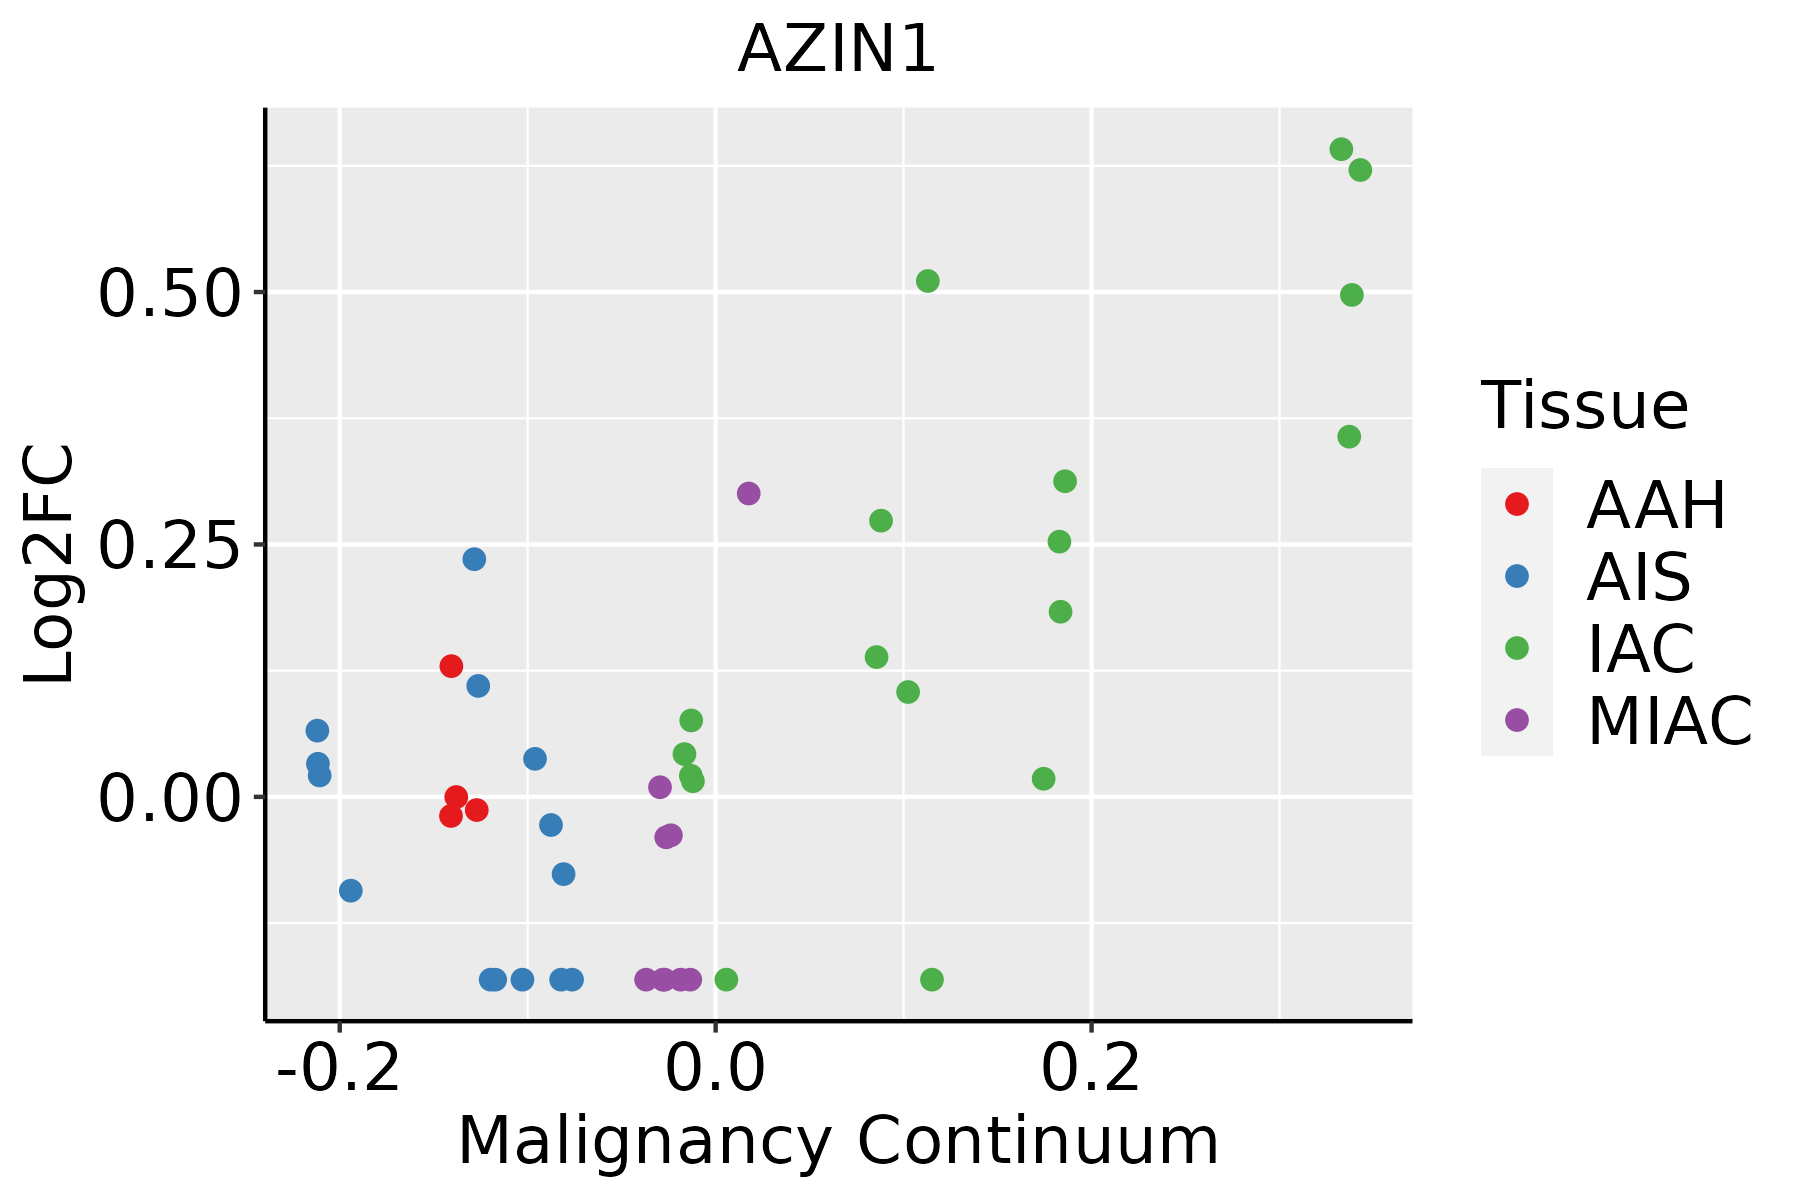
AAH: Atypical adenomatous hyperplasia
AIS: Adenocarcinoma in situ
IAC: Invasive lung adenocarcinoma
MIA: Minimally invasive adenocarcinoma
Oral CavityThe image shows the transcriptomic changes along malignancy continuum.log2FC in expression of this searched gene in stem-like cells from each diseased tissue sample relative to stem-like cells in normal samples in each tissue plotted against the malignancy continuum. Samples are colored based on if they are from different disease stage.EOLP: Erosive Oral lichen planus
LP: leukoplakia
NEOLP: Non-erosive oral lichen planus
OSCC: Oral squamous cell carcinoma
ProstateThe image shows the transcriptomic changes along malignancy continuum.log2FC in expression of this searched gene in stem-like cells from each diseased tissue sample relative to stem-like cells in normal samples in each tissue plotted against the malignancy continuum. Samples are colored based on if they are from different disease stage.BPH: Benign Prostatic Hyperplasia
SkinThe image shows the transcriptomic changes along malignancy continuum.log2FC in expression of this searched gene in stem-like cells from each diseased tissue sample relative to stem-like cells in normal samples in each tissue plotted against the malignancy continuum. Samples are colored based on if they are from different disease stage.AK: Actinic keratosis
cSCC: Cutaneous squamous cell carcinoma
SCCIS:squamous cell carcinoma in situ
ThyroidThe image shows the transcriptomic changes along malignancy continuum.log2FC in expression of this searched gene in stem-like cells from each diseased tissue sample relative to stem-like cells in normal samples in each tissue plotted against the malignancy continuum. Samples are colored based on if they are from different disease stage.ATC: Anaplastic thyroid cancer
HT: Hashimoto's thyroiditis
PTC: Papillary thyroid cancer
∗log2FC in expression of this searched gene in stem-like cells from each diseased tissue sample relative to stem-like cells in normal samples in each tissue plotted against the malignancy continuum. Samples are colored based on if they are from different disease stage.

Top

Malignant transformation related pathway analysis

check buttonFind out the enriched GO biological processes and KEGG pathways involved in transition from healthy to precancer to cancer
check button Figure of enriched GO biological processes.
TissueDisease StageEnriched GO biological Processes
ColorectumADGO analysis - Figure of enriched GO biological processes: Top 15 enriched GO BP terms are showed in the bar plot of each disease state in each tissue. Each row represents a significant GO biological process which is colored according to the -log10(p.adjust).
ColorectumSERGO analysis - Figure of enriched GO biological processes: Top 15 enriched GO BP terms are showed in the bar plot of each disease state in each tissue. Each row represents a significant GO biological process which is colored according to the -log10(p.adjust).
ColorectumMSSGO analysis - Figure of enriched GO biological processes: Top 15 enriched GO BP terms are showed in the bar plot of each disease state in each tissue. Each row represents a significant GO biological process which is colored according to the -log10(p.adjust).
ColorectumMSI-HGO analysis - Figure of enriched GO biological processes: Top 15 enriched GO BP terms are showed in the bar plot of each disease state in each tissue. Each row represents a significant GO biological process which is colored according to the -log10(p.adjust).
ColorectumFAPGO analysis - Figure of enriched GO biological processes: Top 15 enriched GO BP terms are showed in the bar plot of each disease state in each tissue. Each row represents a significant GO biological process which is colored according to the -log10(p.adjust).
∗Top 15 enriched GO BP terms are showed in the bar plot of each disease state in each tissue. Each row represents a significant GO biological process which is colored according to the -log10(p.adjust).
Page: 1 2 3 4 5 6 7 8 9 

check button Enriched GO biological processes.
GO IDTissueDisease StageDescriptionGene RatioBg Ratiopvaluep.adjustCount
GO:004217627EsophagusHGINregulation of protein catabolic process119/2587391/187238.09e-182.43e-15119
GO:000989520EsophagusHGINnegative regulation of catabolic process87/2587320/187231.74e-101.68e-0887
GO:004217720EsophagusHGINnegative regulation of protein catabolic process37/2587121/187231.47e-065.56e-0537
GO:0042176111EsophagusESCCregulation of protein catabolic process280/8552391/187238.65e-262.39e-23280
GO:0009895111EsophagusESCCnegative regulation of catabolic process201/8552320/187233.88e-101.05e-08201
GO:0042177111EsophagusESCCnegative regulation of protein catabolic process84/8552121/187231.03e-071.69e-0684
GO:004217612LiverCirrhoticregulation of protein catabolic process181/4634391/187237.94e-212.77e-18181
GO:19016051LiverCirrhoticalpha-amino acid metabolic process82/4634195/187237.72e-082.30e-0682
GO:000989512LiverCirrhoticnegative regulation of catabolic process121/4634320/187231.21e-073.39e-06121
GO:000652011LiverCirrhoticcellular amino acid metabolic process103/4634284/187238.88e-061.30e-04103
GO:004217712LiverCirrhoticnegative regulation of protein catabolic process51/4634121/187231.93e-052.57e-0451
GO:0006595LiverCirrhoticpolyamine metabolic process12/463418/187232.07e-041.90e-0312
GO:00065962LiverCirrhoticpolyamine biosynthetic process10/463414/187233.11e-042.72e-0310
GO:0044106LiverCirrhoticcellular amine metabolic process43/4634113/187231.15e-037.83e-0343
GO:0006576LiverCirrhoticcellular biogenic amine metabolic process38/4634101/187232.72e-031.59e-0238
GO:0009308LiverCirrhoticamine metabolic process43/4634118/187233.03e-031.72e-0243
GO:004217622LiverHCCregulation of protein catabolic process267/7958391/187232.45e-257.38e-23267
GO:000989522LiverHCCnegative regulation of catabolic process196/7958320/187237.98e-123.35e-10196
GO:19016052LiverHCCalpha-amino acid metabolic process124/7958195/187232.07e-095.79e-08124
GO:00065202LiverHCCcellular amino acid metabolic process167/7958284/187231.91e-084.56e-07167
Page: 1 2 3 4 

check button Enriched KEGG pathways.
Pathway IDTissueDisease StageDescriptionGene RatioBg Ratiopvaluep.adjustqvalueCount
Page: 1 

Top

Cell-cell communication analysis

check buttonIdentification of potential cell-cell interactions between two cell types and their ligand-receptor pairs for different disease states
LigandReceptorLRpairPathwayTissueDisease Stage
Page: 1 

Top

Single-cell gene regulatory network inference analysis

check buttonFind out the significant the regulons (TFs) and the target genes of each regulon across cell types for different disease states
TFCell TypeTissueDisease StageTarget GeneRSSRegulon Activity
∗The dot plots of a searched regulon are shown for all cell subpopulations in each disease state of each tissue based on the regulon specific score inferred using pySCENIC and by calculating the average expression.
Page: 1 

Top

Somatic mutation of malignant transformation related genes

check buttonAnnotation of somatic variants for genes involved in malignant transformation
Hugo SymbolVariant ClassVariant ClassificationdbSNP RSHGVScHGVSpHGVSp ShortSWISSPROTBIOTYPESIFTPolyPhenTumor Sample BarcodeTissueHistologySexAgeStageTherapy TypesDrugsOutcome
AZIN1SNVMissense_Mutationrs779160903c.916N>Ap.Gly306Argp.G306RO14977protein_codingtolerated(0.21)benign(0.007)TCGA-A2-A0ER-01Breastbreast invasive carcinomaFemale<65I/IIChemotherapycytoxanSD
AZIN1SNVMissense_Mutationc.827N>Gp.Tyr276Cysp.Y276CO14977protein_codingdeleterious(0)probably_damaging(0.987)TCGA-A8-A06O-01Breastbreast invasive carcinomaFemale<65I/IIHormone TherapyletrozoleSD
AZIN1SNVMissense_Mutationc.371C>Tp.Ala124Valp.A124VO14977protein_codingdeleterious(0)probably_damaging(0.993)TCGA-AN-A0AK-01Breastbreast invasive carcinomaFemale>=65I/IIUnknownUnknownSD
AZIN1SNVMissense_Mutationc.1189N>Ap.Asp397Asnp.D397NO14977protein_codingtolerated(0.05)possibly_damaging(0.698)TCGA-D8-A140-01Breastbreast invasive carcinomaFemale<65I/IIChemotherapydoxorubicin+cyclophosphamidSD
AZIN1SNVMissense_Mutationc.784N>Ap.Glu262Lysp.E262KO14977protein_codingtolerated(0.32)benign(0.049)TCGA-EK-A2H0-01Cervixcervical & endocervical cancerFemale<65I/IIChemotherapycisplatinCR
AZIN1SNVMissense_Mutationc.461N>Gp.His154Argp.H154RO14977protein_codingtolerated(0.68)benign(0.007)TCGA-MY-A5BD-01Cervixcervical & endocervical cancerFemale<65I/IIChemotherapycisplatinCR
AZIN1SNVMissense_Mutationc.589C>Tp.His197Tyrp.H197YO14977protein_codingdeleterious(0)probably_damaging(0.988)TCGA-Q1-A73O-01Cervixcervical & endocervical cancerFemale<65I/IIChemotherapycisplatinCR
AZIN1SNVMissense_Mutationc.784N>Ap.Glu262Lysp.E262KO14977protein_codingtolerated(0.32)benign(0.049)TCGA-ZJ-A8QQ-01Cervixcervical & endocervical cancerFemale<65I/IIChemotherapycisplatinSD
AZIN1SNVMissense_Mutationc.937N>Gp.Met313Valp.M313VO14977protein_codingtolerated(0.92)benign(0.003)TCGA-AA-3663-01Colorectumcolon adenocarcinomaMale<65I/IIUnknownUnknownSD
AZIN1SNVMissense_Mutationc.748N>Ap.His250Asnp.H250NO14977protein_codingtolerated(0.13)benign(0)TCGA-AA-3977-01Colorectumcolon adenocarcinomaMale>=65I/IIUnknownUnknownSD
Page: 1 2 3 4 

Top

Related drugs of malignant transformation related genes

check buttonIdentification of chemicals and drugs interact with genes involved in malignant transfromation
(DGIdb 4.0)
Entrez IDSymbolCategoryInteraction TypesDrug Claim NameDrug NamePMIDs
Page: 1