
|
|||||
|
 | |
| |
| |
| |
| |
| |
|
Gene: AZGP1 |
Gene summary for AZGP1 |
| Gene information | Species | Human | Gene symbol | AZGP1 | Gene ID | 563 |
| Gene name | alpha-2-glycoprotein 1, zinc-binding | |
| Gene Alias | ZA2G | |
| Cytomap | 7q22.1 | |
| Gene Type | protein-coding | GO ID | GO:0001580 | UniProtAcc | A0A140VK00 |
Top |
Malignant transformation analysis |
| Identification of the aberrant gene expression in precancerous and cancerous lesions by comparing the gene expression of stem-like cells in diseased tissues with normal stem cells |
| Entrez ID | Symbol | Replicates | Species | Organ | Tissue | Adj P-value | Log2FC | Malignancy |
| 563 | AZGP1 | GSM4909277 | Human | Breast | Precancer | 2.84e-07 | -1.29e+00 | 0.0177 |
| 563 | AZGP1 | GSM4909280 | Human | Breast | Precancer | 1.53e-02 | -7.10e-01 | 0.0305 |
| 563 | AZGP1 | GSM4909281 | Human | Breast | IDC | 2.98e-39 | -9.65e-01 | 0.21 |
| 563 | AZGP1 | GSM4909282 | Human | Breast | IDC | 9.03e-59 | -1.25e+00 | -0.0288 |
| 563 | AZGP1 | GSM4909285 | Human | Breast | IDC | 6.66e-38 | -6.86e-01 | 0.21 |
| 563 | AZGP1 | GSM4909286 | Human | Breast | IDC | 6.67e-43 | -9.92e-01 | 0.1081 |
| 563 | AZGP1 | GSM4909287 | Human | Breast | IDC | 9.83e-35 | -9.57e-01 | 0.2057 |
| 563 | AZGP1 | GSM4909288 | Human | Breast | IDC | 2.97e-02 | -3.52e-01 | 0.0988 |
| 563 | AZGP1 | GSM4909289 | Human | Breast | IDC | 8.18e-03 | -5.21e-01 | 0.1064 |
| 563 | AZGP1 | GSM4909290 | Human | Breast | IDC | 1.24e-09 | -4.62e-01 | 0.2096 |
| 563 | AZGP1 | GSM4909291 | Human | Breast | IDC | 4.22e-59 | -1.49e+00 | 0.1753 |
| 563 | AZGP1 | GSM4909292 | Human | Breast | IDC | 3.67e-03 | -7.74e-01 | 0.1236 |
| 563 | AZGP1 | GSM4909293 | Human | Breast | IDC | 1.06e-07 | 2.00e-01 | 0.1581 |
| 563 | AZGP1 | GSM4909294 | Human | Breast | IDC | 2.64e-26 | -8.63e-01 | 0.2022 |
| 563 | AZGP1 | GSM4909296 | Human | Breast | IDC | 1.82e-10 | 3.27e-01 | 0.1524 |
| 563 | AZGP1 | GSM4909297 | Human | Breast | IDC | 6.05e-04 | -2.26e-01 | 0.1517 |
| 563 | AZGP1 | GSM4909298 | Human | Breast | IDC | 1.46e-09 | -1.38e-01 | 0.1551 |
| 563 | AZGP1 | GSM4909301 | Human | Breast | IDC | 1.22e-04 | -2.21e-01 | 0.1577 |
| 563 | AZGP1 | GSM4909303 | Human | Breast | IDC | 2.16e-03 | 3.82e-01 | 0.0438 |
| 563 | AZGP1 | GSM4909304 | Human | Breast | IDC | 1.29e-04 | -1.42e-01 | 0.1636 |
| Page: 1 2 3 4 5 6 7 8 |
| Tissue | Expression Dynamics | Abbreviation |
| Breast | 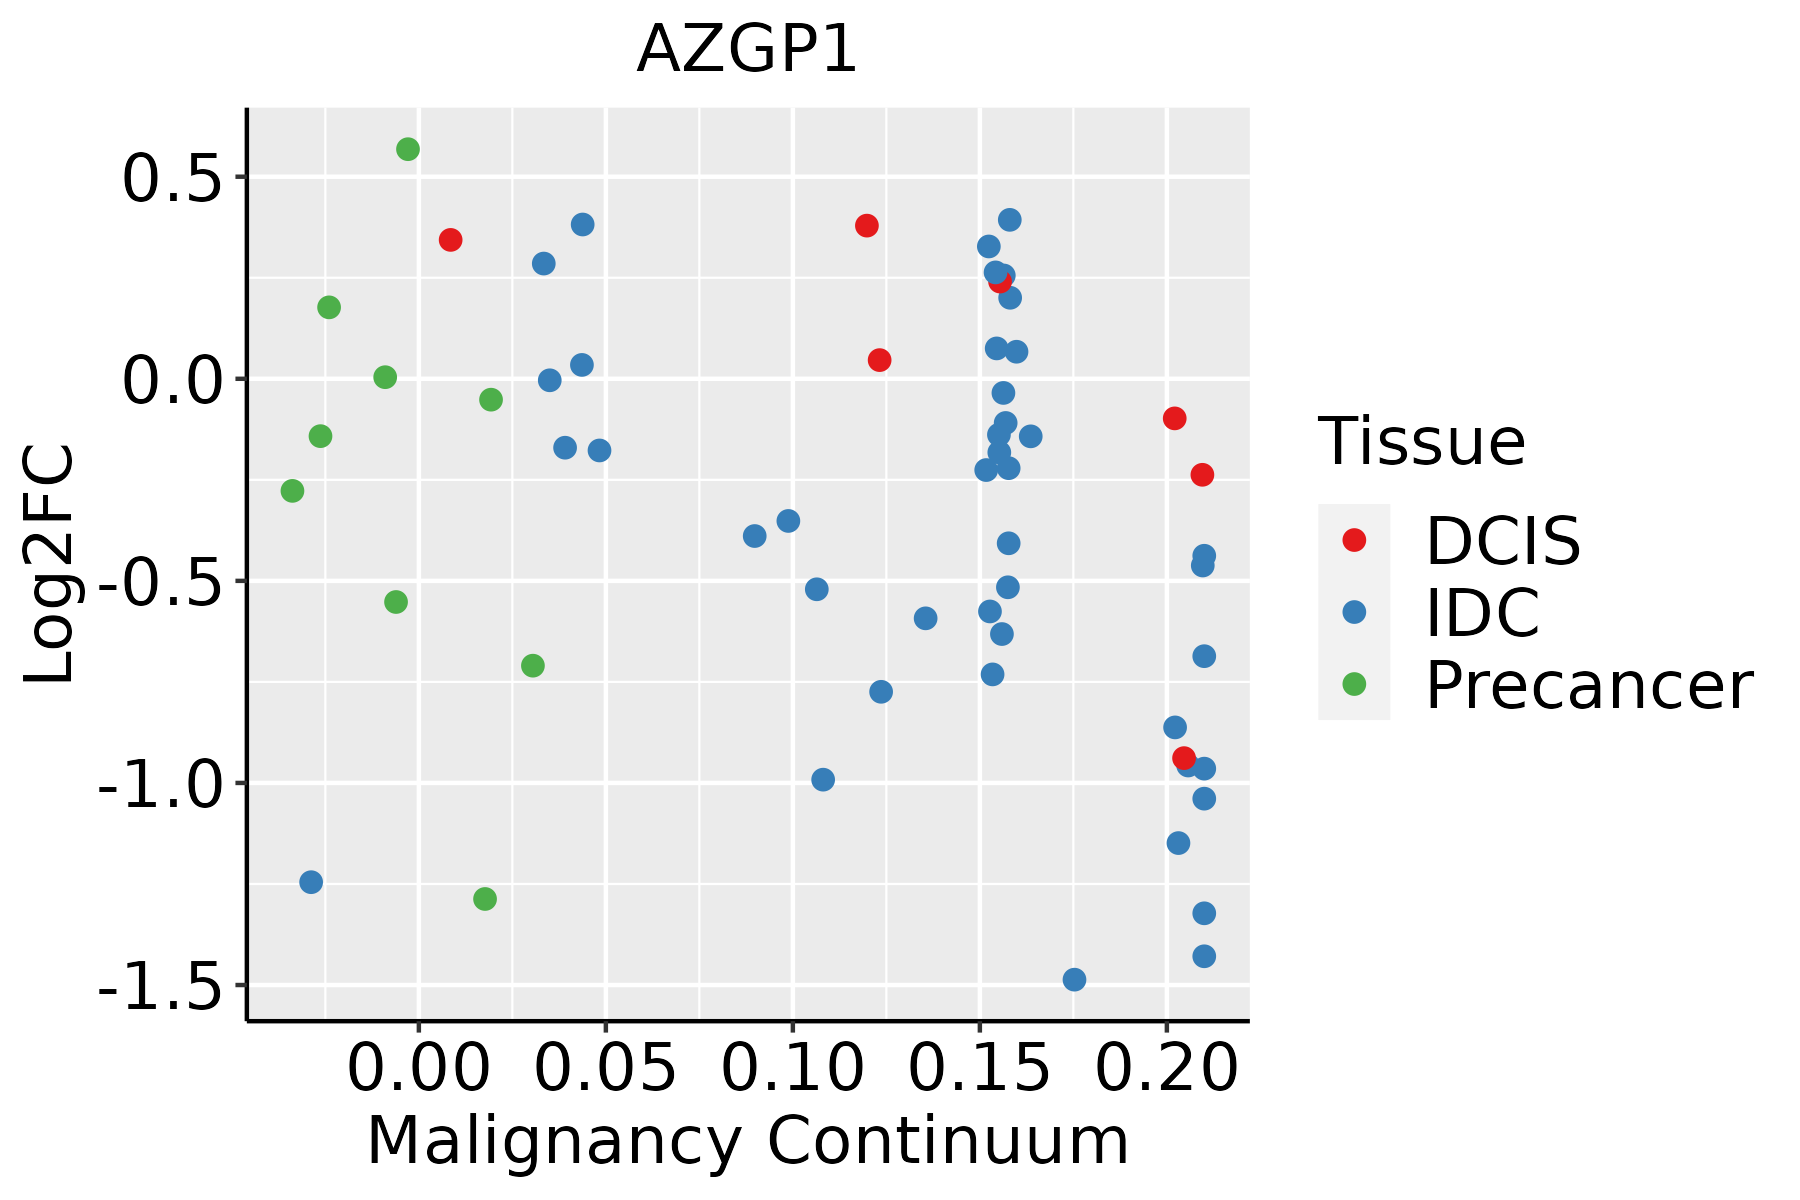 | IDC: Invasive ductal carcinoma |
| DCIS: Ductal carcinoma in situ | ||
| Precancer(BRCA1-mut): Precancerous lesion from BRCA1 mutation carriers | ||
| Esophagus |  | ESCC: Esophageal squamous cell carcinoma |
| HGIN: High-grade intraepithelial neoplasias | ||
| LGIN: Low-grade intraepithelial neoplasias | ||
| GC |  | CAG: Chronic atrophic gastritis |
| CAG with IM: Chronic atrophic gastritis with intestinal metaplasia | ||
| CSG: Chronic superficial gastritis | ||
| GC: Gastric cancer | ||
| SIM: Severe intestinal metaplasia | ||
| WIM: Wild intestinal metaplasia | ||
| Liver | 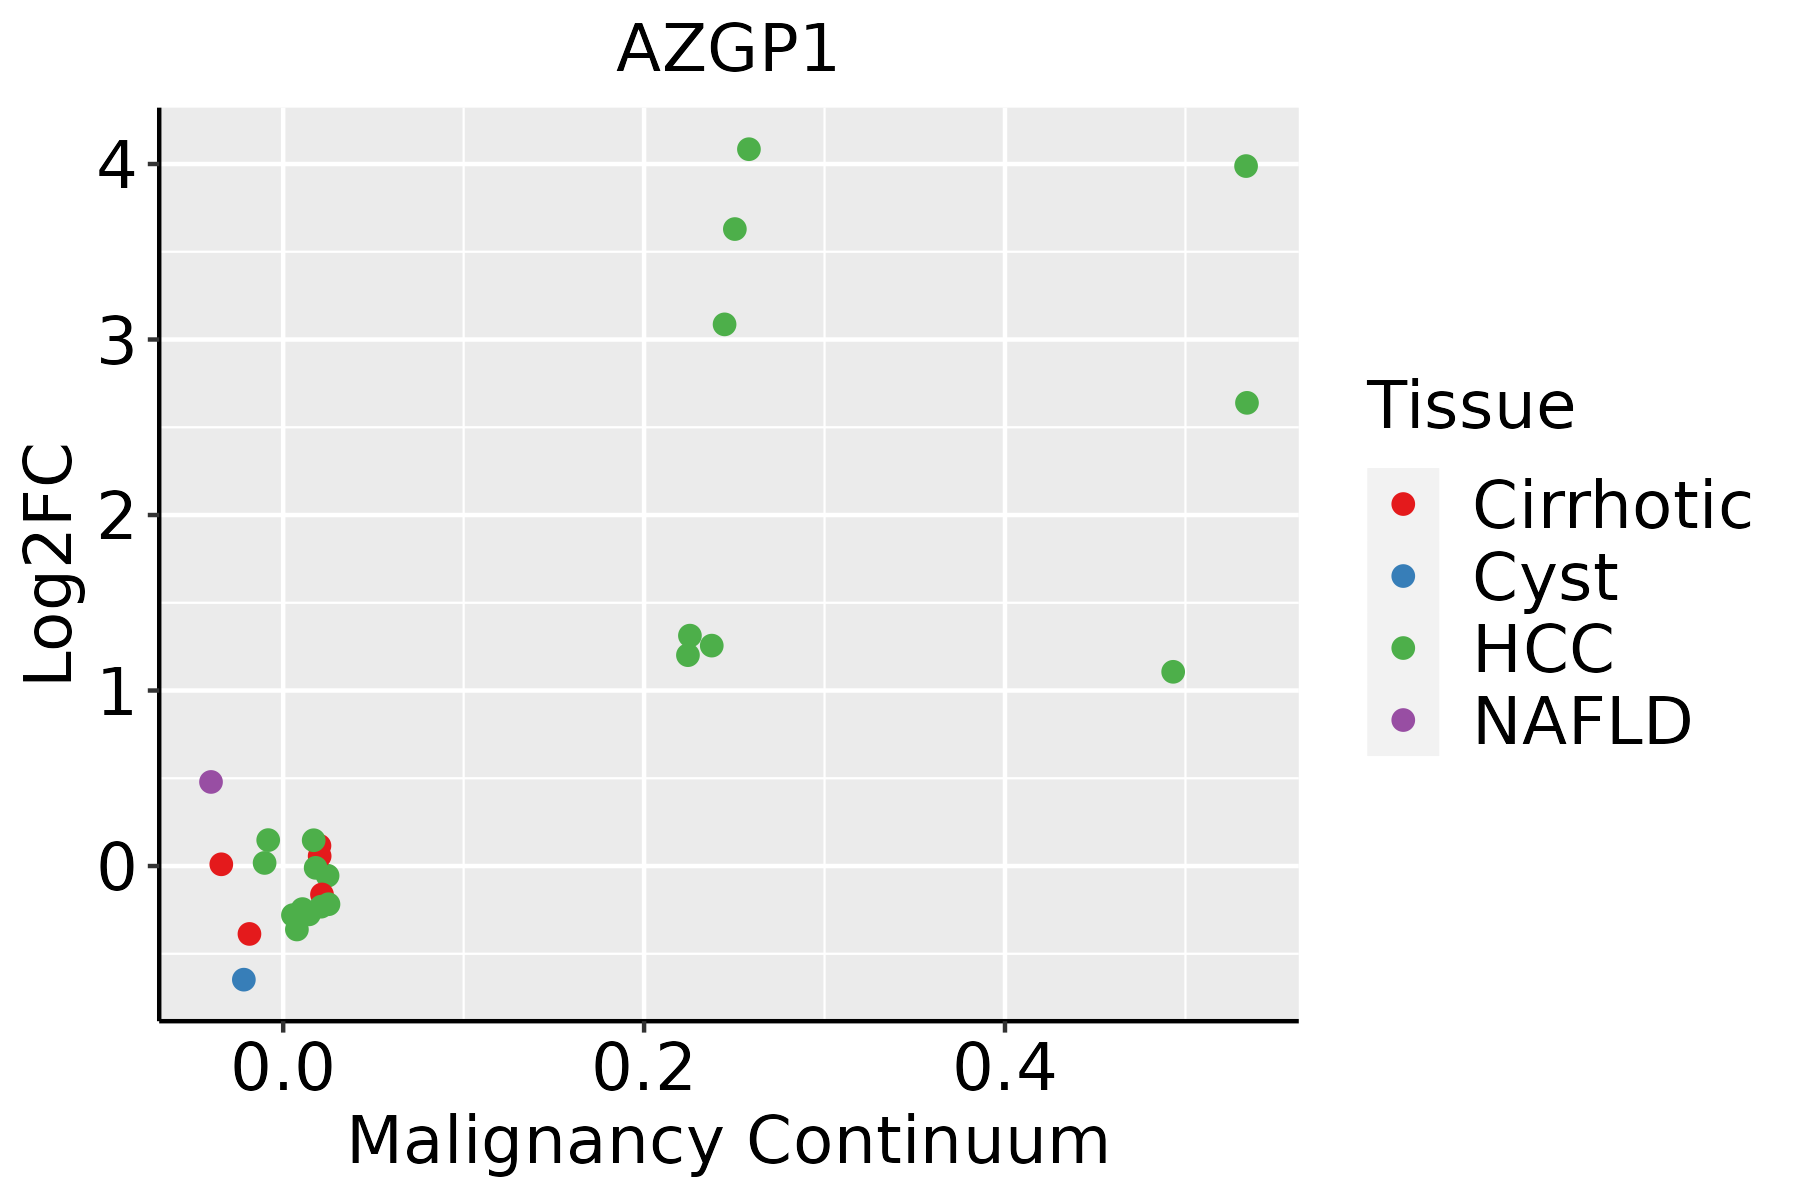 | HCC: Hepatocellular carcinoma |
| NAFLD: Non-alcoholic fatty liver disease | ||
| Oral Cavity | 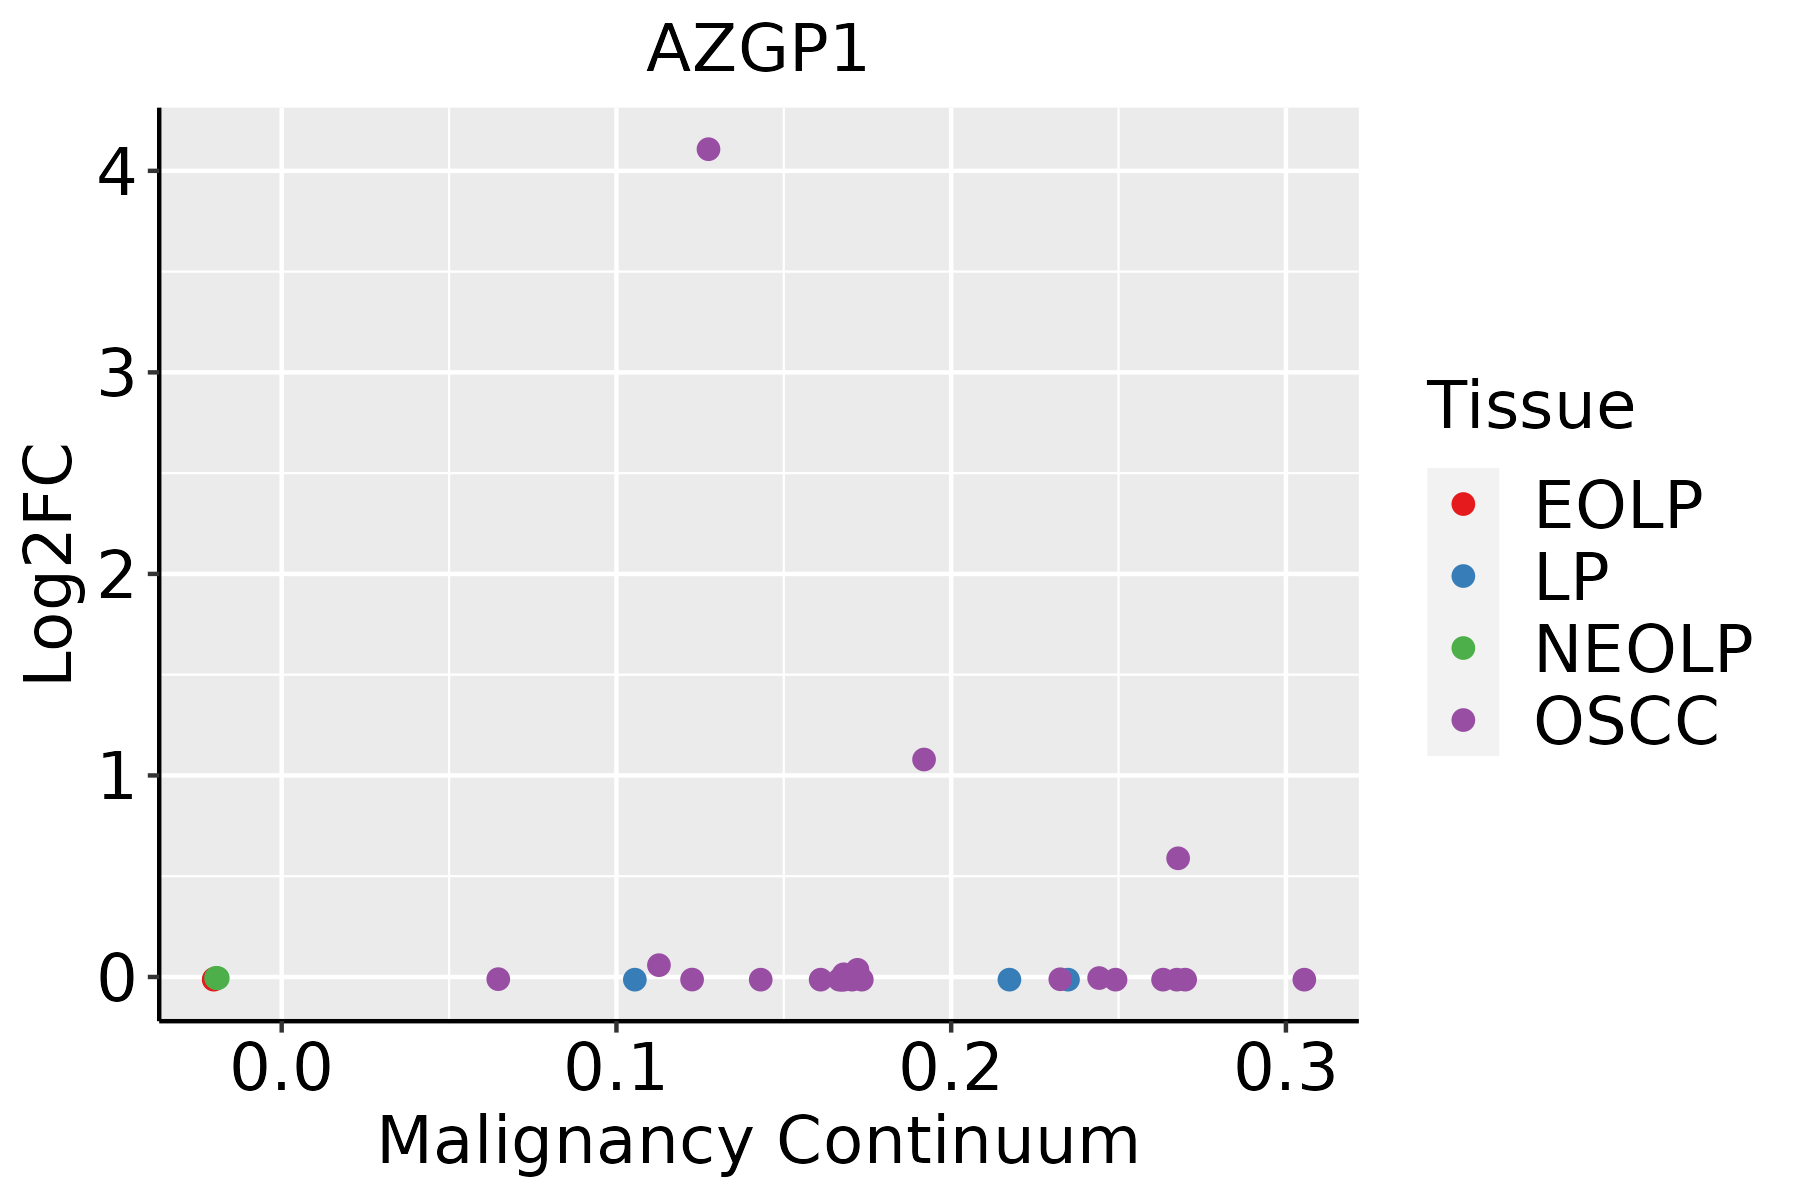 | EOLP: Erosive Oral lichen planus |
| LP: leukoplakia | ||
| NEOLP: Non-erosive oral lichen planus | ||
| OSCC: Oral squamous cell carcinoma | ||
| Prostate | 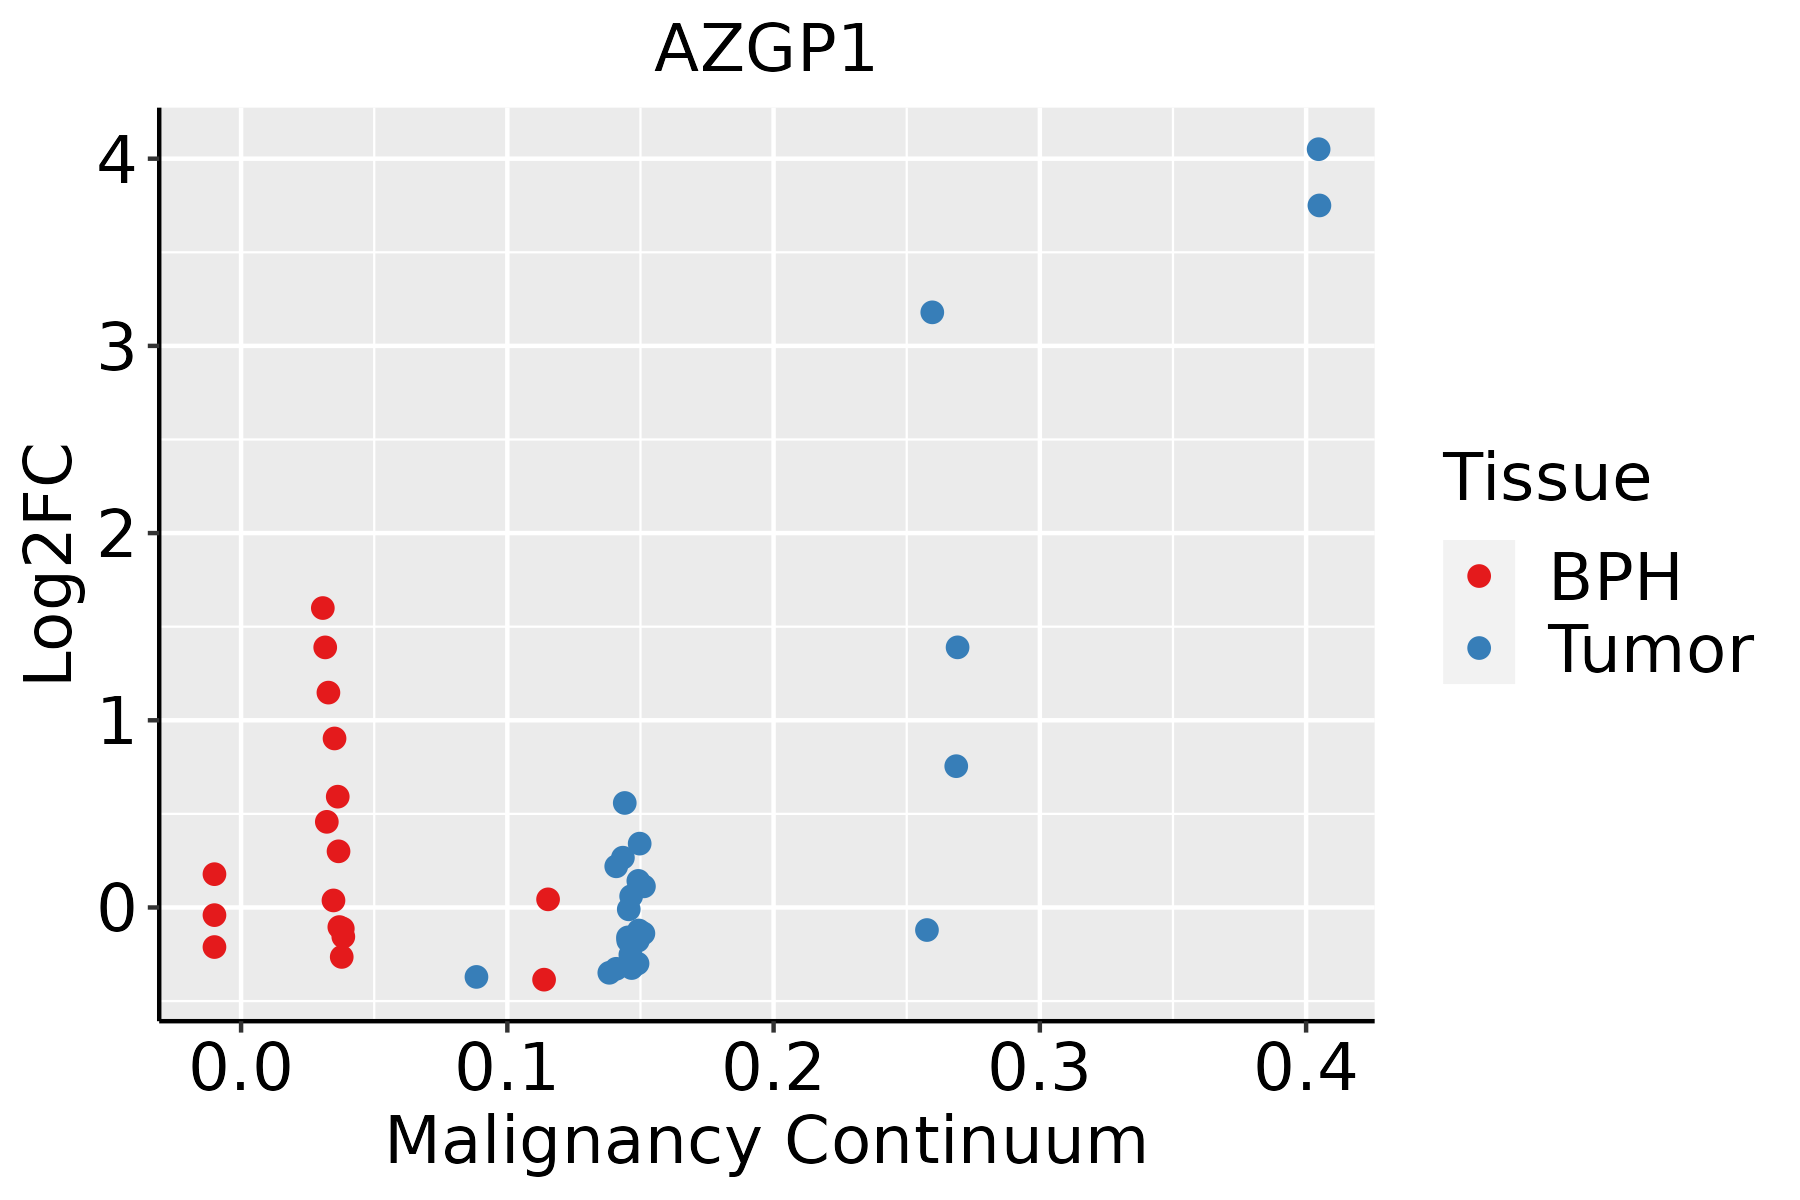 | BPH: Benign Prostatic Hyperplasia |
| ∗log2FC in expression of this searched gene in stem-like cells from each diseased tissue sample relative to stem-like cells in normal samples in each tissue plotted against the malignancy continuum. Samples are colored based on if they are from different disease stage. |
Top |
Malignant transformation related pathway analysis |
| Find out the enriched GO biological processes and KEGG pathways involved in transition from healthy to precancer to cancer |
| Tissue | Disease Stage | Enriched GO biological Processes |
| Colorectum | AD |  |
| Colorectum | SER |  |
| Colorectum | MSS |  |
| Colorectum | MSI-H |  |
| Colorectum | FAP |  |
| ∗Top 15 enriched GO BP terms are showed in the bar plot of each disease state in each tissue. Each row represents a significant GO biological process which is colored according to the -log10(p.adjust). |
| Page: 1 2 3 4 5 6 7 8 9 |
| GO ID | Tissue | Disease Stage | Description | Gene Ratio | Bg Ratio | pvalue | p.adjust | Count |
| GO:00024839 | Breast | Precancer | antigen processing and presentation of endogenous peptide antigen | 8/1080 | 19/18723 | 5.10e-06 | 1.53e-04 | 8 |
| GO:00198839 | Breast | Precancer | antigen processing and presentation of endogenous antigen | 9/1080 | 26/18723 | 8.75e-06 | 2.34e-04 | 9 |
| GO:00027117 | Breast | Precancer | positive regulation of T cell mediated immunity | 12/1080 | 56/18723 | 6.72e-05 | 1.35e-03 | 12 |
| GO:00019168 | Breast | Precancer | positive regulation of T cell mediated cytotoxicity | 8/1080 | 29/18723 | 1.73e-04 | 2.83e-03 | 8 |
| GO:00480029 | Breast | Precancer | antigen processing and presentation of peptide antigen | 12/1080 | 62/18723 | 1.89e-04 | 3.04e-03 | 12 |
| GO:00198859 | Breast | Precancer | antigen processing and presentation of endogenous peptide antigen via MHC class I | 6/1080 | 17/18723 | 2.59e-04 | 3.83e-03 | 6 |
| GO:00024749 | Breast | Precancer | antigen processing and presentation of peptide antigen via MHC class I | 7/1080 | 28/18723 | 8.46e-04 | 9.82e-03 | 7 |
| GO:00027094 | Breast | Precancer | regulation of T cell mediated immunity | 13/1080 | 85/18723 | 1.12e-03 | 1.23e-02 | 13 |
| GO:00019146 | Breast | Precancer | regulation of T cell mediated cytotoxicity | 8/1080 | 39/18723 | 1.48e-03 | 1.53e-02 | 8 |
| GO:00019134 | Breast | Precancer | T cell mediated cytotoxicity | 9/1080 | 49/18723 | 1.74e-03 | 1.74e-02 | 9 |
| GO:00018956 | Breast | Precancer | retina homeostasis | 12/1080 | 79/18723 | 1.82e-03 | 1.79e-02 | 12 |
| GO:00718064 | Breast | Precancer | protein transmembrane transport | 10/1080 | 59/18723 | 1.86e-03 | 1.81e-02 | 10 |
| GO:00018948 | Breast | Precancer | tissue homeostasis | 27/1080 | 268/18723 | 3.49e-03 | 2.90e-02 | 27 |
| GO:00024563 | Breast | Precancer | T cell mediated immunity | 14/1080 | 109/18723 | 3.97e-03 | 3.15e-02 | 14 |
| GO:0002821 | Breast | Precancer | positive regulation of adaptive immune response | 14/1080 | 112/18723 | 5.08e-03 | 3.82e-02 | 14 |
| GO:004800213 | Breast | IDC | antigen processing and presentation of peptide antigen | 18/1434 | 62/18723 | 5.28e-07 | 2.59e-05 | 18 |
| GO:000248314 | Breast | IDC | antigen processing and presentation of endogenous peptide antigen | 9/1434 | 19/18723 | 4.03e-06 | 1.43e-04 | 9 |
| GO:001988313 | Breast | IDC | antigen processing and presentation of endogenous antigen | 10/1434 | 26/18723 | 1.14e-05 | 3.08e-04 | 10 |
| GO:00198829 | Breast | IDC | antigen processing and presentation | 20/1434 | 106/18723 | 1.41e-04 | 2.49e-03 | 20 |
| GO:001988513 | Breast | IDC | antigen processing and presentation of endogenous peptide antigen via MHC class I | 7/1434 | 17/18723 | 1.49e-04 | 2.61e-03 | 7 |
| Page: 1 2 3 4 5 6 7 8 9 |
| Pathway ID | Tissue | Disease Stage | Description | Gene Ratio | Bg Ratio | pvalue | p.adjust | qvalue | Count |
| Page: 1 |
Top |
Cell-cell communication analysis |
| Identification of potential cell-cell interactions between two cell types and their ligand-receptor pairs for different disease states |
| Ligand | Receptor | LRpair | Pathway | Tissue | Disease Stage |
| Page: 1 |
Top |
Single-cell gene regulatory network inference analysis |
| Find out the significant the regulons (TFs) and the target genes of each regulon across cell types for different disease states |
| TF | Cell Type | Tissue | Disease Stage | Target Gene | RSS | Regulon Activity |
| ∗The dot plots of a searched regulon are shown for all cell subpopulations in each disease state of each tissue based on the regulon specific score inferred using pySCENIC and by calculating the average expression. |
| Page: 1 |
Top |
Somatic mutation of malignant transformation related genes |
| Annotation of somatic variants for genes involved in malignant transformation |
| Hugo Symbol | Variant Class | Variant Classification | dbSNP RS | HGVSc | HGVSp | HGVSp Short | SWISSPROT | BIOTYPE | SIFT | PolyPhen | Tumor Sample Barcode | Tissue | Histology | Sex | Age | Stage | Therapy Types | Drugs | Outcome |
| AZGP1 | SNV | Missense_Mutation | c.533N>T | p.Ala178Val | p.A178V | P25311 | protein_coding | tolerated(0.1) | probably_damaging(0.968) | TCGA-E2-A14R-01 | Breast | breast invasive carcinoma | Female | <65 | I/II | Chemotherapy | doxorubicin | PD | |
| AZGP1 | SNV | Missense_Mutation | novel | c.548A>G | p.Glu183Gly | p.E183G | P25311 | protein_coding | deleterious(0) | probably_damaging(0.966) | TCGA-CA-6717-01 | Colorectum | colon adenocarcinoma | Male | <65 | I/II | Chemotherapy | oxaliplatin | CR |
| AZGP1 | SNV | Missense_Mutation | c.397G>C | p.Ala133Pro | p.A133P | P25311 | protein_coding | deleterious(0.01) | benign(0.391) | TCGA-AG-A002-01 | Colorectum | rectum adenocarcinoma | Male | <65 | I/II | Unknown | Unknown | SD | |
| AZGP1 | SNV | Missense_Mutation | c.164N>G | p.Asp55Gly | p.D55G | P25311 | protein_coding | tolerated(0.11) | benign(0.167) | TCGA-AG-A032-01 | Colorectum | rectum adenocarcinoma | Male | >=65 | III/IV | Targeted Molecular therapy | bevacizumab | PD | |
| AZGP1 | SNV | Missense_Mutation | c.386N>A | p.Arg129Lys | p.R129K | P25311 | protein_coding | tolerated(0.48) | benign(0.005) | TCGA-EI-6508-01 | Colorectum | rectum adenocarcinoma | Female | <65 | III/IV | Chemotherapy | oxaliplatin | SD | |
| AZGP1 | SNV | Missense_Mutation | c.779G>A | p.Gly260Asp | p.G260D | P25311 | protein_coding | deleterious(0.01) | probably_damaging(0.949) | TCGA-A5-A0G1-01 | Endometrium | uterine corpus endometrioid carcinoma | Female | >=65 | I/II | Unknown | Unknown | SD | |
| AZGP1 | SNV | Missense_Mutation | rs758931128 | c.730G>A | p.Glu244Lys | p.E244K | P25311 | protein_coding | tolerated(0.55) | benign(0) | TCGA-A5-A0G2-01 | Endometrium | uterine corpus endometrioid carcinoma | Female | <65 | III/IV | Unknown | Unknown | SD |
| AZGP1 | SNV | Missense_Mutation | novel | c.854G>T | p.Ser285Ile | p.S285I | P25311 | protein_coding | deleterious(0.01) | possibly_damaging(0.778) | TCGA-A5-A1OF-01 | Endometrium | uterine corpus endometrioid carcinoma | Female | <65 | I/II | Unknown | Unknown | SD |
| AZGP1 | SNV | Missense_Mutation | c.757G>T | p.Asp253Tyr | p.D253Y | P25311 | protein_coding | deleterious(0.02) | benign(0.397) | TCGA-A5-A2K5-01 | Endometrium | uterine corpus endometrioid carcinoma | Female | >=65 | I/II | Unknown | Unknown | SD | |
| AZGP1 | SNV | Missense_Mutation | rs377632165 | c.337N>A | p.Gly113Arg | p.G113R | P25311 | protein_coding | deleterious(0) | probably_damaging(0.99) | TCGA-AP-A0LT-01 | Endometrium | uterine corpus endometrioid carcinoma | Female | <65 | I/II | Unknown | Unknown | SD |
| Page: 1 2 3 4 |
Top |
Related drugs of malignant transformation related genes |
| Identification of chemicals and drugs interact with genes involved in malignant transfromation |
| (DGIdb 4.0) |
| Entrez ID | Symbol | Category | Interaction Types | Drug Claim Name | Drug Name | PMIDs |
| Page: 1 |

Copyright 2023-Present -The University of Texas Health Science Center at Houston |