
|
|||||
|
 | |
| |
| |
| |
| |
| |
|
Gene: AXIN1 |
Gene summary for AXIN1 |
| Gene information | Species | Human | Gene symbol | AXIN1 | Gene ID | 8312 |
| Gene name | axin 1 | |
| Gene Alias | AXIN | |
| Cytomap | 16p13.3 | |
| Gene Type | protein-coding | GO ID | GO:0000165 | UniProtAcc | A0A0S2Z4R0 |
Top |
Malignant transformation analysis |
| Identification of the aberrant gene expression in precancerous and cancerous lesions by comparing the gene expression of stem-like cells in diseased tissues with normal stem cells |
| Entrez ID | Symbol | Replicates | Species | Organ | Tissue | Adj P-value | Log2FC | Malignancy |
| 8312 | AXIN1 | HCC1_Meng | Human | Liver | HCC | 4.29e-15 | -1.19e-02 | 0.0246 |
| 8312 | AXIN1 | HCC2_Meng | Human | Liver | HCC | 7.43e-05 | 6.00e-02 | 0.0107 |
| 8312 | AXIN1 | S014 | Human | Liver | HCC | 3.21e-03 | 2.52e-01 | 0.2254 |
| 8312 | AXIN1 | S016 | Human | Liver | HCC | 8.06e-03 | 2.44e-01 | 0.2243 |
| 8312 | AXIN1 | S027 | Human | Liver | HCC | 2.05e-03 | 5.06e-01 | 0.2446 |
| 8312 | AXIN1 | S028 | Human | Liver | HCC | 6.82e-14 | 5.50e-01 | 0.2503 |
| 8312 | AXIN1 | S029 | Human | Liver | HCC | 3.68e-06 | 3.65e-01 | 0.2581 |
| 8312 | AXIN1 | C04 | Human | Oral cavity | OSCC | 5.58e-10 | 4.98e-01 | 0.2633 |
| 8312 | AXIN1 | C21 | Human | Oral cavity | OSCC | 3.32e-07 | 3.10e-01 | 0.2678 |
| 8312 | AXIN1 | C30 | Human | Oral cavity | OSCC | 3.47e-30 | 9.39e-01 | 0.3055 |
| 8312 | AXIN1 | C43 | Human | Oral cavity | OSCC | 2.90e-04 | 1.05e-01 | 0.1704 |
| 8312 | AXIN1 | C46 | Human | Oral cavity | OSCC | 4.89e-04 | 7.28e-02 | 0.1673 |
| 8312 | AXIN1 | C51 | Human | Oral cavity | OSCC | 2.70e-06 | 3.99e-01 | 0.2674 |
| 8312 | AXIN1 | C57 | Human | Oral cavity | OSCC | 2.86e-06 | 2.31e-01 | 0.1679 |
| 8312 | AXIN1 | C06 | Human | Oral cavity | OSCC | 1.87e-03 | 3.68e-01 | 0.2699 |
| 8312 | AXIN1 | C08 | Human | Oral cavity | OSCC | 1.94e-13 | 1.83e-01 | 0.1919 |
| 8312 | AXIN1 | LN46 | Human | Oral cavity | OSCC | 2.29e-04 | 1.90e-01 | 0.1666 |
| 8312 | AXIN1 | LP15 | Human | Oral cavity | LP | 3.42e-06 | 6.64e-01 | 0.2174 |
| 8312 | AXIN1 | SYSMH1 | Human | Oral cavity | OSCC | 3.18e-06 | 1.46e-01 | 0.1127 |
| 8312 | AXIN1 | SYSMH2 | Human | Oral cavity | OSCC | 6.43e-08 | 2.28e-01 | 0.2326 |
| Page: 1 2 |
| Tissue | Expression Dynamics | Abbreviation |
| Liver | 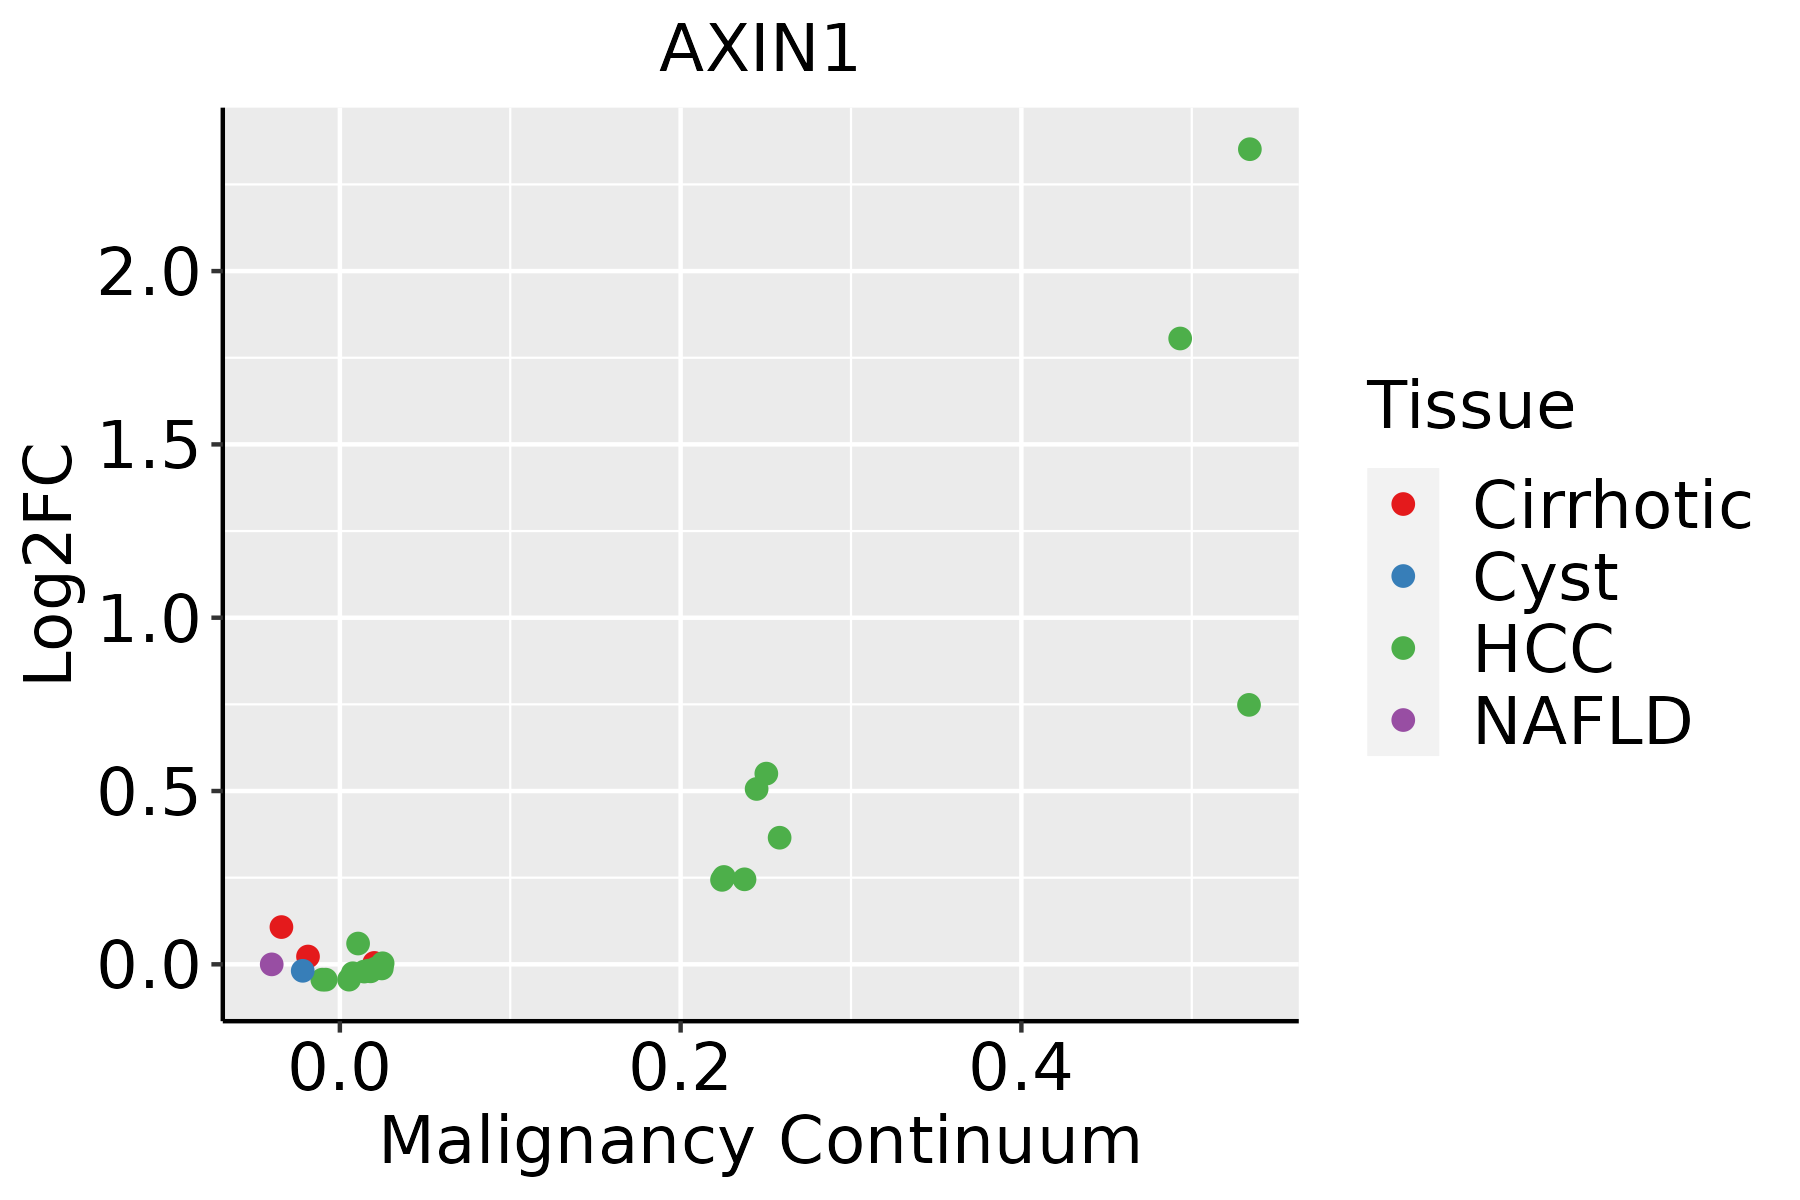 | HCC: Hepatocellular carcinoma |
| NAFLD: Non-alcoholic fatty liver disease | ||
| Oral Cavity |  | EOLP: Erosive Oral lichen planus |
| LP: leukoplakia | ||
| NEOLP: Non-erosive oral lichen planus | ||
| OSCC: Oral squamous cell carcinoma |
| ∗log2FC in expression of this searched gene in stem-like cells from each diseased tissue sample relative to stem-like cells in normal samples in each tissue plotted against the malignancy continuum. Samples are colored based on if they are from different disease stage. |
Top |
Malignant transformation related pathway analysis |
| Find out the enriched GO biological processes and KEGG pathways involved in transition from healthy to precancer to cancer |
| Tissue | Disease Stage | Enriched GO biological Processes |
| Colorectum | AD |  |
| Colorectum | SER |  |
| Colorectum | MSS |  |
| Colorectum | MSI-H |  |
| Colorectum | FAP |  |
| ∗Top 15 enriched GO BP terms are showed in the bar plot of each disease state in each tissue. Each row represents a significant GO biological process which is colored according to the -log10(p.adjust). |
| Page: 1 2 3 4 5 6 7 8 9 |
| GO ID | Tissue | Disease Stage | Description | Gene Ratio | Bg Ratio | pvalue | p.adjust | Count |
| GO:000989622 | Liver | HCC | positive regulation of catabolic process | 335/7958 | 492/18723 | 3.83e-31 | 1.87e-28 | 335 |
| GO:003133122 | Liver | HCC | positive regulation of cellular catabolic process | 295/7958 | 427/18723 | 3.20e-29 | 1.45e-26 | 295 |
| GO:004217622 | Liver | HCC | regulation of protein catabolic process | 267/7958 | 391/18723 | 2.45e-25 | 7.38e-23 | 267 |
| GO:190336222 | Liver | HCC | regulation of cellular protein catabolic process | 182/7958 | 255/18723 | 5.91e-21 | 8.52e-19 | 182 |
| GO:004573222 | Liver | HCC | positive regulation of protein catabolic process | 163/7958 | 231/18723 | 4.00e-18 | 4.69e-16 | 163 |
| GO:190305022 | Liver | HCC | regulation of proteolysis involved in cellular protein catabolic process | 157/7958 | 221/18723 | 5.93e-18 | 6.83e-16 | 157 |
| GO:190332022 | Liver | HCC | regulation of protein modification by small protein conjugation or removal | 167/7958 | 242/18723 | 4.99e-17 | 4.72e-15 | 167 |
| GO:190336422 | Liver | HCC | positive regulation of cellular protein catabolic process | 115/7958 | 155/18723 | 9.30e-16 | 7.19e-14 | 115 |
| GO:200005822 | Liver | HCC | regulation of ubiquitin-dependent protein catabolic process | 120/7958 | 164/18723 | 1.31e-15 | 9.74e-14 | 120 |
| GO:004586222 | Liver | HCC | positive regulation of proteolysis | 232/7958 | 372/18723 | 5.66e-15 | 3.98e-13 | 232 |
| GO:003139622 | Liver | HCC | regulation of protein ubiquitination | 142/7958 | 210/18723 | 1.39e-13 | 7.81e-12 | 142 |
| GO:190305221 | Liver | HCC | positive regulation of proteolysis involved in cellular protein catabolic process | 96/7958 | 133/18723 | 3.47e-12 | 1.57e-10 | 96 |
| GO:19033221 | Liver | HCC | positive regulation of protein modification by small protein conjugation or removal | 94/7958 | 138/18723 | 9.87e-10 | 3.01e-08 | 94 |
| GO:200006022 | Liver | HCC | positive regulation of ubiquitin-dependent protein catabolic process | 76/7958 | 107/18723 | 2.06e-09 | 5.79e-08 | 76 |
| GO:019873821 | Liver | HCC | cell-cell signaling by wnt | 247/7958 | 446/18723 | 2.11e-08 | 4.96e-07 | 247 |
| GO:001605521 | Liver | HCC | Wnt signaling pathway | 245/7958 | 444/18723 | 3.68e-08 | 8.09e-07 | 245 |
| GO:00313981 | Liver | HCC | positive regulation of protein ubiquitination | 79/7958 | 119/18723 | 1.18e-07 | 2.26e-06 | 79 |
| GO:003011121 | Liver | HCC | regulation of Wnt signaling pathway | 180/7958 | 328/18723 | 3.62e-06 | 4.72e-05 | 180 |
| GO:003109822 | Liver | HCC | stress-activated protein kinase signaling cascade | 138/7958 | 247/18723 | 1.43e-05 | 1.57e-04 | 138 |
| GO:005140322 | Liver | HCC | stress-activated MAPK cascade | 134/7958 | 239/18723 | 1.50e-05 | 1.64e-04 | 134 |
| Page: 1 2 3 4 5 |
| Pathway ID | Tissue | Disease Stage | Description | Gene Ratio | Bg Ratio | pvalue | p.adjust | qvalue | Count |
| hsa0501022 | Liver | HCC | Alzheimer disease | 254/4020 | 384/8465 | 3.75e-14 | 8.97e-13 | 4.99e-13 | 254 |
| hsa0502222 | Liver | HCC | Pathways of neurodegeneration - multiple diseases | 298/4020 | 476/8465 | 6.59e-12 | 1.30e-10 | 7.22e-11 | 298 |
| hsa0521022 | Liver | HCC | Colorectal cancer | 65/4020 | 86/8465 | 8.85e-08 | 1.23e-06 | 6.87e-07 | 65 |
| hsa0521321 | Liver | HCC | Endometrial cancer | 44/4020 | 58/8465 | 9.34e-06 | 7.11e-05 | 3.95e-05 | 44 |
| hsa052258 | Liver | HCC | Hepatocellular carcinoma | 106/4020 | 168/8465 | 2.87e-05 | 1.85e-04 | 1.03e-04 | 106 |
| hsa051652 | Liver | HCC | Human papillomavirus infection | 188/4020 | 331/8465 | 3.34e-04 | 1.49e-03 | 8.29e-04 | 188 |
| hsa0501032 | Liver | HCC | Alzheimer disease | 254/4020 | 384/8465 | 3.75e-14 | 8.97e-13 | 4.99e-13 | 254 |
| hsa0502232 | Liver | HCC | Pathways of neurodegeneration - multiple diseases | 298/4020 | 476/8465 | 6.59e-12 | 1.30e-10 | 7.22e-11 | 298 |
| hsa0521032 | Liver | HCC | Colorectal cancer | 65/4020 | 86/8465 | 8.85e-08 | 1.23e-06 | 6.87e-07 | 65 |
| hsa0521331 | Liver | HCC | Endometrial cancer | 44/4020 | 58/8465 | 9.34e-06 | 7.11e-05 | 3.95e-05 | 44 |
| hsa0522511 | Liver | HCC | Hepatocellular carcinoma | 106/4020 | 168/8465 | 2.87e-05 | 1.85e-04 | 1.03e-04 | 106 |
| hsa051653 | Liver | HCC | Human papillomavirus infection | 188/4020 | 331/8465 | 3.34e-04 | 1.49e-03 | 8.29e-04 | 188 |
| hsa0501028 | Oral cavity | OSCC | Alzheimer disease | 244/3704 | 384/8465 | 1.18e-15 | 3.60e-14 | 1.83e-14 | 244 |
| hsa0502228 | Oral cavity | OSCC | Pathways of neurodegeneration - multiple diseases | 292/3704 | 476/8465 | 1.60e-15 | 4.47e-14 | 2.28e-14 | 292 |
| hsa051659 | Oral cavity | OSCC | Human papillomavirus infection | 200/3704 | 331/8465 | 3.83e-10 | 4.93e-09 | 2.51e-09 | 200 |
| hsa0521018 | Oral cavity | OSCC | Colorectal cancer | 66/3704 | 86/8465 | 3.99e-10 | 4.95e-09 | 2.52e-09 | 66 |
| hsa0521318 | Oral cavity | OSCC | Endometrial cancer | 40/3704 | 58/8465 | 8.86e-05 | 3.19e-04 | 1.62e-04 | 40 |
| hsa0522516 | Oral cavity | OSCC | Hepatocellular carcinoma | 97/3704 | 168/8465 | 1.63e-04 | 5.52e-04 | 2.81e-04 | 97 |
| hsa0439016 | Oral cavity | OSCC | Hippo signaling pathway | 86/3704 | 157/8465 | 3.30e-03 | 8.24e-03 | 4.20e-03 | 86 |
| hsa05010112 | Oral cavity | OSCC | Alzheimer disease | 244/3704 | 384/8465 | 1.18e-15 | 3.60e-14 | 1.83e-14 | 244 |
| Page: 1 2 |
Top |
Cell-cell communication analysis |
| Identification of potential cell-cell interactions between two cell types and their ligand-receptor pairs for different disease states |
| Ligand | Receptor | LRpair | Pathway | Tissue | Disease Stage |
| Page: 1 |
Top |
Single-cell gene regulatory network inference analysis |
| Find out the significant the regulons (TFs) and the target genes of each regulon across cell types for different disease states |
| TF | Cell Type | Tissue | Disease Stage | Target Gene | RSS | Regulon Activity |
| ∗The dot plots of a searched regulon are shown for all cell subpopulations in each disease state of each tissue based on the regulon specific score inferred using pySCENIC and by calculating the average expression. |
| Page: 1 |
Top |
Somatic mutation of malignant transformation related genes |
| Annotation of somatic variants for genes involved in malignant transformation |
| Hugo Symbol | Variant Class | Variant Classification | dbSNP RS | HGVSc | HGVSp | HGVSp Short | SWISSPROT | BIOTYPE | SIFT | PolyPhen | Tumor Sample Barcode | Tissue | Histology | Sex | Age | Stage | Therapy Types | Drugs | Outcome |
| AXIN1 | SNV | Missense_Mutation | novel | c.2092C>A | p.His698Asn | p.H698N | O15169 | protein_coding | tolerated(0.69) | benign(0) | TCGA-A7-A0DB-01 | Breast | breast invasive carcinoma | Female | <65 | I/II | Hormone Therapy | arimidex | SD |
| AXIN1 | SNV | Missense_Mutation | c.856T>C | p.Tyr286His | p.Y286H | O15169 | protein_coding | tolerated(0.51) | possibly_damaging(0.547) | TCGA-A8-A079-01 | Breast | breast invasive carcinoma | Female | >=65 | III/IV | Chemotherapy | 5-fluorouracil | SD | |
| AXIN1 | SNV | Missense_Mutation | c.446N>C | p.Ile149Thr | p.I149T | O15169 | protein_coding | deleterious(0) | probably_damaging(0.998) | TCGA-BH-A0WA-01 | Breast | breast invasive carcinoma | Female | >=65 | I/II | Unknown | Unknown | SD | |
| AXIN1 | SNV | Missense_Mutation | c.217N>C | p.Glu73Gln | p.E73Q | O15169 | protein_coding | deleterious(0) | probably_damaging(0.998) | TCGA-BH-A5IZ-01 | Breast | breast invasive carcinoma | Female | <65 | I/II | Chemotherapy | adriamycin | CR | |
| AXIN1 | SNV | Missense_Mutation | c.2012A>G | p.Glu671Gly | p.E671G | O15169 | protein_coding | deleterious(0.04) | probably_damaging(0.998) | TCGA-E2-A2P5-01 | Breast | breast invasive carcinoma | Female | >=65 | III/IV | Hormone Therapy | arimidex | PD | |
| AXIN1 | SNV | Missense_Mutation | c.599N>G | p.Ser200Cys | p.S200C | O15169 | protein_coding | deleterious(0.01) | possibly_damaging(0.727) | TCGA-GM-A2D9-01 | Breast | breast invasive carcinoma | Female | >=65 | I/II | Hormone Therapy | arimidex | SD | |
| AXIN1 | SNV | Missense_Mutation | rs775362453 | c.672N>C | p.Gln224His | p.Q224H | O15169 | protein_coding | tolerated(0.09) | benign(0.015) | TCGA-OL-A5RW-01 | Breast | breast invasive carcinoma | Female | <65 | I/II | Chemotherapy | adriamycin | CR |
| AXIN1 | SNV | Missense_Mutation | novel | c.1369G>C | p.Ala457Pro | p.A457P | O15169 | protein_coding | tolerated(0.14) | benign(0.001) | TCGA-A6-2678-01 | Colorectum | colon adenocarcinoma | Female | <65 | III/IV | Chemotherapy | 5-fluorouracil | SD |
| AXIN1 | SNV | Missense_Mutation | rs150504240 | c.2131N>T | p.Arg711Cys | p.R711C | O15169 | protein_coding | tolerated(0.23) | benign(0.051) | TCGA-A6-2686-01 | Colorectum | colon adenocarcinoma | Female | >=65 | I/II | Unknown | Unknown | SD |
| AXIN1 | SNV | Missense_Mutation | rs377025983 | c.1961N>T | p.Ser654Leu | p.S654L | O15169 | protein_coding | tolerated(0.07) | possibly_damaging(0.52) | TCGA-A6-5661-01 | Colorectum | colon adenocarcinoma | Female | >=65 | I/II | Unknown | Unknown | SD |
| Page: 1 2 3 4 5 6 7 8 9 10 11 |
Top |
Related drugs of malignant transformation related genes |
| Identification of chemicals and drugs interact with genes involved in malignant transfromation |
| (DGIdb 4.0) |
| Entrez ID | Symbol | Category | Interaction Types | Drug Claim Name | Drug Name | PMIDs |
| 8312 | AXIN1 | CLINICALLY ACTIONABLE, KINASE | (+/-)-HYDNOCARPIN | CHEMBL91638 | 24018191 |
| Page: 1 |

Copyright 2023-Present -The University of Texas Health Science Center at Houston |