
|
|||||
|
 | |
| |
| |
| |
| |
| |
|
Gene: AVPI1 |
Gene summary for AVPI1 |
| Gene information | Species | Human | Gene symbol | AVPI1 | Gene ID | 60370 |
| Gene name | arginine vasopressin induced 1 | |
| Gene Alias | PP5395 | |
| Cytomap | 10q24.2 | |
| Gene Type | protein-coding | GO ID | GO:0000165 | UniProtAcc | Q5T686 |
Top |
Malignant transformation analysis |
| Identification of the aberrant gene expression in precancerous and cancerous lesions by comparing the gene expression of stem-like cells in diseased tissues with normal stem cells |
| Entrez ID | Symbol | Replicates | Species | Organ | Tissue | Adj P-value | Log2FC | Malignancy |
| 60370 | AVPI1 | sample1 | Human | Cervix | CC | 5.04e-09 | 5.85e-01 | 0.0959 |
| 60370 | AVPI1 | T1 | Human | Cervix | CC | 3.95e-13 | 5.01e-01 | 0.0918 |
| 60370 | AVPI1 | T2 | Human | Cervix | CC | 9.16e-03 | 3.78e-01 | 0.0709 |
| 60370 | AVPI1 | LZE4T | Human | Esophagus | ESCC | 1.75e-02 | 2.41e-01 | 0.0811 |
| 60370 | AVPI1 | LZE8T | Human | Esophagus | ESCC | 3.16e-07 | 2.59e-01 | 0.067 |
| 60370 | AVPI1 | LZE24T | Human | Esophagus | ESCC | 1.23e-05 | 5.98e-01 | 0.0596 |
| 60370 | AVPI1 | LZE6T | Human | Esophagus | ESCC | 2.30e-07 | 2.76e-01 | 0.0845 |
| 60370 | AVPI1 | P1T-E | Human | Esophagus | ESCC | 6.31e-04 | 3.34e-01 | 0.0875 |
| 60370 | AVPI1 | P2T-E | Human | Esophagus | ESCC | 5.04e-21 | 2.17e-01 | 0.1177 |
| 60370 | AVPI1 | P4T-E | Human | Esophagus | ESCC | 7.21e-20 | 8.39e-01 | 0.1323 |
| 60370 | AVPI1 | P5T-E | Human | Esophagus | ESCC | 1.14e-22 | 8.72e-01 | 0.1327 |
| 60370 | AVPI1 | P8T-E | Human | Esophagus | ESCC | 3.45e-06 | 2.20e-01 | 0.0889 |
| 60370 | AVPI1 | P9T-E | Human | Esophagus | ESCC | 3.08e-09 | 4.27e-02 | 0.1131 |
| 60370 | AVPI1 | P10T-E | Human | Esophagus | ESCC | 2.85e-08 | -1.65e-01 | 0.116 |
| 60370 | AVPI1 | P11T-E | Human | Esophagus | ESCC | 8.85e-08 | 9.27e-01 | 0.1426 |
| 60370 | AVPI1 | P12T-E | Human | Esophagus | ESCC | 1.64e-26 | 9.76e-01 | 0.1122 |
| 60370 | AVPI1 | P15T-E | Human | Esophagus | ESCC | 3.99e-14 | 5.57e-01 | 0.1149 |
| 60370 | AVPI1 | P16T-E | Human | Esophagus | ESCC | 3.37e-10 | 1.37e-01 | 0.1153 |
| 60370 | AVPI1 | P17T-E | Human | Esophagus | ESCC | 1.18e-05 | 3.07e-01 | 0.1278 |
| 60370 | AVPI1 | P20T-E | Human | Esophagus | ESCC | 1.79e-13 | 5.24e-01 | 0.1124 |
| Page: 1 2 3 4 5 |
| Tissue | Expression Dynamics | Abbreviation |
| Cervix | 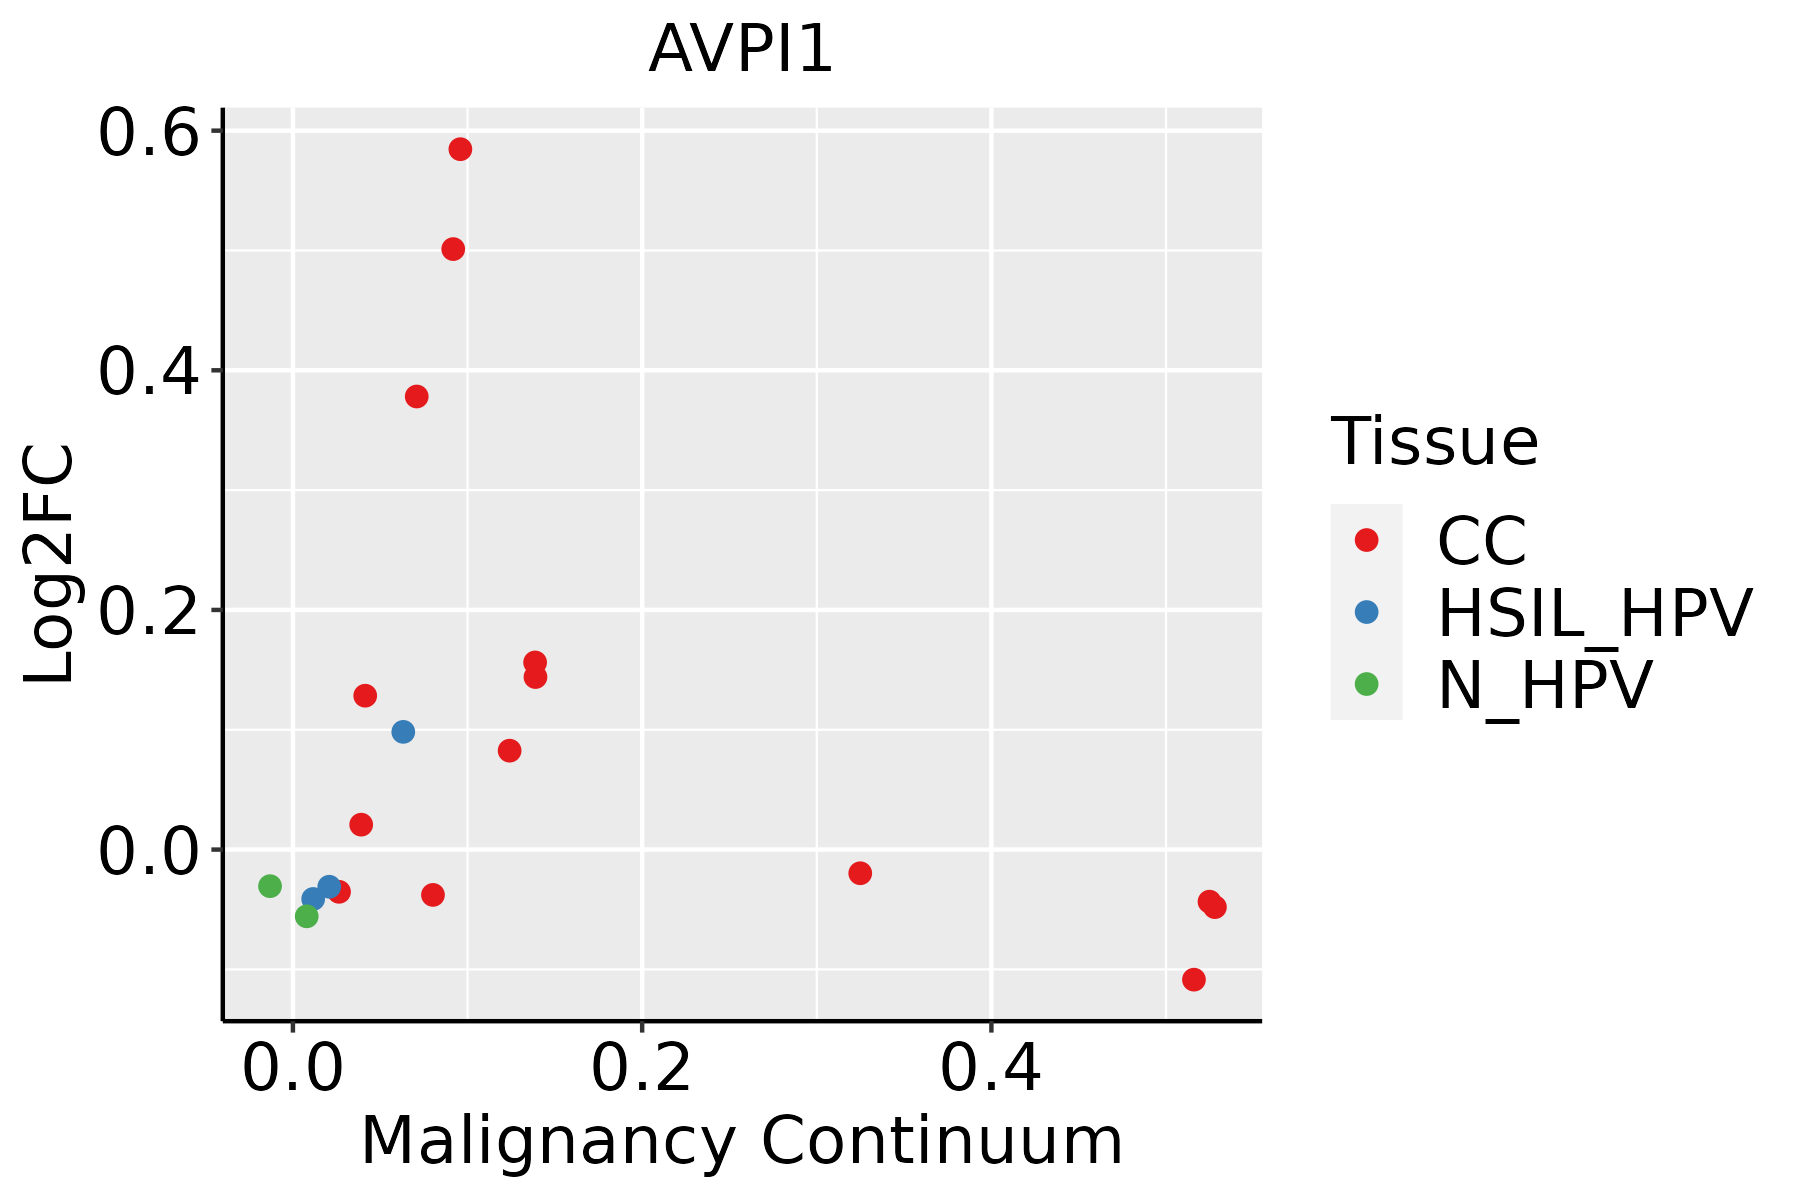 | CC: Cervix cancer |
| HSIL_HPV: HPV-infected high-grade squamous intraepithelial lesions | ||
| N_HPV: HPV-infected normal cervix | ||
| Esophagus |  | ESCC: Esophageal squamous cell carcinoma |
| HGIN: High-grade intraepithelial neoplasias | ||
| LGIN: Low-grade intraepithelial neoplasias | ||
| Oral Cavity |  | EOLP: Erosive Oral lichen planus |
| LP: leukoplakia | ||
| NEOLP: Non-erosive oral lichen planus | ||
| OSCC: Oral squamous cell carcinoma | ||
| Skin | 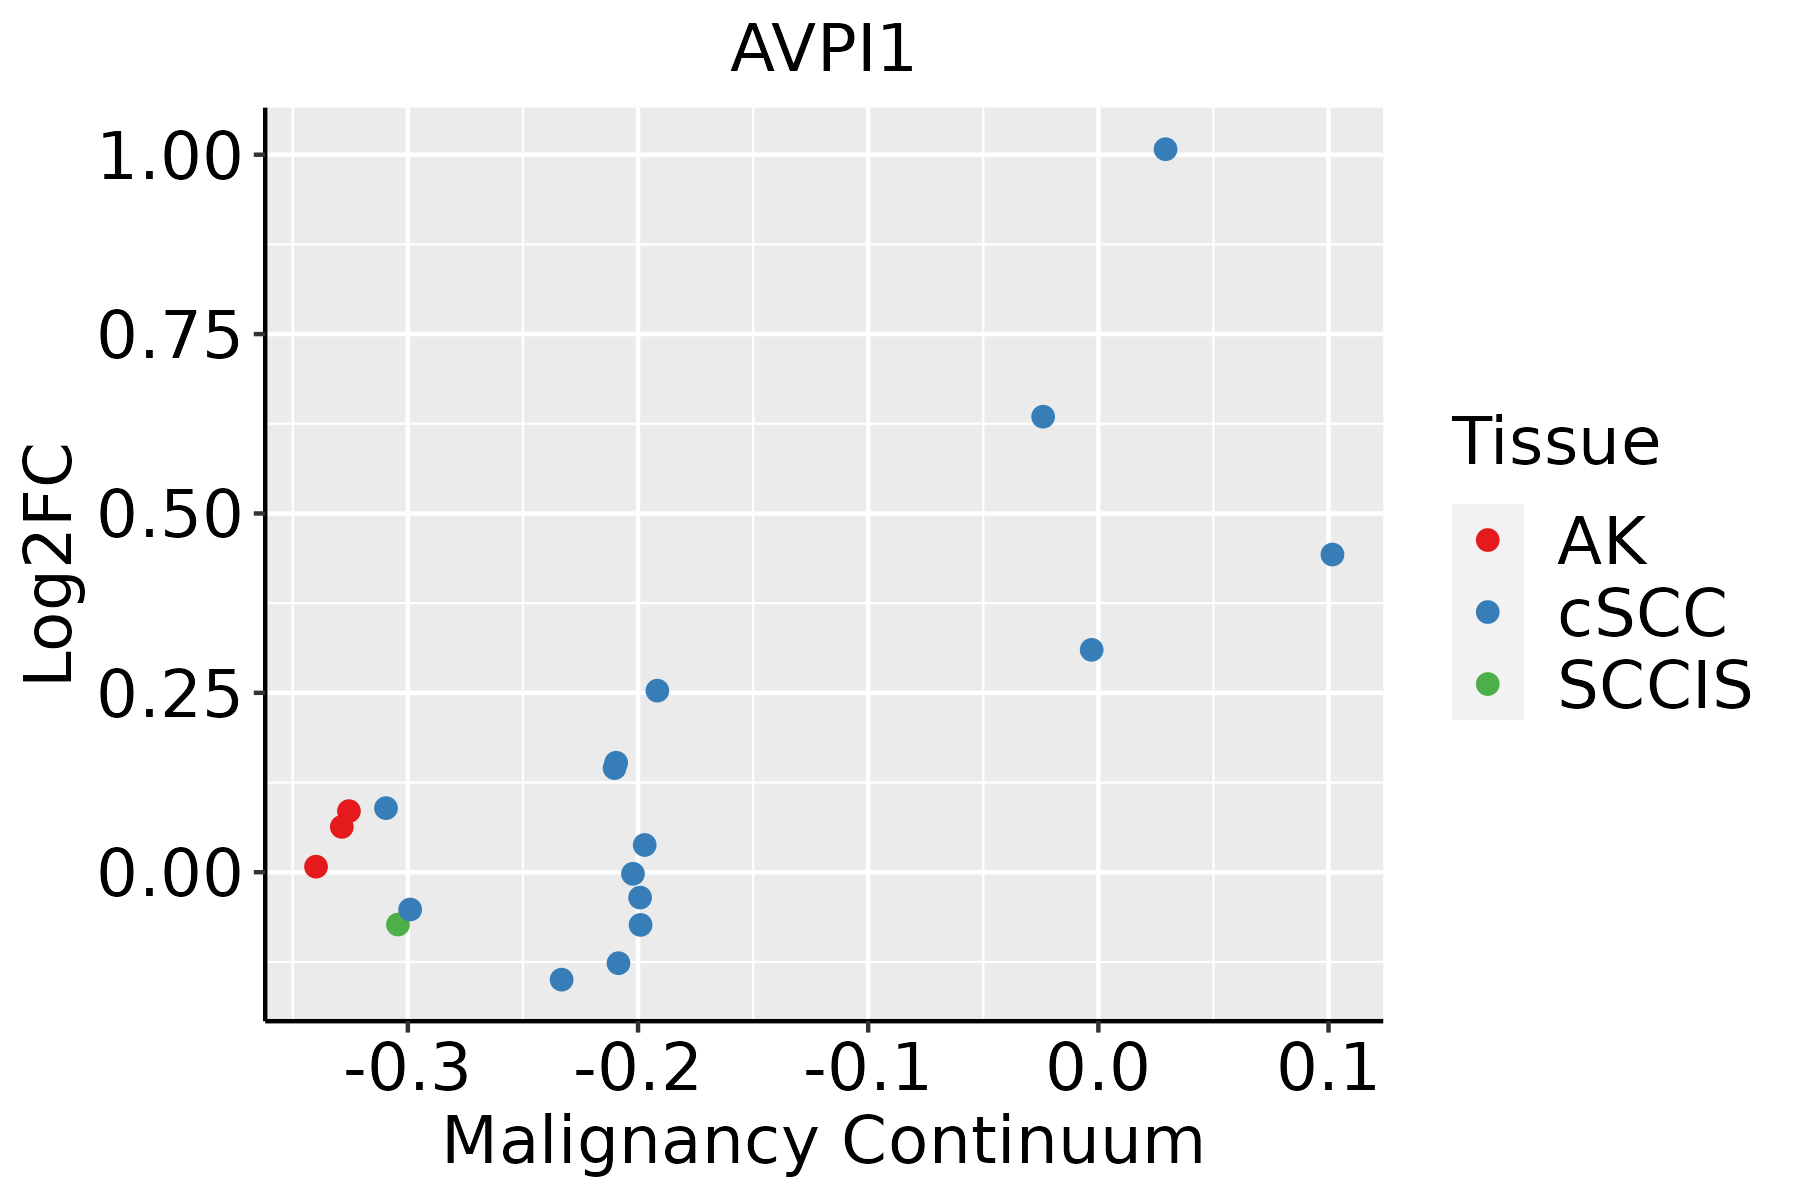 | AK: Actinic keratosis |
| cSCC: Cutaneous squamous cell carcinoma | ||
| SCCIS:squamous cell carcinoma in situ |
| ∗log2FC in expression of this searched gene in stem-like cells from each diseased tissue sample relative to stem-like cells in normal samples in each tissue plotted against the malignancy continuum. Samples are colored based on if they are from different disease stage. |
Top |
Malignant transformation related pathway analysis |
| Find out the enriched GO biological processes and KEGG pathways involved in transition from healthy to precancer to cancer |
| Tissue | Disease Stage | Enriched GO biological Processes |
| Colorectum | AD |  |
| Colorectum | SER |  |
| Colorectum | MSS |  |
| Colorectum | MSI-H |  |
| Colorectum | FAP |  |
| ∗Top 15 enriched GO BP terms are showed in the bar plot of each disease state in each tissue. Each row represents a significant GO biological process which is colored according to the -log10(p.adjust). |
| Page: 1 2 3 4 5 6 7 8 9 |
| GO ID | Tissue | Disease Stage | Description | Gene Ratio | Bg Ratio | pvalue | p.adjust | Count |
| GO:00434104 | Cervix | CC | positive regulation of MAPK cascade | 90/2311 | 480/18723 | 2.92e-05 | 4.83e-04 | 90 |
| GO:00434107 | Oral cavity | OSCC | positive regulation of MAPK cascade | 213/7305 | 480/18723 | 8.71e-03 | 3.16e-02 | 213 |
| Page: 1 |
| Pathway ID | Tissue | Disease Stage | Description | Gene Ratio | Bg Ratio | pvalue | p.adjust | qvalue | Count |
| Page: 1 |
Top |
Cell-cell communication analysis |
| Identification of potential cell-cell interactions between two cell types and their ligand-receptor pairs for different disease states |
| Ligand | Receptor | LRpair | Pathway | Tissue | Disease Stage |
| Page: 1 |
Top |
Single-cell gene regulatory network inference analysis |
| Find out the significant the regulons (TFs) and the target genes of each regulon across cell types for different disease states |
| TF | Cell Type | Tissue | Disease Stage | Target Gene | RSS | Regulon Activity |
| ∗The dot plots of a searched regulon are shown for all cell subpopulations in each disease state of each tissue based on the regulon specific score inferred using pySCENIC and by calculating the average expression. |
| Page: 1 |
Top |
Somatic mutation of malignant transformation related genes |
| Annotation of somatic variants for genes involved in malignant transformation |
| Hugo Symbol | Variant Class | Variant Classification | dbSNP RS | HGVSc | HGVSp | HGVSp Short | SWISSPROT | BIOTYPE | SIFT | PolyPhen | Tumor Sample Barcode | Tissue | Histology | Sex | Age | Stage | Therapy Types | Drugs | Outcome |
| AVPI1 | SNV | Missense_Mutation | rs150249445 | c.103G>A | p.Glu35Lys | p.E35K | Q5T686 | protein_coding | tolerated(0.2) | benign(0.242) | TCGA-5L-AAT1-01 | Breast | breast invasive carcinoma | Female | <65 | III/IV | Hormone Therapy | letrozol | SD |
| AVPI1 | SNV | Missense_Mutation | c.437N>C | p.Arg146Thr | p.R146T | Q5T686 | protein_coding | deleterious(0.02) | probably_damaging(0.994) | TCGA-E2-A1LH-01 | Breast | breast invasive carcinoma | Female | <65 | I/II | Chemotherapy | adriamycin | SD | |
| AVPI1 | SNV | Missense_Mutation | novel | c.328G>A | p.Ala110Thr | p.A110T | Q5T686 | protein_coding | tolerated(0.35) | benign(0.006) | TCGA-2W-A8YY-01 | Cervix | cervical & endocervical cancer | Female | <65 | I/II | Chemotherapy | cisplatin | CR |
| AVPI1 | SNV | Missense_Mutation | c.38N>T | p.Pro13Leu | p.P13L | Q5T686 | protein_coding | tolerated(0.27) | benign(0.003) | TCGA-Q1-A73Q-01 | Cervix | cervical & endocervical cancer | Female | <65 | I/II | Chemotherapy | cisplatin | SD | |
| AVPI1 | SNV | Missense_Mutation | rs770933514 | c.133N>T | p.Arg45Cys | p.R45C | Q5T686 | protein_coding | deleterious(0.04) | probably_damaging(0.966) | TCGA-AA-3811-01 | Colorectum | colon adenocarcinoma | Female | >=65 | III/IV | Unknown | Unknown | PD |
| AVPI1 | SNV | Missense_Mutation | rs554930916 | c.161N>A | p.Arg54Gln | p.R54Q | Q5T686 | protein_coding | deleterious(0.02) | possibly_damaging(0.889) | TCGA-AA-A01R-01 | Colorectum | colon adenocarcinoma | Male | <65 | III/IV | Chemotherapy | 5-fluorouracil | PD |
| AVPI1 | SNV | Missense_Mutation | rs544820695 | c.100N>A | p.Ala34Thr | p.A34T | Q5T686 | protein_coding | tolerated(0.12) | benign(0.011) | TCGA-AZ-6601-01 | Colorectum | colon adenocarcinoma | Male | >=65 | I/II | Unknown | Unknown | PD |
| AVPI1 | SNV | Missense_Mutation | c.329N>T | p.Ala110Val | p.A110V | Q5T686 | protein_coding | tolerated(0.1) | benign(0.109) | TCGA-CK-4951-01 | Colorectum | colon adenocarcinoma | Female | >=65 | I/II | Unknown | Unknown | PD | |
| AVPI1 | insertion | Frame_Shift_Ins | novel | c.38_39insC | p.Trp14LeufsTer6 | p.W14Lfs*6 | Q5T686 | protein_coding | TCGA-G4-6586-01 | Colorectum | colon adenocarcinoma | Female | >=65 | I/II | Unknown | Unknown | SD | ||
| AVPI1 | SNV | Missense_Mutation | novel | c.184G>A | p.Ala62Thr | p.A62T | Q5T686 | protein_coding | deleterious(0.01) | probably_damaging(0.971) | TCGA-DF-A2KU-01 | Endometrium | uterine corpus endometrioid carcinoma | Female | Unknown | I/II | Unknown | Unknown | SD |
| Page: 1 2 |
Top |
Related drugs of malignant transformation related genes |
| Identification of chemicals and drugs interact with genes involved in malignant transfromation |
| (DGIdb 4.0) |
| Entrez ID | Symbol | Category | Interaction Types | Drug Claim Name | Drug Name | PMIDs |
| Page: 1 |

Copyright 2023-Present -The University of Texas Health Science Center at Houston |