
|
|||||
|
 | |
| |
| |
| |
| |
| |
|
Gene: AVEN |
Gene summary for AVEN |
| Gene information | Species | Human | Gene symbol | AVEN | Gene ID | 57099 |
| Gene name | apoptosis and caspase activation inhibitor | |
| Gene Alias | PDCD12 | |
| Cytomap | 15q14 | |
| Gene Type | protein-coding | GO ID | GO:0000086 | UniProtAcc | Q9NQS1 |
Top |
Malignant transformation analysis |
| Identification of the aberrant gene expression in precancerous and cancerous lesions by comparing the gene expression of stem-like cells in diseased tissues with normal stem cells |
| Entrez ID | Symbol | Replicates | Species | Organ | Tissue | Adj P-value | Log2FC | Malignancy |
| 57099 | AVEN | NAFLD1 | Human | Liver | NAFLD | 1.20e-06 | 5.79e-01 | -0.04 |
| 57099 | AVEN | HCC1_Meng | Human | Liver | HCC | 3.46e-51 | 2.44e-02 | 0.0246 |
| 57099 | AVEN | HCC2_Meng | Human | Liver | HCC | 1.61e-07 | 4.69e-03 | 0.0107 |
| 57099 | AVEN | cirrhotic1 | Human | Liver | Cirrhotic | 4.33e-03 | -8.63e-02 | 0.0202 |
| 57099 | AVEN | S016 | Human | Liver | HCC | 2.77e-02 | 2.26e-01 | 0.2243 |
| 57099 | AVEN | S028 | Human | Liver | HCC | 4.09e-15 | 6.26e-01 | 0.2503 |
| 57099 | AVEN | S029 | Human | Liver | HCC | 7.88e-11 | 5.91e-01 | 0.2581 |
| 57099 | AVEN | C04 | Human | Oral cavity | OSCC | 1.18e-03 | 3.94e-01 | 0.2633 |
| 57099 | AVEN | C21 | Human | Oral cavity | OSCC | 6.86e-11 | 3.88e-01 | 0.2678 |
| 57099 | AVEN | C30 | Human | Oral cavity | OSCC | 2.51e-20 | 7.71e-01 | 0.3055 |
| 57099 | AVEN | C38 | Human | Oral cavity | OSCC | 2.04e-02 | 4.64e-01 | 0.172 |
| 57099 | AVEN | C46 | Human | Oral cavity | OSCC | 1.44e-03 | 1.71e-01 | 0.1673 |
| 57099 | AVEN | C51 | Human | Oral cavity | OSCC | 4.34e-07 | 4.88e-01 | 0.2674 |
| 57099 | AVEN | C08 | Human | Oral cavity | OSCC | 4.89e-10 | 3.93e-01 | 0.1919 |
| 57099 | AVEN | LN22 | Human | Oral cavity | OSCC | 2.43e-04 | 6.30e-01 | 0.1733 |
| 57099 | AVEN | SYSMH2 | Human | Oral cavity | OSCC | 5.56e-16 | 6.12e-01 | 0.2326 |
| 57099 | AVEN | SYSMH3 | Human | Oral cavity | OSCC | 1.56e-22 | 8.22e-01 | 0.2442 |
| 57099 | AVEN | SYSMH4 | Human | Oral cavity | OSCC | 8.44e-03 | 9.90e-02 | 0.1226 |
| 57099 | AVEN | SYSMH5 | Human | Oral cavity | OSCC | 1.81e-02 | 1.69e-01 | 0.0647 |
| 57099 | AVEN | PTC04 | Human | Thyroid | PTC | 1.25e-05 | 1.06e-01 | 0.1927 |
| Page: 1 2 |
| Tissue | Expression Dynamics | Abbreviation |
| Liver | 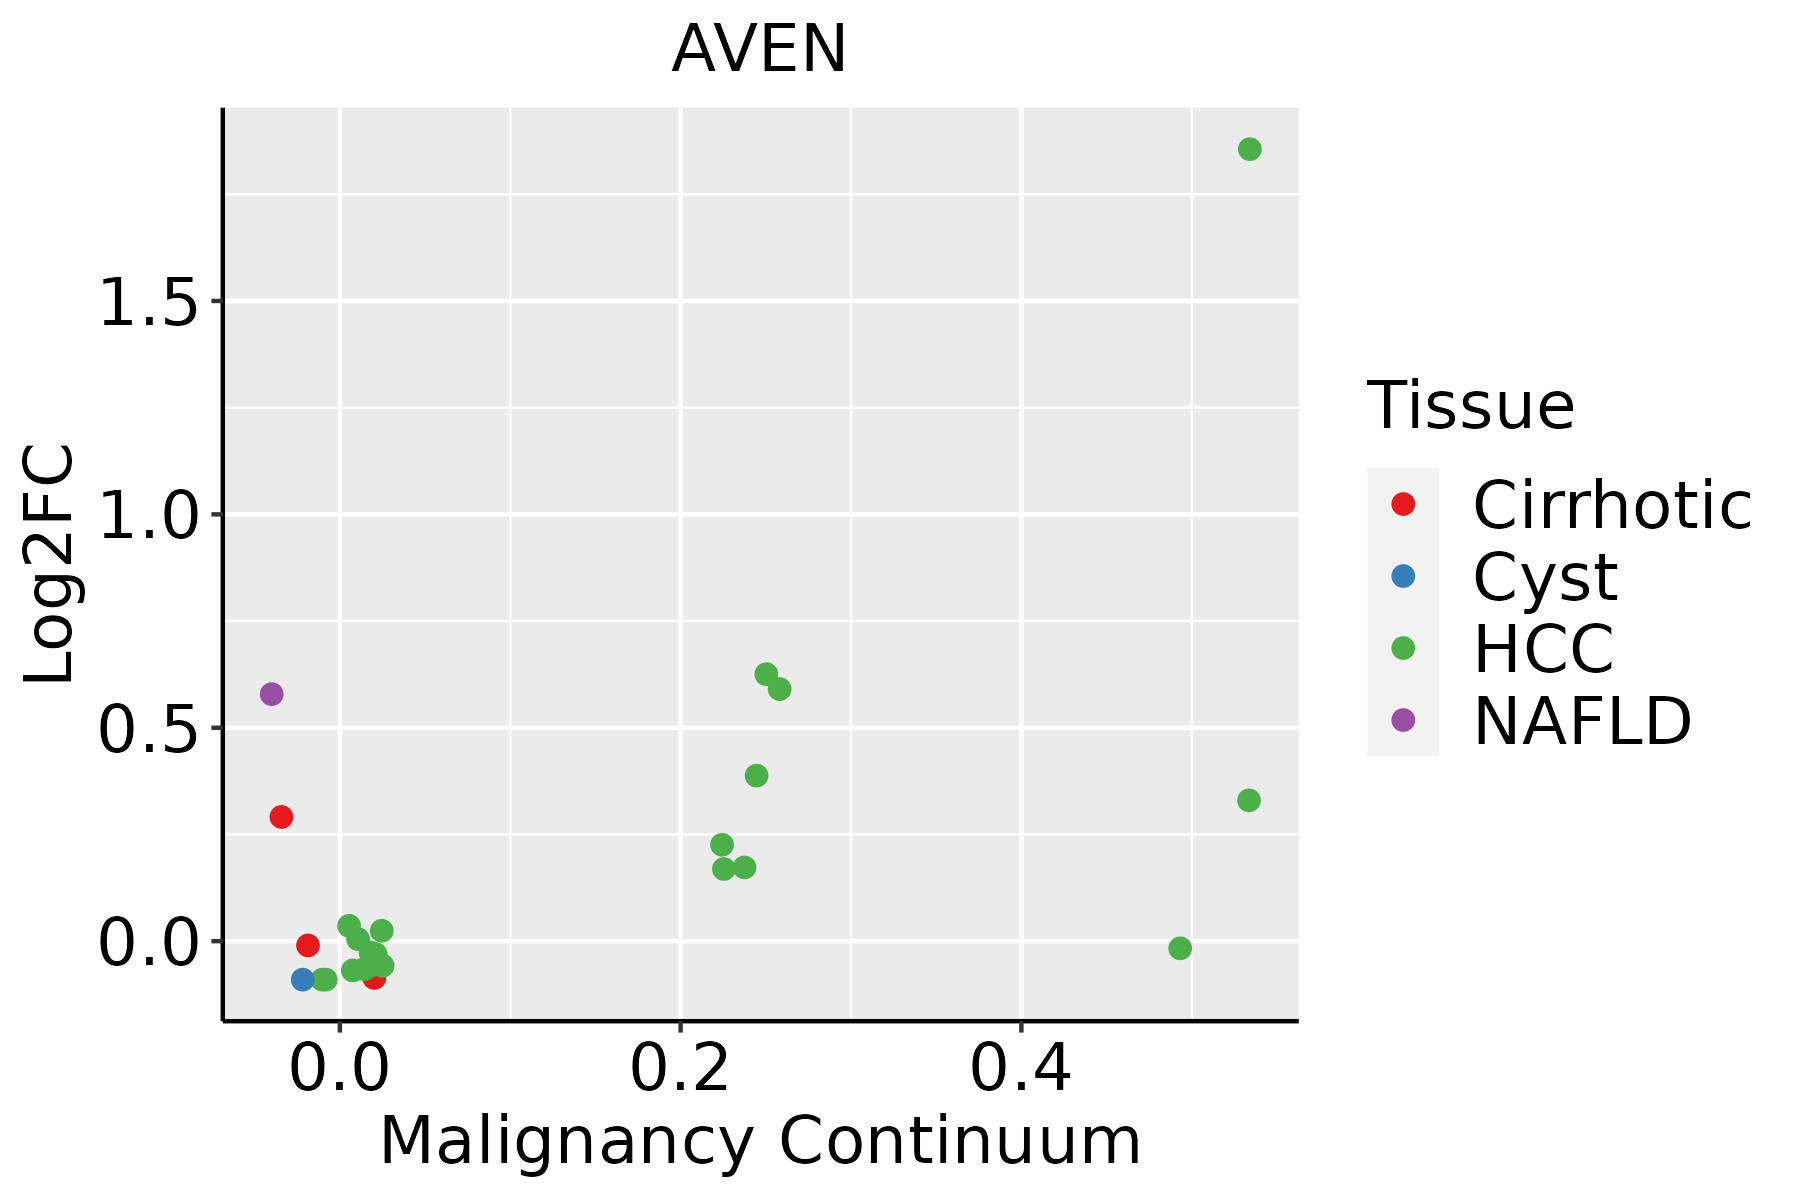 | HCC: Hepatocellular carcinoma |
| NAFLD: Non-alcoholic fatty liver disease | ||
| Oral Cavity | 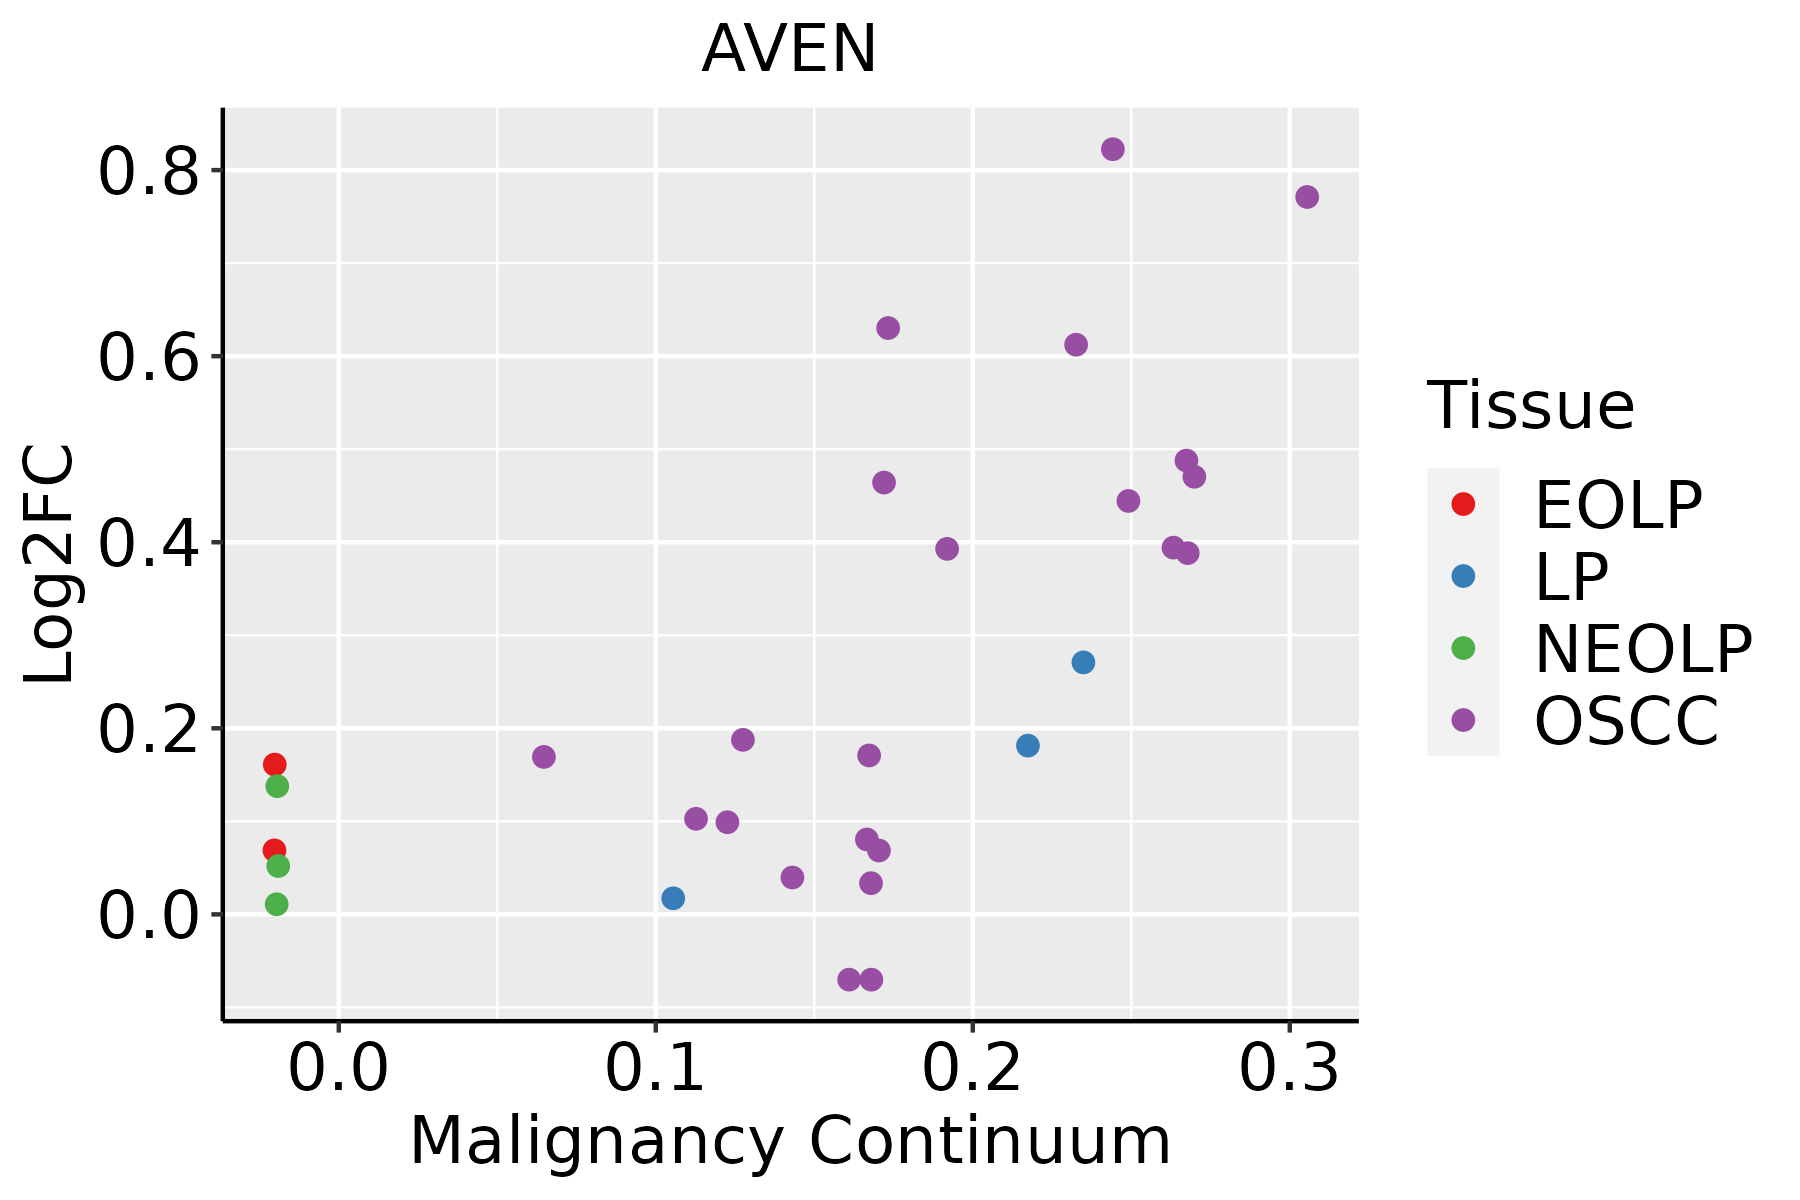 | EOLP: Erosive Oral lichen planus |
| LP: leukoplakia | ||
| NEOLP: Non-erosive oral lichen planus | ||
| OSCC: Oral squamous cell carcinoma | ||
| Thyroid |  | ATC: Anaplastic thyroid cancer |
| HT: Hashimoto's thyroiditis | ||
| PTC: Papillary thyroid cancer |
| ∗log2FC in expression of this searched gene in stem-like cells from each diseased tissue sample relative to stem-like cells in normal samples in each tissue plotted against the malignancy continuum. Samples are colored based on if they are from different disease stage. |
Top |
Malignant transformation related pathway analysis |
| Find out the enriched GO biological processes and KEGG pathways involved in transition from healthy to precancer to cancer |
| Tissue | Disease Stage | Enriched GO biological Processes |
| Colorectum | AD |  |
| Colorectum | SER |  |
| Colorectum | MSS |  |
| Colorectum | MSI-H |  |
| Colorectum | FAP |  |
| ∗Top 15 enriched GO BP terms are showed in the bar plot of each disease state in each tissue. Each row represents a significant GO biological process which is colored according to the -log10(p.adjust). |
| Page: 1 2 3 4 5 6 7 8 9 |
| GO ID | Tissue | Disease Stage | Description | Gene Ratio | Bg Ratio | pvalue | p.adjust | Count |
| GO:0044772 | Liver | NAFLD | mitotic cell cycle phase transition | 67/1882 | 424/18723 | 1.25e-04 | 2.39e-03 | 67 |
| GO:1901987 | Liver | NAFLD | regulation of cell cycle phase transition | 56/1882 | 390/18723 | 4.01e-03 | 3.36e-02 | 56 |
| GO:00073463 | Liver | Cirrhotic | regulation of mitotic cell cycle | 154/4634 | 457/18723 | 8.73e-06 | 1.29e-04 | 154 |
| GO:00447721 | Liver | Cirrhotic | mitotic cell cycle phase transition | 139/4634 | 424/18723 | 1.02e-04 | 1.06e-03 | 139 |
| GO:1901990 | Liver | Cirrhotic | regulation of mitotic cell cycle phase transition | 100/4634 | 299/18723 | 4.13e-04 | 3.41e-03 | 100 |
| GO:00447722 | Liver | HCC | mitotic cell cycle phase transition | 240/7958 | 424/18723 | 2.47e-09 | 6.84e-08 | 240 |
| GO:000734611 | Liver | HCC | regulation of mitotic cell cycle | 255/7958 | 457/18723 | 4.96e-09 | 1.30e-07 | 255 |
| GO:19019901 | Liver | HCC | regulation of mitotic cell cycle phase transition | 167/7958 | 299/18723 | 1.96e-06 | 2.71e-05 | 167 |
| GO:19019871 | Liver | HCC | regulation of cell cycle phase transition | 211/7958 | 390/18723 | 2.11e-06 | 2.89e-05 | 211 |
| GO:0045786 | Liver | HCC | negative regulation of cell cycle | 204/7958 | 385/18723 | 1.84e-05 | 1.99e-04 | 204 |
| GO:0045930 | Liver | HCC | negative regulation of mitotic cell cycle | 130/7958 | 235/18723 | 4.69e-05 | 4.50e-04 | 130 |
| GO:1901988 | Liver | HCC | negative regulation of cell cycle phase transition | 132/7958 | 249/18723 | 4.97e-04 | 3.25e-03 | 132 |
| GO:0010948 | Liver | HCC | negative regulation of cell cycle process | 152/7958 | 294/18723 | 8.50e-04 | 5.08e-03 | 152 |
| GO:1901991 | Liver | HCC | negative regulation of mitotic cell cycle phase transition | 97/7958 | 179/18723 | 1.03e-03 | 5.91e-03 | 97 |
| GO:0000086 | Liver | HCC | G2/M transition of mitotic cell cycle | 75/7958 | 137/18723 | 2.52e-03 | 1.22e-02 | 75 |
| GO:0044839 | Liver | HCC | cell cycle G2/M phase transition | 79/7958 | 148/18723 | 4.82e-03 | 2.03e-02 | 79 |
| GO:00447728 | Oral cavity | OSCC | mitotic cell cycle phase transition | 255/7305 | 424/18723 | 5.29e-19 | 6.98e-17 | 255 |
| GO:00073469 | Oral cavity | OSCC | regulation of mitotic cell cycle | 266/7305 | 457/18723 | 3.87e-17 | 3.41e-15 | 266 |
| GO:19019905 | Oral cavity | OSCC | regulation of mitotic cell cycle phase transition | 173/7305 | 299/18723 | 2.49e-11 | 8.35e-10 | 173 |
| GO:19019875 | Oral cavity | OSCC | regulation of cell cycle phase transition | 209/7305 | 390/18723 | 2.79e-09 | 6.42e-08 | 209 |
| Page: 1 2 3 4 |
| Pathway ID | Tissue | Disease Stage | Description | Gene Ratio | Bg Ratio | pvalue | p.adjust | qvalue | Count |
| Page: 1 |
Top |
Cell-cell communication analysis |
| Identification of potential cell-cell interactions between two cell types and their ligand-receptor pairs for different disease states |
| Ligand | Receptor | LRpair | Pathway | Tissue | Disease Stage |
| Page: 1 |
Top |
Single-cell gene regulatory network inference analysis |
| Find out the significant the regulons (TFs) and the target genes of each regulon across cell types for different disease states |
| TF | Cell Type | Tissue | Disease Stage | Target Gene | RSS | Regulon Activity |
| ∗The dot plots of a searched regulon are shown for all cell subpopulations in each disease state of each tissue based on the regulon specific score inferred using pySCENIC and by calculating the average expression. |
| Page: 1 |
Top |
Somatic mutation of malignant transformation related genes |
| Annotation of somatic variants for genes involved in malignant transformation |
| Hugo Symbol | Variant Class | Variant Classification | dbSNP RS | HGVSc | HGVSp | HGVSp Short | SWISSPROT | BIOTYPE | SIFT | PolyPhen | Tumor Sample Barcode | Tissue | Histology | Sex | Age | Stage | Therapy Types | Drugs | Outcome |
| AVEN | SNV | Missense_Mutation | c.313N>A | p.Glu105Lys | p.E105K | Q9NQS1 | protein_coding | deleterious(0.01) | benign(0.442) | TCGA-D8-A1JA-01 | Breast | breast invasive carcinoma | Female | <65 | III/IV | Chemotherapy | adriamycin | PD | |
| AVEN | deletion | Frame_Shift_Del | novel | c.1040delN | p.Asn347MetfsTer14 | p.N347Mfs*14 | Q9NQS1 | protein_coding | TCGA-D8-A27V-01 | Breast | breast invasive carcinoma | Female | <65 | I/II | Hormone Therapy | tamoxiphen | SD | ||
| AVEN | SNV | Missense_Mutation | rs377689938 | c.335N>T | p.Arg112Ile | p.R112I | Q9NQS1 | protein_coding | deleterious(0) | probably_damaging(0.98) | TCGA-2W-A8YY-01 | Cervix | cervical & endocervical cancer | Female | <65 | I/II | Chemotherapy | cisplatin | CR |
| AVEN | SNV | Missense_Mutation | c.310G>T | p.Asp104Tyr | p.D104Y | Q9NQS1 | protein_coding | deleterious(0.01) | benign(0.012) | TCGA-AA-3510-01 | Colorectum | colon adenocarcinoma | Male | >=65 | I/II | Unknown | Unknown | SD | |
| AVEN | SNV | Missense_Mutation | novel | c.359N>A | p.Arg120Gln | p.R120Q | Q9NQS1 | protein_coding | deleterious(0) | probably_damaging(0.996) | TCGA-AG-A002-01 | Colorectum | rectum adenocarcinoma | Male | <65 | I/II | Unknown | Unknown | SD |
| AVEN | SNV | Missense_Mutation | c.418N>T | p.Asp140Tyr | p.D140Y | Q9NQS1 | protein_coding | deleterious(0) | probably_damaging(0.999) | TCGA-AP-A056-01 | Endometrium | uterine corpus endometrioid carcinoma | Female | <65 | I/II | Unknown | Unknown | SD | |
| AVEN | SNV | Missense_Mutation | novel | c.644N>G | p.Lys215Arg | p.K215R | Q9NQS1 | protein_coding | tolerated(0.07) | probably_damaging(0.997) | TCGA-AP-A1DK-01 | Endometrium | uterine corpus endometrioid carcinoma | Female | <65 | I/II | Unknown | Unknown | SD |
| AVEN | SNV | Missense_Mutation | c.339N>T | p.Lys113Asn | p.K113N | Q9NQS1 | protein_coding | deleterious(0) | probably_damaging(0.998) | TCGA-B5-A0JY-01 | Endometrium | uterine corpus endometrioid carcinoma | Female | <65 | III/IV | Chemotherapy | doxorubicin | SD | |
| AVEN | SNV | Missense_Mutation | c.962A>G | p.Gln321Arg | p.Q321R | Q9NQS1 | protein_coding | tolerated(0.53) | benign(0.018) | TCGA-B5-A11J-01 | Endometrium | uterine corpus endometrioid carcinoma | Female | <65 | I/II | Unknown | Unknown | SD | |
| AVEN | SNV | Missense_Mutation | c.306N>T | p.Glu102Asp | p.E102D | Q9NQS1 | protein_coding | tolerated(0.22) | probably_damaging(0.946) | TCGA-B5-A11N-01 | Endometrium | uterine corpus endometrioid carcinoma | Female | >=65 | I/II | Unknown | Unknown | SD |
| Page: 1 2 3 4 |
Top |
Related drugs of malignant transformation related genes |
| Identification of chemicals and drugs interact with genes involved in malignant transfromation |
| (DGIdb 4.0) |
| Entrez ID | Symbol | Category | Interaction Types | Drug Claim Name | Drug Name | PMIDs |
| Page: 1 |

Copyright 2023-Present -The University of Texas Health Science Center at Houston |