Schematic overview of the cellular and molecular mechanisms involved in the cancer progression, including the proposed cellular and molecular mechanisms in cancer cells trajectory. AT1: alveolar type 1 cells; AT2: alveolar type 2 cells; AAH: atypical adenomatous hyperplasia; AIS: adenocarcinoma in situ; MIA: minimally invasive adenocarcinoma; IA: invasive adenocarcinoma; EMT: epithelial-mesenchymal transition

Home

Download

Statistics

Help

Contact

Center for Computational Systems Medicine
leaf

Gene summary

leaf

Malignant transformation analysis

leaf

Malignant transformation related pathway analysis

leaf

Cell-cell communication analysis

leaf

Single-cell gene regulatory network inference analysis

leaf

Somatic mutation of malignant transformation related genes

leaf

Related drugs of malignant transformation related genes

Gene: AUTS2

Gene summary for AUTS2

check button Gene summary.

Gene informationSpeciesHuman
Gene symbol

AUTS2

Gene ID

26053

Gene nameactivator of transcription and developmental regulator AUTS2
Gene AliasFBRSL2
Cytomap7q11.22
Gene Typeprotein-coding
GO ID

GO:0000902

UniProtAcc

Q8WXX7


Top

Malignant transformation analysis

check button Identification of the aberrant gene expression in precancerous and cancerous lesions by comparing the gene expression of stem-like cells in diseased tissues with normal stem cells
check button Malignant transformation involving gene list.
Entrez IDSymbolReplicatesSpeciesOrganTissueAdj P-valueLog2FCMalignancy
26053AUTS2CA_HPV_3HumanCervixCC2.42e-036.60e-020.0414
26053AUTS2CCI_2HumanCervixCC2.38e-058.16e-010.5249
26053AUTS2CCI_3HumanCervixCC4.81e-271.44e+000.516
26053AUTS2T1HumanCervixCC7.26e-063.69e-010.0918
26053AUTS2HTA11_1938_2000001011HumanColorectumAD1.36e-065.31e-01-0.0811
26053AUTS2HTA11_78_2000001011HumanColorectumAD2.18e-035.24e-01-0.1088
26053AUTS2HTA11_347_2000001011HumanColorectumAD8.59e-156.74e-01-0.1954
26053AUTS2HTA11_6818_2000001011HumanColorectumAD2.59e-057.23e-010.0112
26053AUTS2HTA11_6818_2000001021HumanColorectumAD7.40e-086.89e-010.0588
26053AUTS2HTA11_99999974143_84620HumanColorectumMSS9.45e-16-5.47e-010.3005
26053AUTS2A015-C-203HumanColorectumFAP4.60e-23-1.87e-01-0.1294
26053AUTS2A015-C-204HumanColorectumFAP1.14e-02-2.15e-01-0.0228
26053AUTS2A002-C-201HumanColorectumFAP1.88e-08-2.72e-010.0324
26053AUTS2A002-C-203HumanColorectumFAP1.63e-032.75e-010.2786
26053AUTS2A001-C-119HumanColorectumFAP2.97e-03-3.70e-01-0.1557
26053AUTS2A001-C-108HumanColorectumFAP1.15e-12-5.55e-02-0.0272
26053AUTS2A002-C-205HumanColorectumFAP1.54e-15-1.55e-01-0.1236
26053AUTS2A015-C-006HumanColorectumFAP8.08e-10-3.04e-01-0.0994
26053AUTS2A015-C-106HumanColorectumFAP2.66e-087.31e-03-0.0511
26053AUTS2A002-C-114HumanColorectumFAP2.23e-15-4.69e-01-0.1561
Page: 1 2 3 4 5 6 7 8 9 10 

check button Transcriptomic changes along malignancy continuum.
TissueExpression DynamicsAbbreviation
CervixThe image shows the transcriptomic changes along malignancy continuum.log2FC in expression of this searched gene in stem-like cells from each diseased tissue sample relative to stem-like cells in normal samples in each tissue plotted against the malignancy continuum. Samples are colored based on if they are from different disease stage.CC: Cervix cancer
HSIL_HPV: HPV-infected high-grade squamous intraepithelial lesions
N_HPV: HPV-infected normal cervix
Colorectum (GSE201348)The image shows the transcriptomic changes along malignancy continuum.log2FC in expression of this searched gene in stem-like cells from each diseased tissue sample relative to stem-like cells in normal samples in each tissue plotted against the malignancy continuum. Samples are colored based on if they are from different disease stage.FAP: Familial adenomatous polyposis
CRC: Colorectal cancer
Colorectum (HTA11)The image shows the transcriptomic changes along malignancy continuum.log2FC in expression of this searched gene in stem-like cells from each diseased tissue sample relative to stem-like cells in normal samples in each tissue plotted against the malignancy continuum. Samples are colored based on if they are from different disease stage.AD: Adenomas
SER: Sessile serrated lesions
MSI-H: Microsatellite-high colorectal cancer
MSS: Microsatellite stable colorectal cancer
EndometriumThe image shows the transcriptomic changes along malignancy continuum.log2FC in expression of this searched gene in stem-like cells from each diseased tissue sample relative to stem-like cells in normal samples in each tissue plotted against the malignancy continuum. Samples are colored based on if they are from different disease stage.AEH: Atypical endometrial hyperplasia
EEC: Endometrioid Cancer
EsophagusThe image shows the transcriptomic changes along malignancy continuum.log2FC in expression of this searched gene in stem-like cells from each diseased tissue sample relative to stem-like cells in normal samples in each tissue plotted against the malignancy continuum. Samples are colored based on if they are from different disease stage.
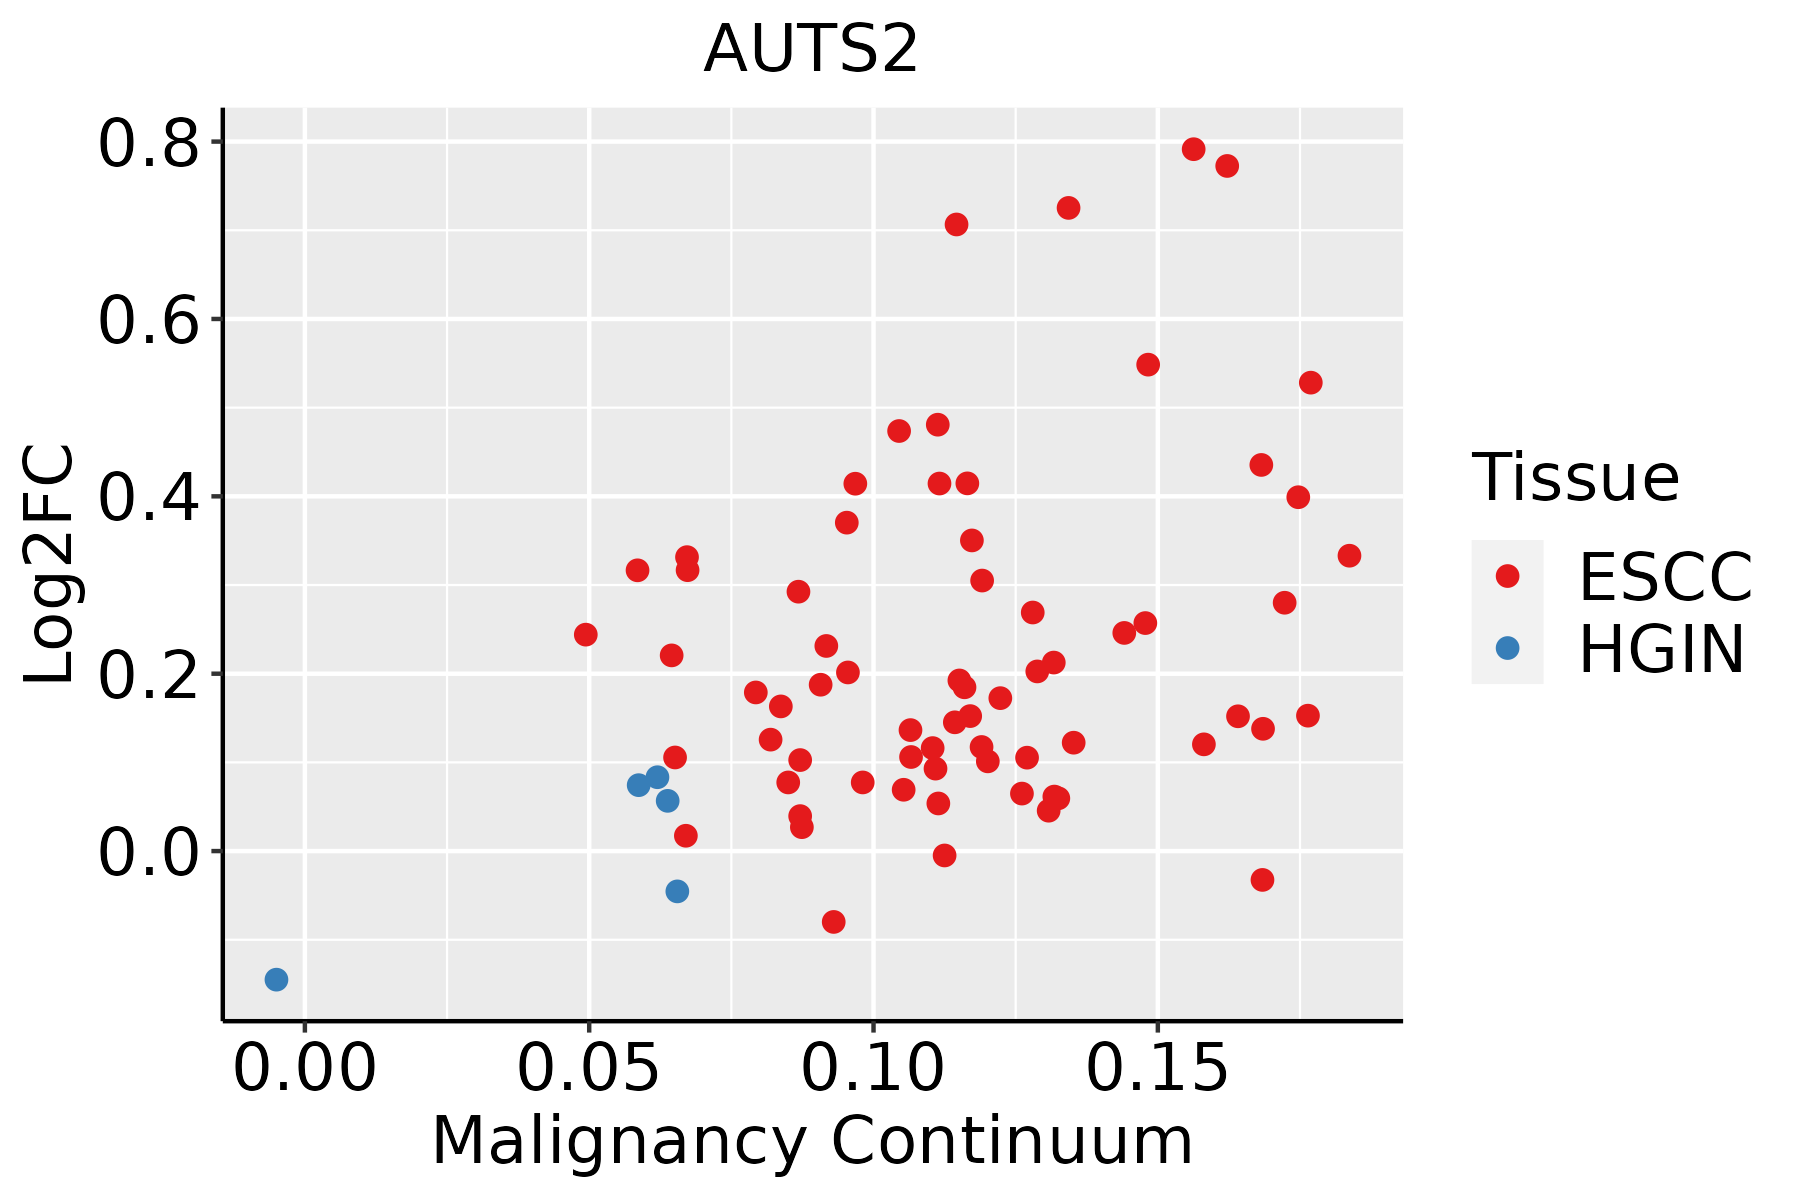
ESCC: Esophageal squamous cell carcinoma
HGIN: High-grade intraepithelial neoplasias
LGIN: Low-grade intraepithelial neoplasias
LiverThe image shows the transcriptomic changes along malignancy continuum.log2FC in expression of this searched gene in stem-like cells from each diseased tissue sample relative to stem-like cells in normal samples in each tissue plotted against the malignancy continuum. Samples are colored based on if they are from different disease stage.HCC: Hepatocellular carcinoma
NAFLD: Non-alcoholic fatty liver disease
LungThe image shows the transcriptomic changes along malignancy continuum.log2FC in expression of this searched gene in stem-like cells from each diseased tissue sample relative to stem-like cells in normal samples in each tissue plotted against the malignancy continuum. Samples are colored based on if they are from different disease stage.
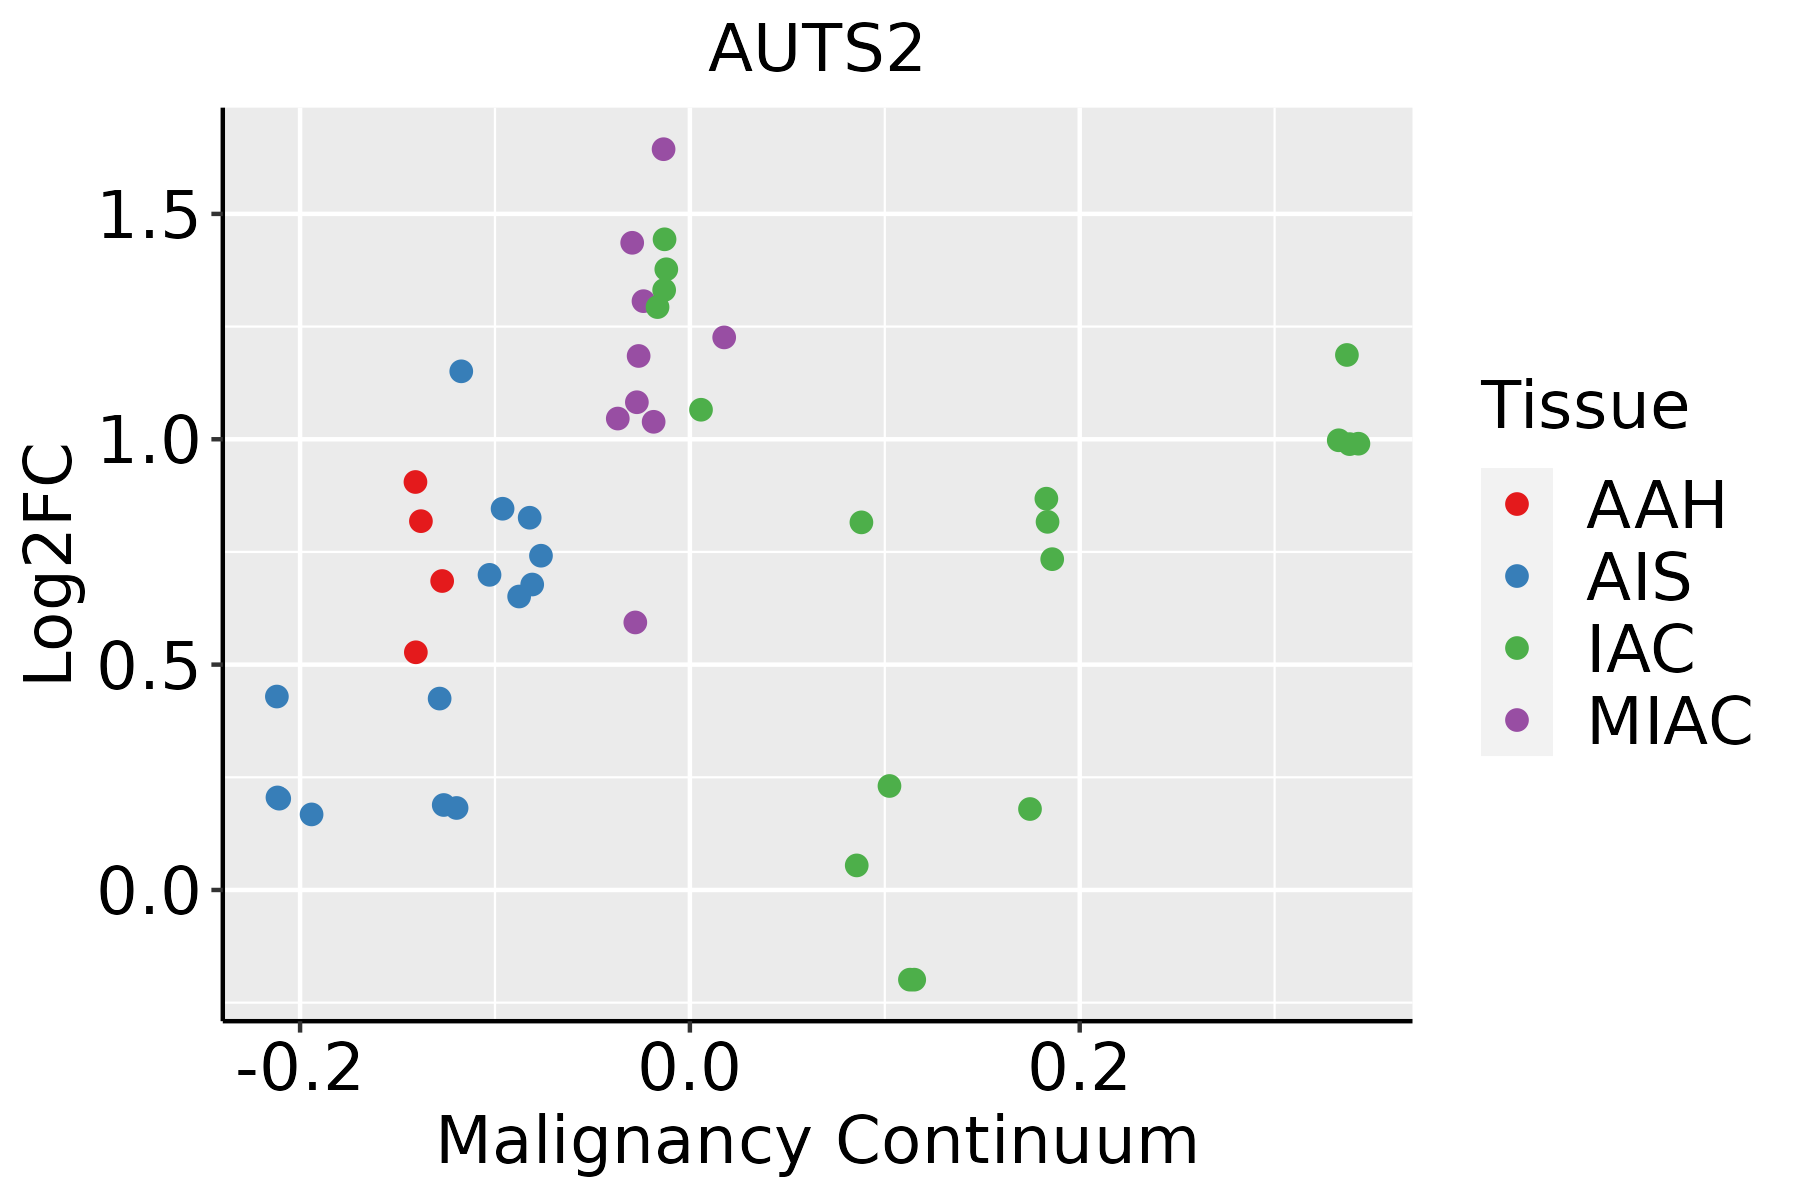
AAH: Atypical adenomatous hyperplasia
AIS: Adenocarcinoma in situ
IAC: Invasive lung adenocarcinoma
MIA: Minimally invasive adenocarcinoma
Oral CavityThe image shows the transcriptomic changes along malignancy continuum.log2FC in expression of this searched gene in stem-like cells from each diseased tissue sample relative to stem-like cells in normal samples in each tissue plotted against the malignancy continuum. Samples are colored based on if they are from different disease stage.EOLP: Erosive Oral lichen planus
LP: leukoplakia
NEOLP: Non-erosive oral lichen planus
OSCC: Oral squamous cell carcinoma
ProstateThe image shows the transcriptomic changes along malignancy continuum.log2FC in expression of this searched gene in stem-like cells from each diseased tissue sample relative to stem-like cells in normal samples in each tissue plotted against the malignancy continuum. Samples are colored based on if they are from different disease stage.
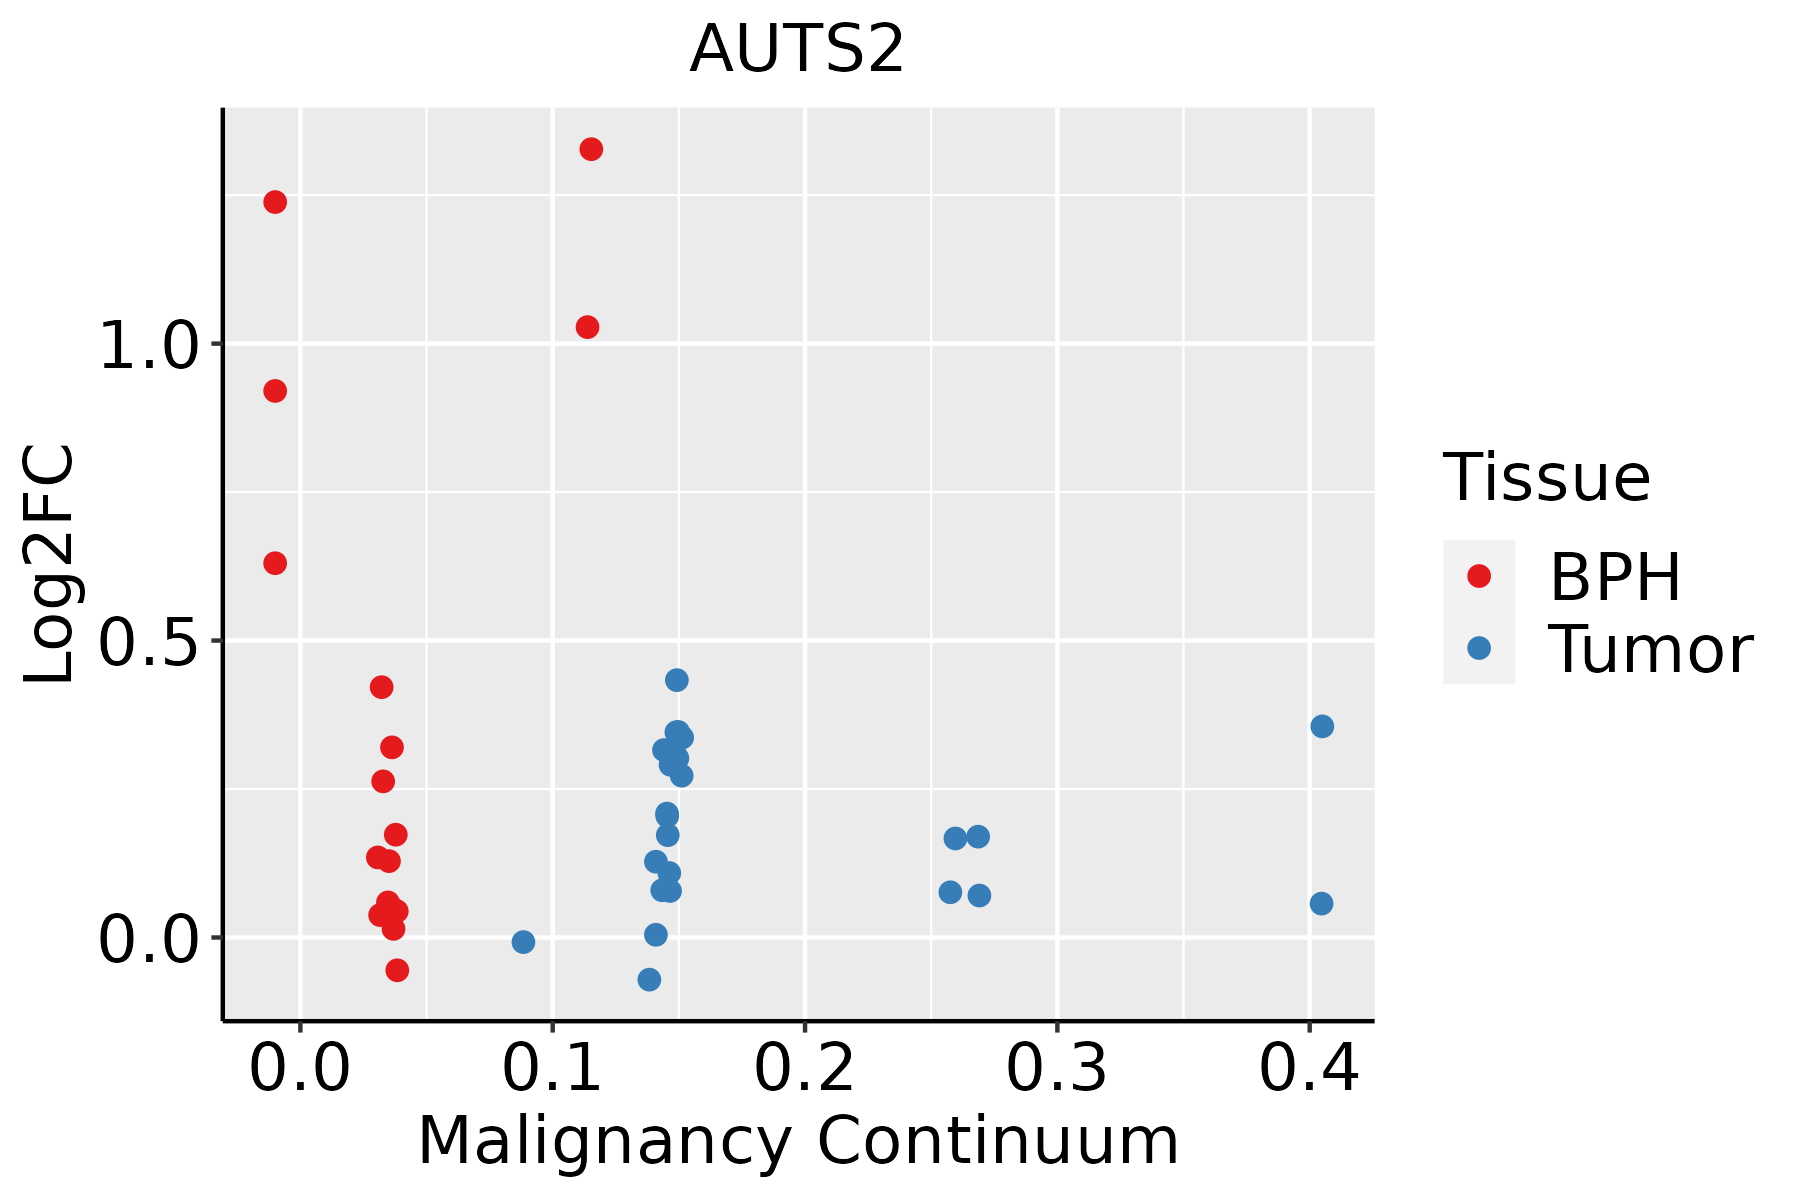
BPH: Benign Prostatic Hyperplasia
SkinThe image shows the transcriptomic changes along malignancy continuum.log2FC in expression of this searched gene in stem-like cells from each diseased tissue sample relative to stem-like cells in normal samples in each tissue plotted against the malignancy continuum. Samples are colored based on if they are from different disease stage.
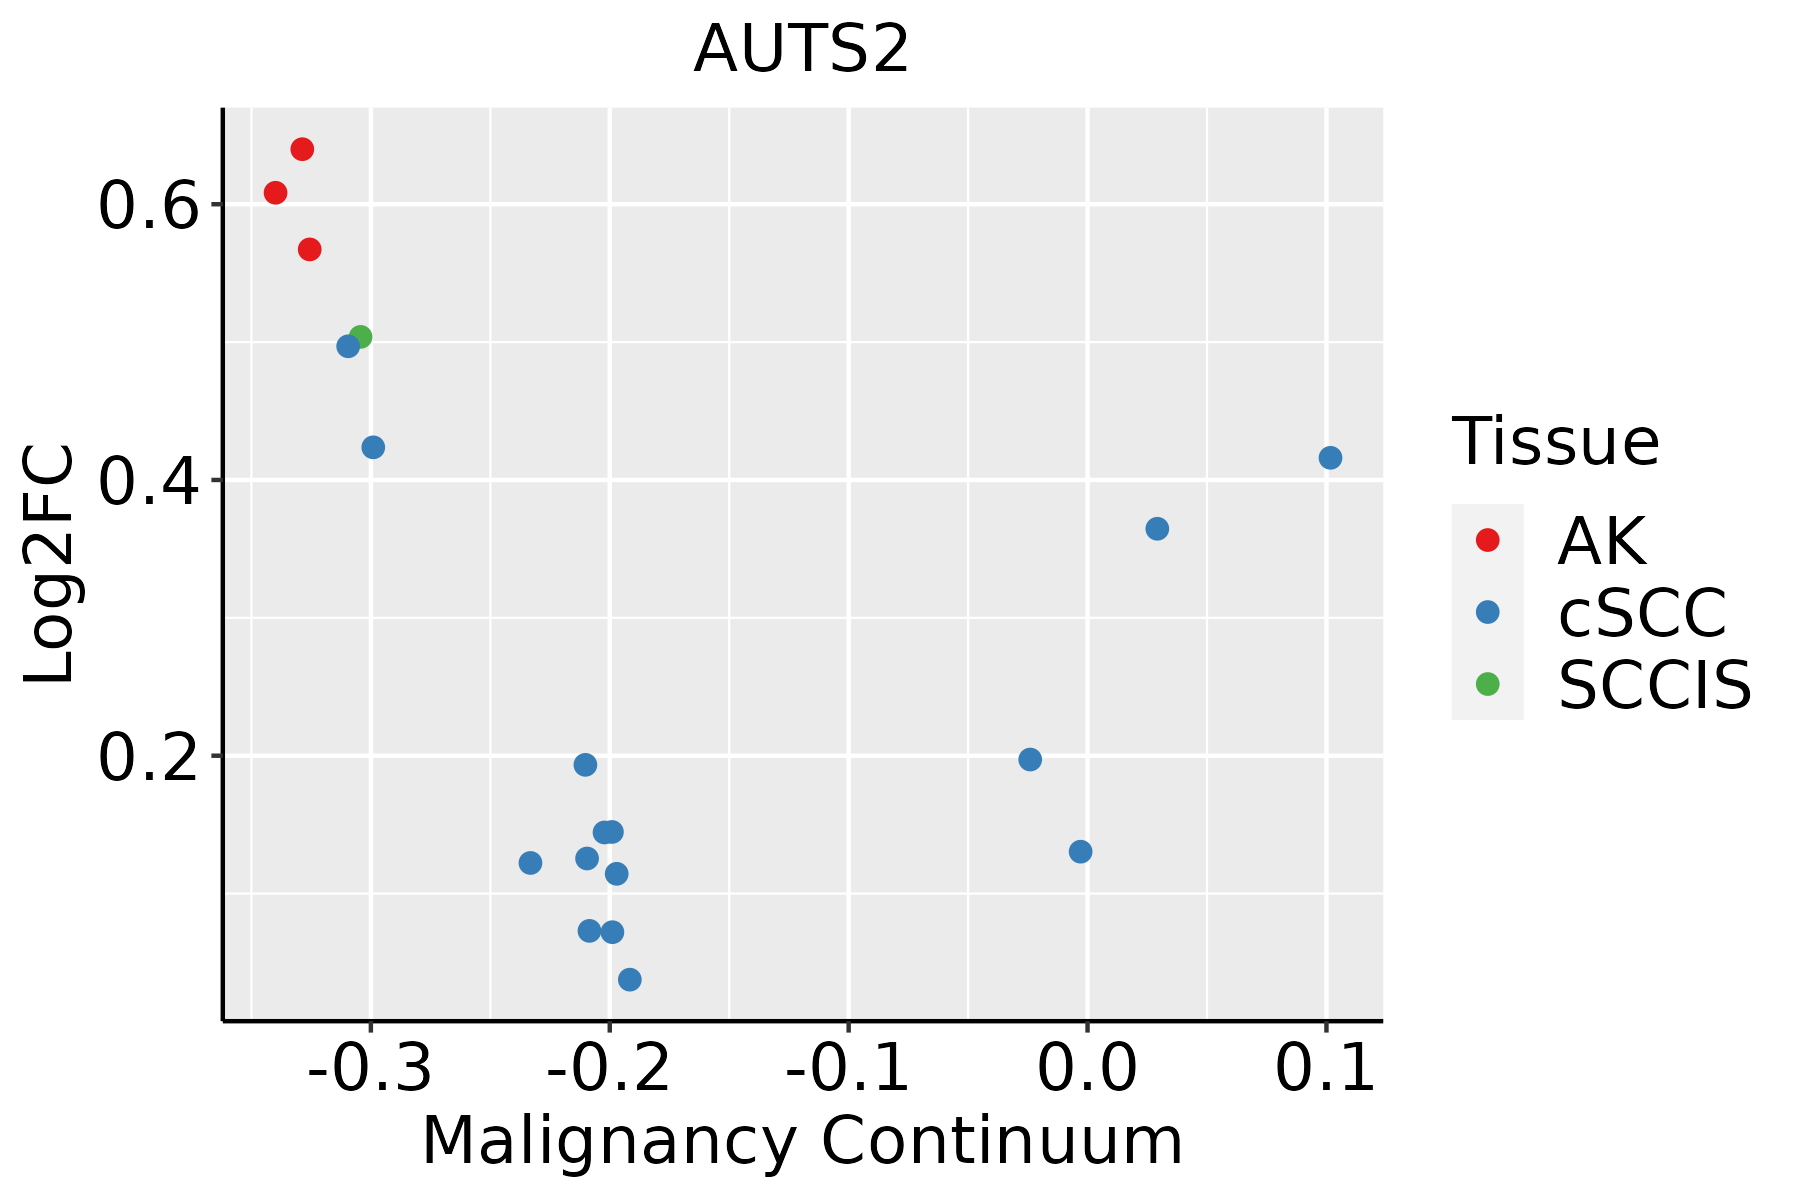
AK: Actinic keratosis
cSCC: Cutaneous squamous cell carcinoma
SCCIS:squamous cell carcinoma in situ
ThyroidThe image shows the transcriptomic changes along malignancy continuum.log2FC in expression of this searched gene in stem-like cells from each diseased tissue sample relative to stem-like cells in normal samples in each tissue plotted against the malignancy continuum. Samples are colored based on if they are from different disease stage.ATC: Anaplastic thyroid cancer
HT: Hashimoto's thyroiditis
PTC: Papillary thyroid cancer
∗log2FC in expression of this searched gene in stem-like cells from each diseased tissue sample relative to stem-like cells in normal samples in each tissue plotted against the malignancy continuum. Samples are colored based on if they are from different disease stage.

Top

Malignant transformation related pathway analysis

check buttonFind out the enriched GO biological processes and KEGG pathways involved in transition from healthy to precancer to cancer
check button Figure of enriched GO biological processes.
TissueDisease StageEnriched GO biological Processes
ColorectumADGO analysis - Figure of enriched GO biological processes: Top 15 enriched GO BP terms are showed in the bar plot of each disease state in each tissue. Each row represents a significant GO biological process which is colored according to the -log10(p.adjust).
ColorectumSERGO analysis - Figure of enriched GO biological processes: Top 15 enriched GO BP terms are showed in the bar plot of each disease state in each tissue. Each row represents a significant GO biological process which is colored according to the -log10(p.adjust).
ColorectumMSSGO analysis - Figure of enriched GO biological processes: Top 15 enriched GO BP terms are showed in the bar plot of each disease state in each tissue. Each row represents a significant GO biological process which is colored according to the -log10(p.adjust).
ColorectumMSI-HGO analysis - Figure of enriched GO biological processes: Top 15 enriched GO BP terms are showed in the bar plot of each disease state in each tissue. Each row represents a significant GO biological process which is colored according to the -log10(p.adjust).
ColorectumFAPGO analysis - Figure of enriched GO biological processes: Top 15 enriched GO BP terms are showed in the bar plot of each disease state in each tissue. Each row represents a significant GO biological process which is colored according to the -log10(p.adjust).
∗Top 15 enriched GO BP terms are showed in the bar plot of each disease state in each tissue. Each row represents a significant GO biological process which is colored according to the -log10(p.adjust).
Page: 1 2 3 4 5 6 7 8 9 

check button Enriched GO biological processes.
GO IDTissueDisease StageDescriptionGene RatioBg Ratiopvaluep.adjustCount
GO:00510566CervixCCregulation of small GTPase mediated signal transduction75/2311302/187231.54e-091.74e-0775
GO:00072656CervixCCRas protein signal transduction79/2311337/187239.49e-097.77e-0779
GO:00975817CervixCClamellipodium organization31/231190/187234.57e-082.76e-0631
GO:00300325CervixCClamellipodium assembly26/231172/187231.87e-078.48e-0626
GO:00315328CervixCCactin cytoskeleton reorganization31/2311107/187233.34e-068.99e-0531
GO:00313467CervixCCpositive regulation of cell projection organization72/2311353/187231.04e-052.32e-0472
GO:00160498CervixCCcell growth92/2311482/187231.16e-052.49e-0492
GO:19027437CervixCCregulation of lamellipodium organization19/231154/187231.27e-052.60e-0419
GO:00615647CervixCCaxon development89/2311467/187231.71e-053.27e-0489
GO:00465785CervixCCregulation of Ras protein signal transduction44/2311189/187232.05e-053.73e-0444
GO:19027457CervixCCpositive regulation of lamellipodium organization14/231137/187236.97e-059.81e-0414
GO:00074097CervixCCaxonogenesis78/2311418/187231.14e-041.43e-0378
GO:00165705CervixCChistone modification84/2311463/187231.70e-042.01e-0384
GO:00105916CervixCCregulation of lamellipodium assembly14/231142/187233.32e-043.49e-0314
GO:00105926CervixCCpositive regulation of lamellipodium assembly11/231129/187234.06e-044.15e-0311
GO:00349685CervixCChistone lysine methylation27/2311115/187236.61e-046.09e-0327
GO:00310565CervixCCregulation of histone modification33/2311152/187237.97e-047.00e-0333
GO:00605606CervixCCdevelopmental growth involved in morphogenesis46/2311234/187238.82e-047.63e-0346
GO:01200328CervixCCregulation of plasma membrane bounded cell projection assembly38/2311186/187231.14e-039.35e-0338
GO:00604917CervixCCregulation of cell projection assembly38/2311188/187231.40e-031.10e-0238
Page: 1 2 3 4 5 6 7 8 9 10 11 12 13 14 15 16 17 18 19 20 21 22 23 24 25 26 27 28 29 30 31 32 33 34 35 36 37 38 39 40 

check button Enriched KEGG pathways.
Pathway IDTissueDisease StageDescriptionGene RatioBg Ratiopvaluep.adjustqvalueCount
Page: 1 

Top

Cell-cell communication analysis

check buttonIdentification of potential cell-cell interactions between two cell types and their ligand-receptor pairs for different disease states
LigandReceptorLRpairPathwayTissueDisease Stage
Page: 1 

Top

Single-cell gene regulatory network inference analysis

check buttonFind out the significant the regulons (TFs) and the target genes of each regulon across cell types for different disease states
TFCell TypeTissueDisease StageTarget GeneRSSRegulon Activity
∗The dot plots of a searched regulon are shown for all cell subpopulations in each disease state of each tissue based on the regulon specific score inferred using pySCENIC and by calculating the average expression.
Page: 1 

Top

Somatic mutation of malignant transformation related genes

check buttonAnnotation of somatic variants for genes involved in malignant transformation
Hugo SymbolVariant ClassVariant ClassificationdbSNP RSHGVScHGVSpHGVSp ShortSWISSPROTBIOTYPESIFTPolyPhenTumor Sample BarcodeTissueHistologySexAgeStageTherapy TypesDrugsOutcome
AUTS2SNVMissense_Mutationnovelc.3679C>Ap.Leu1227Metp.L1227MQ8WXX7protein_codingdeleterious(0.05)probably_damaging(0.998)TCGA-A8-A09Q-01Breastbreast invasive carcinomaFemale>=65III/IVHormone TherapyanastrozoleSD
AUTS2SNVMissense_Mutationc.1429N>Gp.Leu477Valp.L477VQ8WXX7protein_codingdeleterious(0)benign(0.359)TCGA-AC-A23H-01Breastbreast invasive carcinomaFemale>=65I/IIUnknownUnknownPD
AUTS2SNVMissense_Mutationc.2284N>Cp.Gly762Argp.G762RQ8WXX7protein_codingdeleterious(0)probably_damaging(0.942)TCGA-BH-A0BZ-01Breastbreast invasive carcinomaFemale<65III/IVChemotherapydoxorubicinCR
AUTS2SNVMissense_Mutationc.2285N>Tp.Gly762Valp.G762VQ8WXX7protein_codingdeleterious(0)probably_damaging(0.999)TCGA-BH-A0BZ-01Breastbreast invasive carcinomaFemale<65III/IVChemotherapydoxorubicinCR
AUTS2SNVMissense_Mutationc.2335N>Tp.Asp779Tyrp.D779YQ8WXX7protein_codingdeleterious(0)probably_damaging(0.983)TCGA-BH-A0DH-01Breastbreast invasive carcinomaFemale<65I/IIChemotherapycyclophosphamideSD
AUTS2SNVMissense_Mutationnovelc.3664C>Gp.Pro1222Alap.P1222AQ8WXX7protein_codingdeleterious(0)probably_damaging(0.941)TCGA-OL-A5RW-01Breastbreast invasive carcinomaFemale<65I/IIChemotherapyadriamycinCR
AUTS2insertionNonsense_Mutationnovelc.2058_2059insTAGGCAGTTGTATCCAGCACTGCGGGCGGAAATGATTCCATp.Leu687Terp.L687*Q8WXX7protein_codingTCGA-A8-A06Z-01Breastbreast invasive carcinomaFemale>=65I/IIUnknownUnknownSD
AUTS2SNVMissense_Mutationc.1549N>Tp.Pro517Serp.P517SQ8WXX7protein_codingtolerated(0.21)probably_damaging(0.93)TCGA-EK-A3GK-01Cervixcervical & endocervical cancerFemale<65I/IIUnknownUnknownSD
AUTS2SNVMissense_Mutationc.2674G>Cp.Glu892Glnp.E892QQ8WXX7protein_codingdeleterious(0.01)possibly_damaging(0.542)TCGA-JX-A3Q0-01Cervixcervical & endocervical cancerFemale<65III/IVUnknownUnknownSD
AUTS2SNVMissense_Mutationc.1150G>Ap.Ala384Thrp.A384TQ8WXX7protein_codingtolerated(0.29)benign(0.001)TCGA-A6-5665-01Colorectumcolon adenocarcinomaFemale>=65I/IIUnknownUnknownPD
Page: 1 2 3 4 5 6 7 8 9 10 11 12 13 14 15 16 

Top

Related drugs of malignant transformation related genes

check buttonIdentification of chemicals and drugs interact with genes involved in malignant transfromation
(DGIdb 4.0)
Entrez IDSymbolCategoryInteraction TypesDrug Claim NameDrug NamePMIDs
Page: 1