
|
|||||
|
 | |
| |
| |
| |
| |
| |
|
Gene: AURKB |
Gene summary for AURKB |
| Gene information | Species | Human | Gene symbol | AURKB | Gene ID | 9212 |
| Gene name | aurora kinase B | |
| Gene Alias | AIK2 | |
| Cytomap | 17p13.1 | |
| Gene Type | protein-coding | GO ID | GO:0000022 | UniProtAcc | Q96GD4 |
Top |
Malignant transformation analysis |
| Identification of the aberrant gene expression in precancerous and cancerous lesions by comparing the gene expression of stem-like cells in diseased tissues with normal stem cells |
| Entrez ID | Symbol | Replicates | Species | Organ | Tissue | Adj P-value | Log2FC | Malignancy |
| 9212 | AURKB | P2T-E | Human | Esophagus | ESCC | 9.44e-07 | 4.81e-01 | 0.1177 |
| 9212 | AURKB | P4T-E | Human | Esophagus | ESCC | 1.49e-09 | 3.93e-01 | 0.1323 |
| 9212 | AURKB | P5T-E | Human | Esophagus | ESCC | 8.56e-12 | 2.77e-01 | 0.1327 |
| 9212 | AURKB | P8T-E | Human | Esophagus | ESCC | 3.50e-02 | 1.55e-01 | 0.0889 |
| 9212 | AURKB | P9T-E | Human | Esophagus | ESCC | 6.74e-06 | 2.10e-01 | 0.1131 |
| 9212 | AURKB | P10T-E | Human | Esophagus | ESCC | 2.02e-06 | 2.30e-01 | 0.116 |
| 9212 | AURKB | P16T-E | Human | Esophagus | ESCC | 8.40e-04 | 1.55e-01 | 0.1153 |
| 9212 | AURKB | P17T-E | Human | Esophagus | ESCC | 3.52e-10 | 8.08e-01 | 0.1278 |
| 9212 | AURKB | P19T-E | Human | Esophagus | ESCC | 5.57e-05 | 9.56e-01 | 0.1662 |
| 9212 | AURKB | P20T-E | Human | Esophagus | ESCC | 2.18e-03 | 2.45e-01 | 0.1124 |
| 9212 | AURKB | P21T-E | Human | Esophagus | ESCC | 4.12e-11 | 3.60e-01 | 0.1617 |
| 9212 | AURKB | P24T-E | Human | Esophagus | ESCC | 5.30e-21 | 6.19e-01 | 0.1287 |
| 9212 | AURKB | P28T-E | Human | Esophagus | ESCC | 1.33e-02 | 1.58e-01 | 0.1149 |
| 9212 | AURKB | P31T-E | Human | Esophagus | ESCC | 2.03e-09 | 3.49e-01 | 0.1251 |
| 9212 | AURKB | P32T-E | Human | Esophagus | ESCC | 2.56e-16 | 5.84e-01 | 0.1666 |
| 9212 | AURKB | P36T-E | Human | Esophagus | ESCC | 1.12e-05 | 3.33e-01 | 0.1187 |
| 9212 | AURKB | P37T-E | Human | Esophagus | ESCC | 1.03e-11 | 4.07e-01 | 0.1371 |
| 9212 | AURKB | P38T-E | Human | Esophagus | ESCC | 1.45e-09 | 5.86e-01 | 0.127 |
| 9212 | AURKB | P42T-E | Human | Esophagus | ESCC | 2.62e-05 | 2.92e-01 | 0.1175 |
| 9212 | AURKB | P44T-E | Human | Esophagus | ESCC | 6.93e-04 | 2.60e-01 | 0.1096 |
| Page: 1 2 3 |
| Tissue | Expression Dynamics | Abbreviation |
| Esophagus |  | ESCC: Esophageal squamous cell carcinoma |
| HGIN: High-grade intraepithelial neoplasias | ||
| LGIN: Low-grade intraepithelial neoplasias | ||
| Oral Cavity | 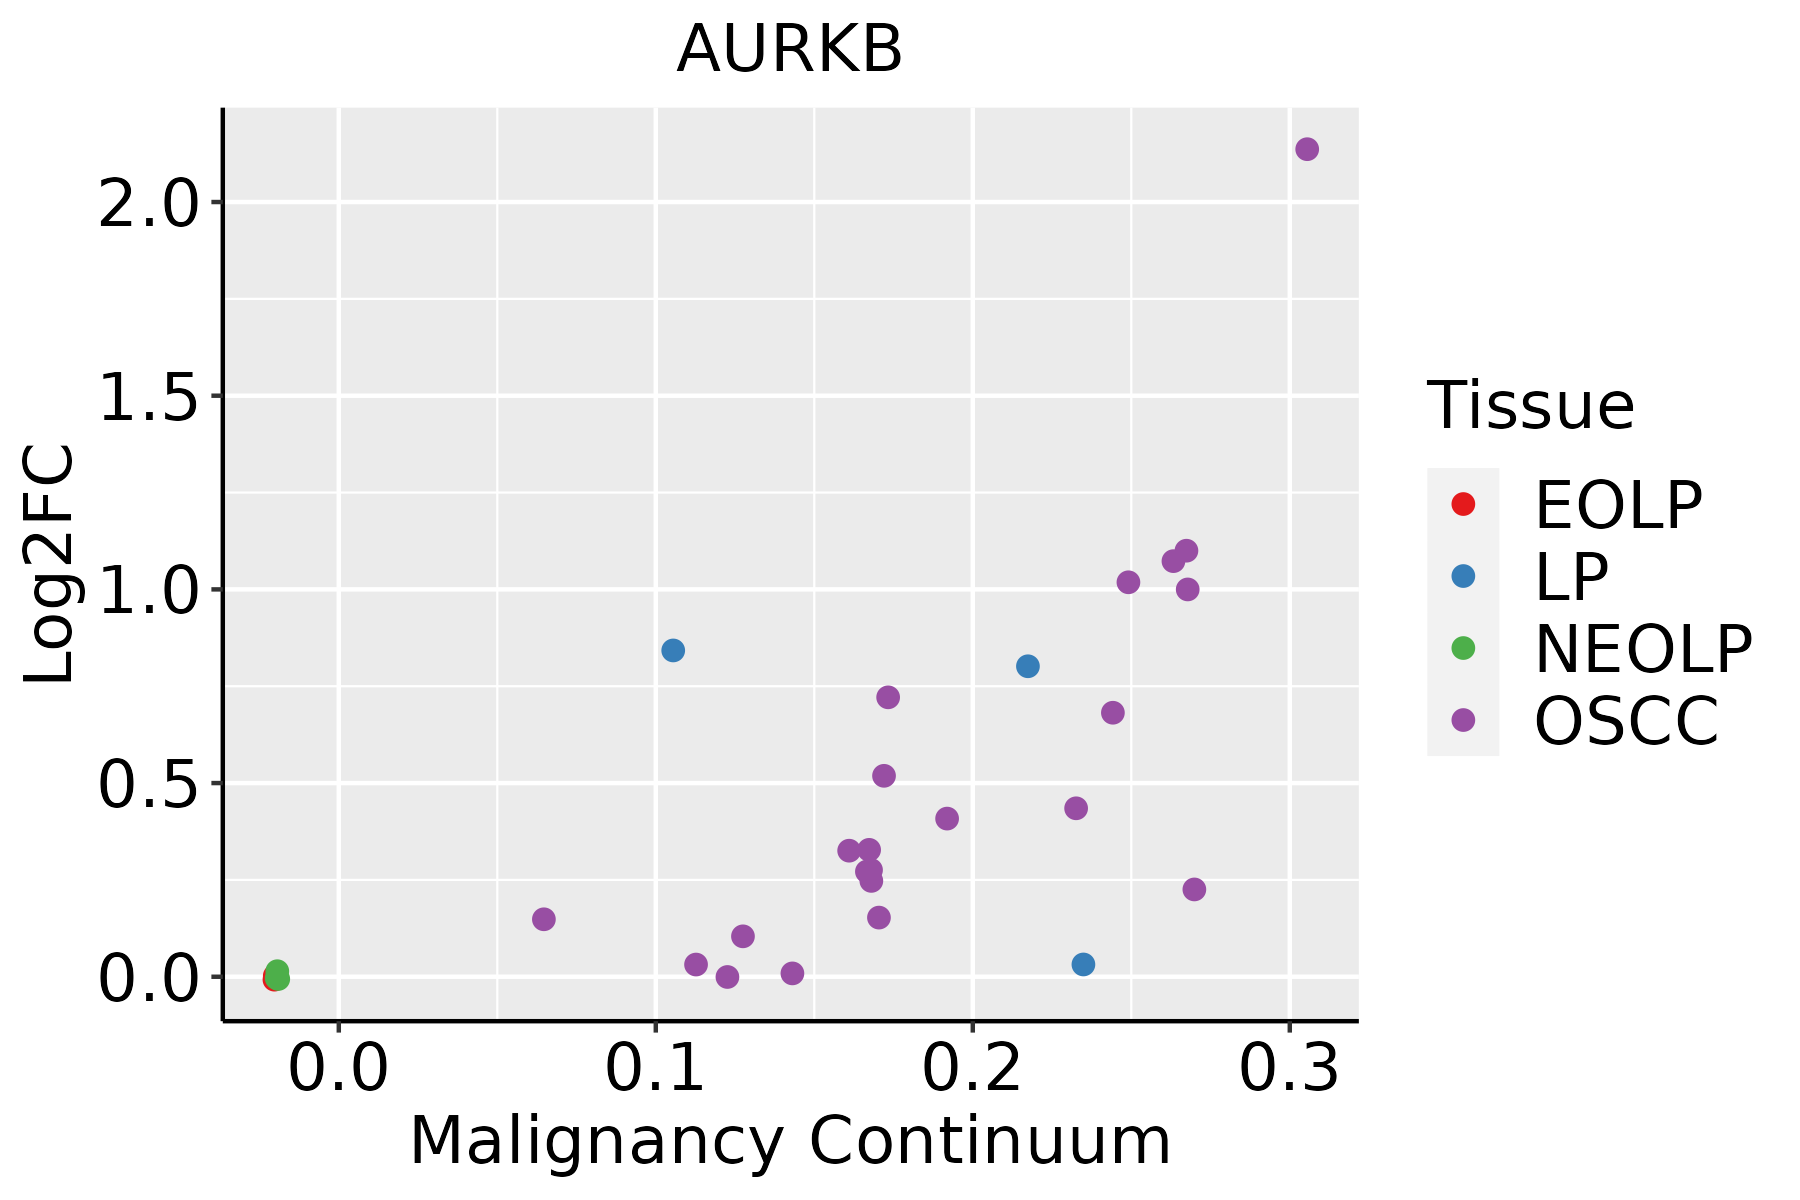 | EOLP: Erosive Oral lichen planus |
| LP: leukoplakia | ||
| NEOLP: Non-erosive oral lichen planus | ||
| OSCC: Oral squamous cell carcinoma | ||
| Skin | 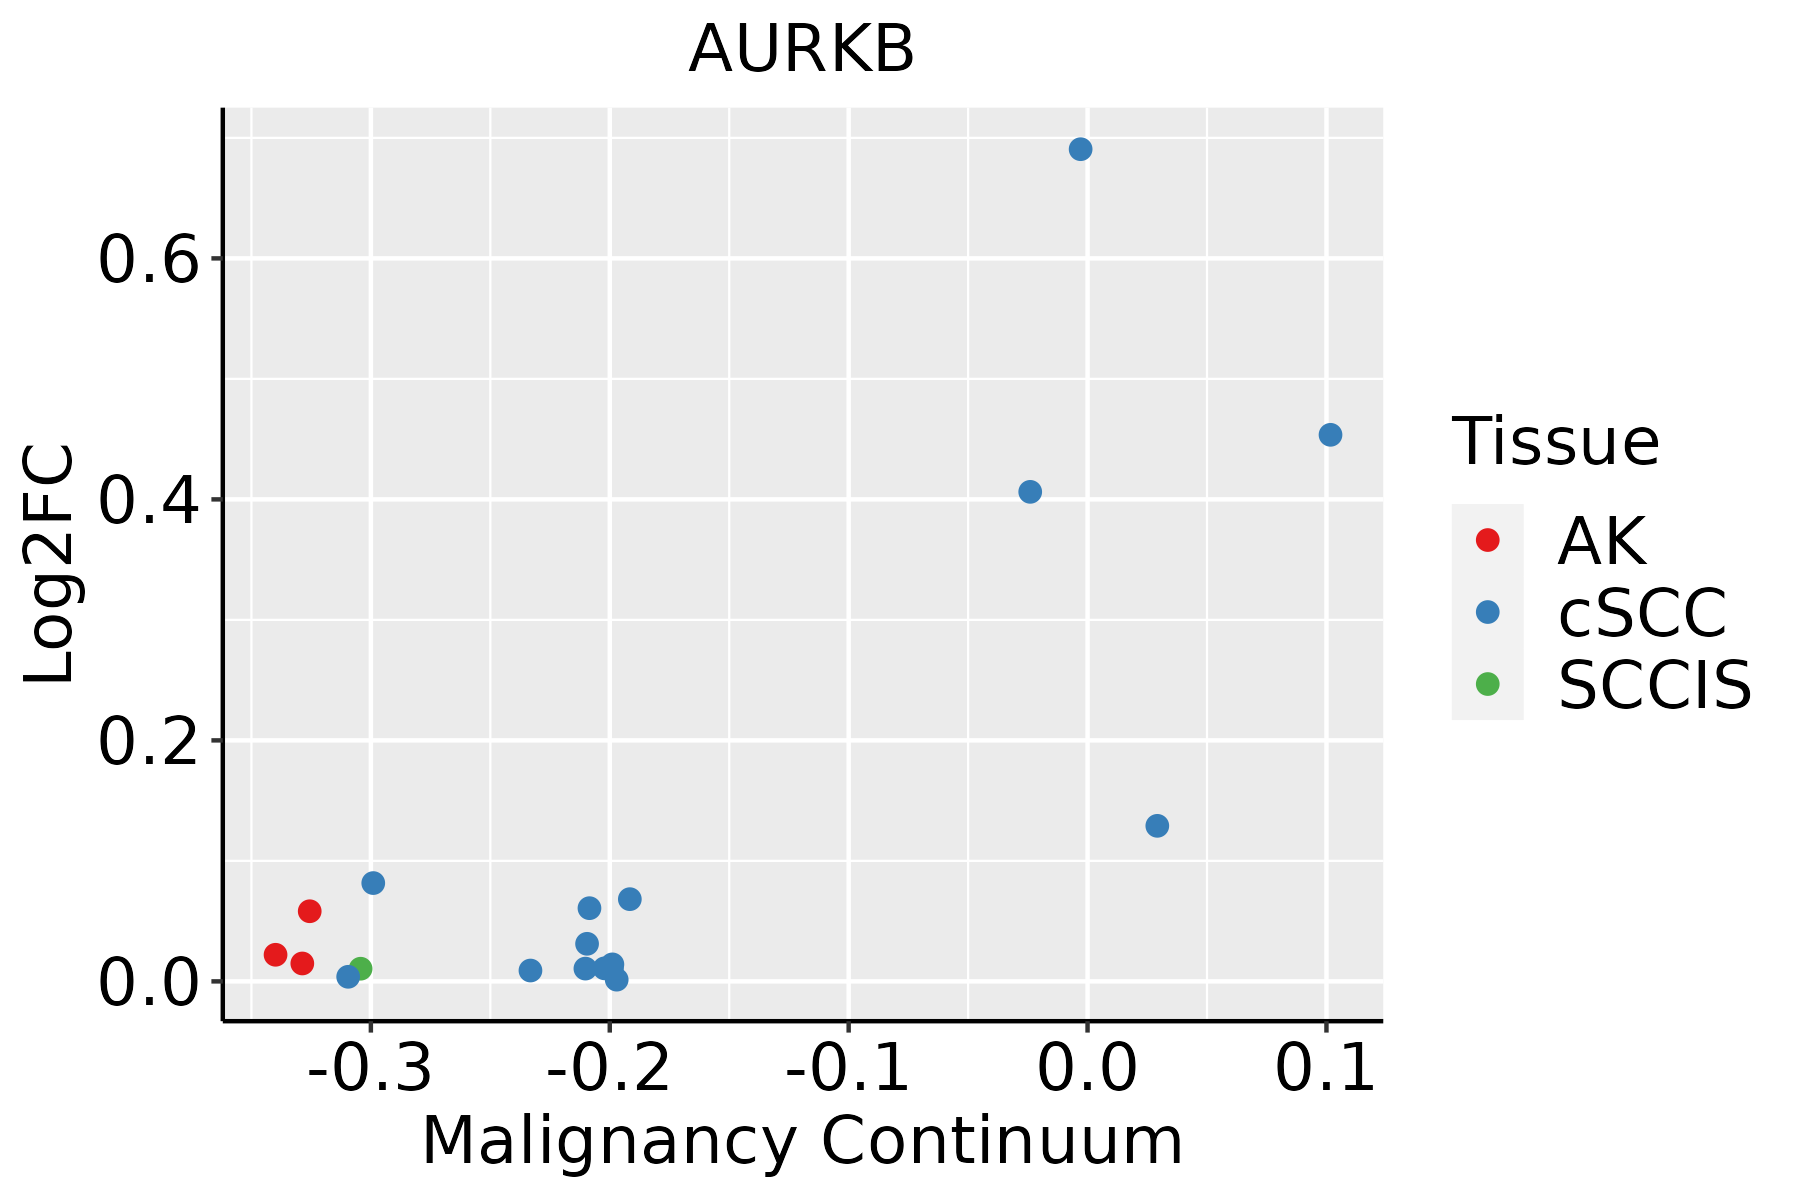 | AK: Actinic keratosis |
| cSCC: Cutaneous squamous cell carcinoma | ||
| SCCIS:squamous cell carcinoma in situ | ||
| Thyroid | 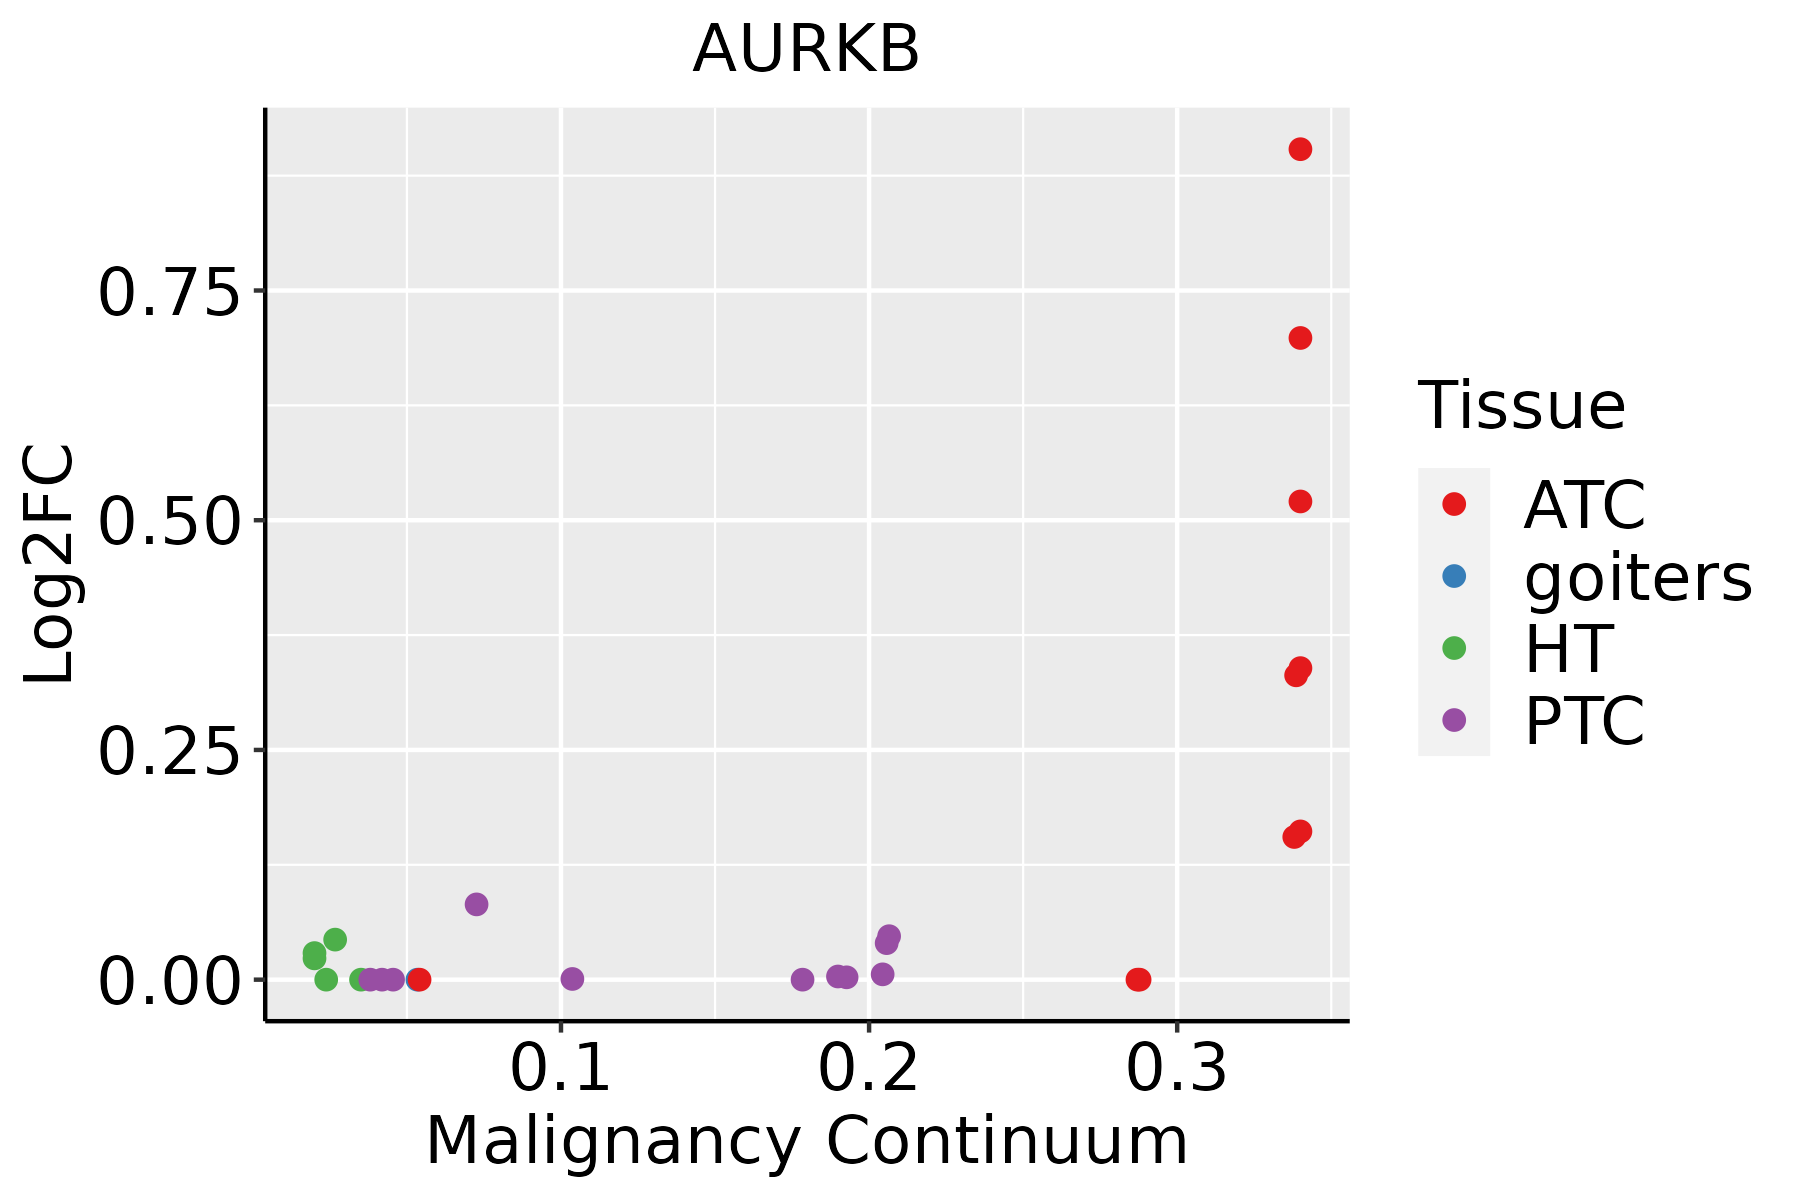 | ATC: Anaplastic thyroid cancer |
| HT: Hashimoto's thyroiditis | ||
| PTC: Papillary thyroid cancer |
| ∗log2FC in expression of this searched gene in stem-like cells from each diseased tissue sample relative to stem-like cells in normal samples in each tissue plotted against the malignancy continuum. Samples are colored based on if they are from different disease stage. |
Top |
Malignant transformation related pathway analysis |
| Find out the enriched GO biological processes and KEGG pathways involved in transition from healthy to precancer to cancer |
| Tissue | Disease Stage | Enriched GO biological Processes |
| Colorectum | AD |  |
| Colorectum | SER |  |
| Colorectum | MSS |  |
| Colorectum | MSI-H |  |
| Colorectum | FAP |  |
| ∗Top 15 enriched GO BP terms are showed in the bar plot of each disease state in each tissue. Each row represents a significant GO biological process which is colored according to the -log10(p.adjust). |
| Page: 1 2 3 4 5 6 7 8 9 |
| GO ID | Tissue | Disease Stage | Description | Gene Ratio | Bg Ratio | pvalue | p.adjust | Count |
| GO:001657015 | Esophagus | ESCC | histone modification | 323/8552 | 463/18723 | 2.61e-26 | 7.88e-24 | 323 |
| GO:014001414 | Esophagus | ESCC | mitotic nuclear division | 218/8552 | 287/18723 | 6.17e-26 | 1.78e-23 | 218 |
| GO:005165617 | Esophagus | ESCC | establishment of organelle localization | 273/8552 | 390/18723 | 9.13e-23 | 1.81e-20 | 273 |
| GO:000007011 | Esophagus | ESCC | mitotic sister chromatid segregation | 138/8552 | 168/18723 | 1.37e-22 | 2.63e-20 | 138 |
| GO:00008194 | Esophagus | ESCC | sister chromatid segregation | 157/8552 | 202/18723 | 8.41e-21 | 1.33e-18 | 157 |
| GO:0051098111 | Esophagus | ESCC | regulation of binding | 251/8552 | 363/18723 | 6.73e-20 | 8.46e-18 | 251 |
| GO:003304416 | Esophagus | ESCC | regulation of chromosome organization | 145/8552 | 187/18723 | 3.80e-19 | 4.31e-17 | 145 |
| GO:000705911 | Esophagus | ESCC | chromosome segregation | 238/8552 | 346/18723 | 1.72e-18 | 1.82e-16 | 238 |
| GO:004477216 | Esophagus | ESCC | mitotic cell cycle phase transition | 281/8552 | 424/18723 | 4.63e-18 | 4.45e-16 | 281 |
| GO:190285015 | Esophagus | ESCC | microtubule cytoskeleton organization involved in mitosis | 116/8552 | 147/18723 | 1.25e-16 | 9.91e-15 | 116 |
| GO:000734615 | Esophagus | ESCC | regulation of mitotic cell cycle | 293/8552 | 457/18723 | 8.00e-16 | 5.64e-14 | 293 |
| GO:000705214 | Esophagus | ESCC | mitotic spindle organization | 97/8552 | 120/18723 | 2.17e-15 | 1.33e-13 | 97 |
| GO:000941113 | Esophagus | ESCC | response to UV | 115/8552 | 149/18723 | 3.29e-15 | 1.93e-13 | 115 |
| GO:000705114 | Esophagus | ESCC | spindle organization | 134/8552 | 184/18723 | 5.70e-14 | 2.87e-12 | 134 |
| GO:0072331111 | Esophagus | ESCC | signal transduction by p53 class mediator | 121/8552 | 163/18723 | 9.61e-14 | 4.69e-12 | 121 |
| GO:005131011 | Esophagus | ESCC | metaphase plate congression | 58/8552 | 65/18723 | 1.81e-13 | 8.63e-12 | 58 |
| GO:005105215 | Esophagus | ESCC | regulation of DNA metabolic process | 232/8552 | 359/18723 | 2.40e-13 | 1.13e-11 | 232 |
| GO:000708011 | Esophagus | ESCC | mitotic metaphase plate congression | 47/8552 | 50/18723 | 3.15e-13 | 1.47e-11 | 47 |
| GO:00482853 | Esophagus | ESCC | organelle fission | 301/8552 | 488/18723 | 4.64e-13 | 2.12e-11 | 301 |
| GO:00988133 | Esophagus | ESCC | nuclear chromosome segregation | 187/8552 | 281/18723 | 1.00e-12 | 4.36e-11 | 187 |
| Page: 1 2 3 4 5 6 7 8 9 10 11 12 13 14 15 16 17 18 19 20 21 22 23 24 |
| Pathway ID | Tissue | Disease Stage | Description | Gene Ratio | Bg Ratio | pvalue | p.adjust | qvalue | Count |
| hsa0411023 | Esophagus | ESCC | Cell cycle | 126/4205 | 157/8465 | 1.34e-15 | 5.60e-14 | 2.87e-14 | 126 |
| hsa0411033 | Esophagus | ESCC | Cell cycle | 126/4205 | 157/8465 | 1.34e-15 | 5.60e-14 | 2.87e-14 | 126 |
| hsa041108 | Oral cavity | OSCC | Cell cycle | 118/3704 | 157/8465 | 7.15e-16 | 2.66e-14 | 1.35e-14 | 118 |
| hsa0411015 | Oral cavity | OSCC | Cell cycle | 118/3704 | 157/8465 | 7.15e-16 | 2.66e-14 | 1.35e-14 | 118 |
| Page: 1 |
Top |
Cell-cell communication analysis |
| Identification of potential cell-cell interactions between two cell types and their ligand-receptor pairs for different disease states |
| Ligand | Receptor | LRpair | Pathway | Tissue | Disease Stage |
| Page: 1 |
Top |
Single-cell gene regulatory network inference analysis |
| Find out the significant the regulons (TFs) and the target genes of each regulon across cell types for different disease states |
| TF | Cell Type | Tissue | Disease Stage | Target Gene | RSS | Regulon Activity |
| ∗The dot plots of a searched regulon are shown for all cell subpopulations in each disease state of each tissue based on the regulon specific score inferred using pySCENIC and by calculating the average expression. |
| Page: 1 |
Top |
Somatic mutation of malignant transformation related genes |
| Annotation of somatic variants for genes involved in malignant transformation |
| Hugo Symbol | Variant Class | Variant Classification | dbSNP RS | HGVSc | HGVSp | HGVSp Short | SWISSPROT | BIOTYPE | SIFT | PolyPhen | Tumor Sample Barcode | Tissue | Histology | Sex | Age | Stage | Therapy Types | Drugs | Outcome |
| AURKB | SNV | Missense_Mutation | c.386N>C | p.Ile129Thr | p.I129T | Q96GD4 | protein_coding | deleterious(0) | possibly_damaging(0.566) | TCGA-D8-A1XL-01 | Breast | breast invasive carcinoma | Female | <65 | I/II | Chemotherapy | doxorubicine+cyclophosphamide+tamoxifen | SD | |
| AURKB | SNV | Missense_Mutation | rs749454960 | c.745N>T | p.Arg249Cys | p.R249C | Q96GD4 | protein_coding | deleterious(0.02) | benign(0.012) | TCGA-D8-A1XQ-01 | Breast | breast invasive carcinoma | Female | >=65 | I/II | Unknown | Unknown | SD |
| AURKB | SNV | Missense_Mutation | rs772022668 | c.481N>A | p.Gly161Arg | p.G161R | Q96GD4 | protein_coding | deleterious(0) | probably_damaging(0.972) | TCGA-2W-A8YY-01 | Cervix | cervical & endocervical cancer | Female | <65 | I/II | Chemotherapy | cisplatin | CR |
| AURKB | SNV | Missense_Mutation | c.371G>A | p.Arg124His | p.R124H | Q96GD4 | protein_coding | deleterious(0) | possibly_damaging(0.71) | TCGA-AA-A010-01 | Colorectum | colon adenocarcinoma | Female | <65 | I/II | Chemotherapy | folinic | CR | |
| AURKB | SNV | Missense_Mutation | c.595C>T | p.His199Tyr | p.H199Y | Q96GD4 | protein_coding | deleterious(0) | probably_damaging(0.999) | TCGA-CK-4951-01 | Colorectum | colon adenocarcinoma | Female | >=65 | I/II | Unknown | Unknown | PD | |
| AURKB | SNV | Missense_Mutation | rs768656332 | c.897G>T | p.Met299Ile | p.M299I | Q96GD4 | protein_coding | tolerated(0.17) | benign(0) | TCGA-D5-6928-01 | Colorectum | colon adenocarcinoma | Male | >=65 | I/II | Unknown | Unknown | SD |
| AURKB | SNV | Missense_Mutation | rs201709756 | c.1033N>A | p.Ala345Thr | p.A345T | Q96GD4 | protein_coding | deleterious_low_confidence(0.04) | benign(0.015) | TCGA-G4-6628-01 | Colorectum | colon adenocarcinoma | Male | >=65 | I/II | Unknown | Unknown | SD |
| AURKB | SNV | Missense_Mutation | rs780771169 | c.89N>A | p.Arg30Gln | p.R30Q | Q96GD4 | protein_coding | tolerated(0.68) | benign(0.007) | TCGA-G4-6628-01 | Colorectum | colon adenocarcinoma | Male | >=65 | I/II | Unknown | Unknown | SD |
| AURKB | SNV | Missense_Mutation | rs55871613 | c.539N>T | p.Thr180Met | p.T180M | Q96GD4 | protein_coding | deleterious(0.02) | benign(0.228) | TCGA-NH-A5IV-01 | Colorectum | colon adenocarcinoma | Female | >=65 | I/II | Unknown | Unknown | SD |
| AURKB | SNV | Missense_Mutation | novel | c.50N>T | p.Ala17Val | p.A17V | Q96GD4 | protein_coding | tolerated(0.09) | benign(0.003) | TCGA-F5-6814-01 | Colorectum | rectum adenocarcinoma | Male | <65 | I/II | Unknown | Unknown | SD |
| Page: 1 2 3 4 |
Top |
Related drugs of malignant transformation related genes |
| Identification of chemicals and drugs interact with genes involved in malignant transfromation |
| (DGIdb 4.0) |
| Entrez ID | Symbol | Category | Interaction Types | Drug Claim Name | Drug Name | PMIDs |
| 9212 | AURKB | ENZYME, CLINICALLY ACTIONABLE, SERINE THREONINE KINASE, HISTONE MODIFICATION, DRUGGABLE GENOME, KINASE | ZM-447439 | CHEMBL202721 | ||
| 9212 | AURKB | ENZYME, CLINICALLY ACTIONABLE, SERINE THREONINE KINASE, HISTONE MODIFICATION, DRUGGABLE GENOME, KINASE | inhibitor | 178102344 | TOZASERTIB | |
| 9212 | AURKB | ENZYME, CLINICALLY ACTIONABLE, SERINE THREONINE KINASE, HISTONE MODIFICATION, DRUGGABLE GENOME, KINASE | LINIFANIB | LINIFANIB | ||
| 9212 | AURKB | ENZYME, CLINICALLY ACTIONABLE, SERINE THREONINE KINASE, HISTONE MODIFICATION, DRUGGABLE GENOME, KINASE | PAZOPANIB | PAZOPANIB | ||
| 9212 | AURKB | ENZYME, CLINICALLY ACTIONABLE, SERINE THREONINE KINASE, HISTONE MODIFICATION, DRUGGABLE GENOME, KINASE | inhibitor | CHEMBL495727 | AT-9283 | |
| 9212 | AURKB | ENZYME, CLINICALLY ACTIONABLE, SERINE THREONINE KINASE, HISTONE MODIFICATION, DRUGGABLE GENOME, KINASE | inhibitor | 249565620 | DANUSERTIB | |
| 9212 | AURKB | ENZYME, CLINICALLY ACTIONABLE, SERINE THREONINE KINASE, HISTONE MODIFICATION, DRUGGABLE GENOME, KINASE | CYC116 | |||
| 9212 | AURKB | ENZYME, CLINICALLY ACTIONABLE, SERINE THREONINE KINASE, HISTONE MODIFICATION, DRUGGABLE GENOME, KINASE | inhibitor | CHEMBL3545327 | TTP-607 | |
| 9212 | AURKB | ENZYME, CLINICALLY ACTIONABLE, SERINE THREONINE KINASE, HISTONE MODIFICATION, DRUGGABLE GENOME, KINASE | BAY-613606 | CHEMBL541400 | ||
| 9212 | AURKB | ENZYME, CLINICALLY ACTIONABLE, SERINE THREONINE KINASE, HISTONE MODIFICATION, DRUGGABLE GENOME, KINASE | inhibitor | 249565688 | CHEMBL1765740 |
| Page: 1 2 3 4 5 6 7 8 9 10 11 12 13 14 |

Copyright 2023-Present -The University of Texas Health Science Center at Houston |