
|
|||||
|
 | |
| |
| |
| |
| |
| |
|
Gene: AURKAIP1 |
Gene summary for AURKAIP1 |
| Gene information | Species | Human | Gene symbol | AURKAIP1 | Gene ID | 54998 |
| Gene name | aurora kinase A interacting protein 1 | |
| Gene Alias | AIP | |
| Cytomap | 1p36.33 | |
| Gene Type | protein-coding | GO ID | GO:0000278 | UniProtAcc | A0A024R0F0 |
Top |
Malignant transformation analysis |
| Identification of the aberrant gene expression in precancerous and cancerous lesions by comparing the gene expression of stem-like cells in diseased tissues with normal stem cells |
| Entrez ID | Symbol | Replicates | Species | Organ | Tissue | Adj P-value | Log2FC | Malignancy |
| 54998 | AURKAIP1 | GSM4909281 | Human | Breast | IDC | 7.91e-05 | 2.60e-01 | 0.21 |
| 54998 | AURKAIP1 | GSM4909288 | Human | Breast | IDC | 7.23e-14 | 4.62e-01 | 0.0988 |
| 54998 | AURKAIP1 | GSM4909290 | Human | Breast | IDC | 7.56e-09 | 3.95e-01 | 0.2096 |
| 54998 | AURKAIP1 | GSM4909291 | Human | Breast | IDC | 3.01e-03 | 2.89e-01 | 0.1753 |
| 54998 | AURKAIP1 | GSM4909294 | Human | Breast | IDC | 8.93e-21 | 3.66e-01 | 0.2022 |
| 54998 | AURKAIP1 | GSM4909296 | Human | Breast | IDC | 4.68e-31 | 2.78e-01 | 0.1524 |
| 54998 | AURKAIP1 | GSM4909297 | Human | Breast | IDC | 3.94e-27 | -5.70e-02 | 0.1517 |
| 54998 | AURKAIP1 | GSM4909301 | Human | Breast | IDC | 2.02e-18 | 3.76e-01 | 0.1577 |
| 54998 | AURKAIP1 | GSM4909304 | Human | Breast | IDC | 8.54e-13 | 4.01e-01 | 0.1636 |
| 54998 | AURKAIP1 | GSM4909306 | Human | Breast | IDC | 1.86e-12 | 3.81e-01 | 0.1564 |
| 54998 | AURKAIP1 | GSM4909307 | Human | Breast | IDC | 4.09e-02 | 1.19e-01 | 0.1569 |
| 54998 | AURKAIP1 | GSM4909311 | Human | Breast | IDC | 1.96e-45 | -3.52e-01 | 0.1534 |
| 54998 | AURKAIP1 | GSM4909312 | Human | Breast | IDC | 3.24e-15 | -1.93e-01 | 0.1552 |
| 54998 | AURKAIP1 | GSM4909315 | Human | Breast | IDC | 6.48e-08 | 2.65e-01 | 0.21 |
| 54998 | AURKAIP1 | GSM4909316 | Human | Breast | IDC | 8.96e-06 | 2.75e-01 | 0.21 |
| 54998 | AURKAIP1 | GSM4909317 | Human | Breast | IDC | 6.62e-05 | 3.00e-01 | 0.1355 |
| 54998 | AURKAIP1 | GSM4909318 | Human | Breast | IDC | 3.42e-10 | 5.61e-01 | 0.2031 |
| 54998 | AURKAIP1 | GSM4909319 | Human | Breast | IDC | 5.14e-59 | -1.95e-01 | 0.1563 |
| 54998 | AURKAIP1 | GSM4909320 | Human | Breast | IDC | 3.65e-10 | 7.38e-02 | 0.1575 |
| 54998 | AURKAIP1 | GSM4909321 | Human | Breast | IDC | 7.82e-28 | 1.69e-01 | 0.1559 |
| Page: 1 2 3 4 5 6 7 8 9 10 11 12 13 14 15 |
| Tissue | Expression Dynamics | Abbreviation |
| Breast | 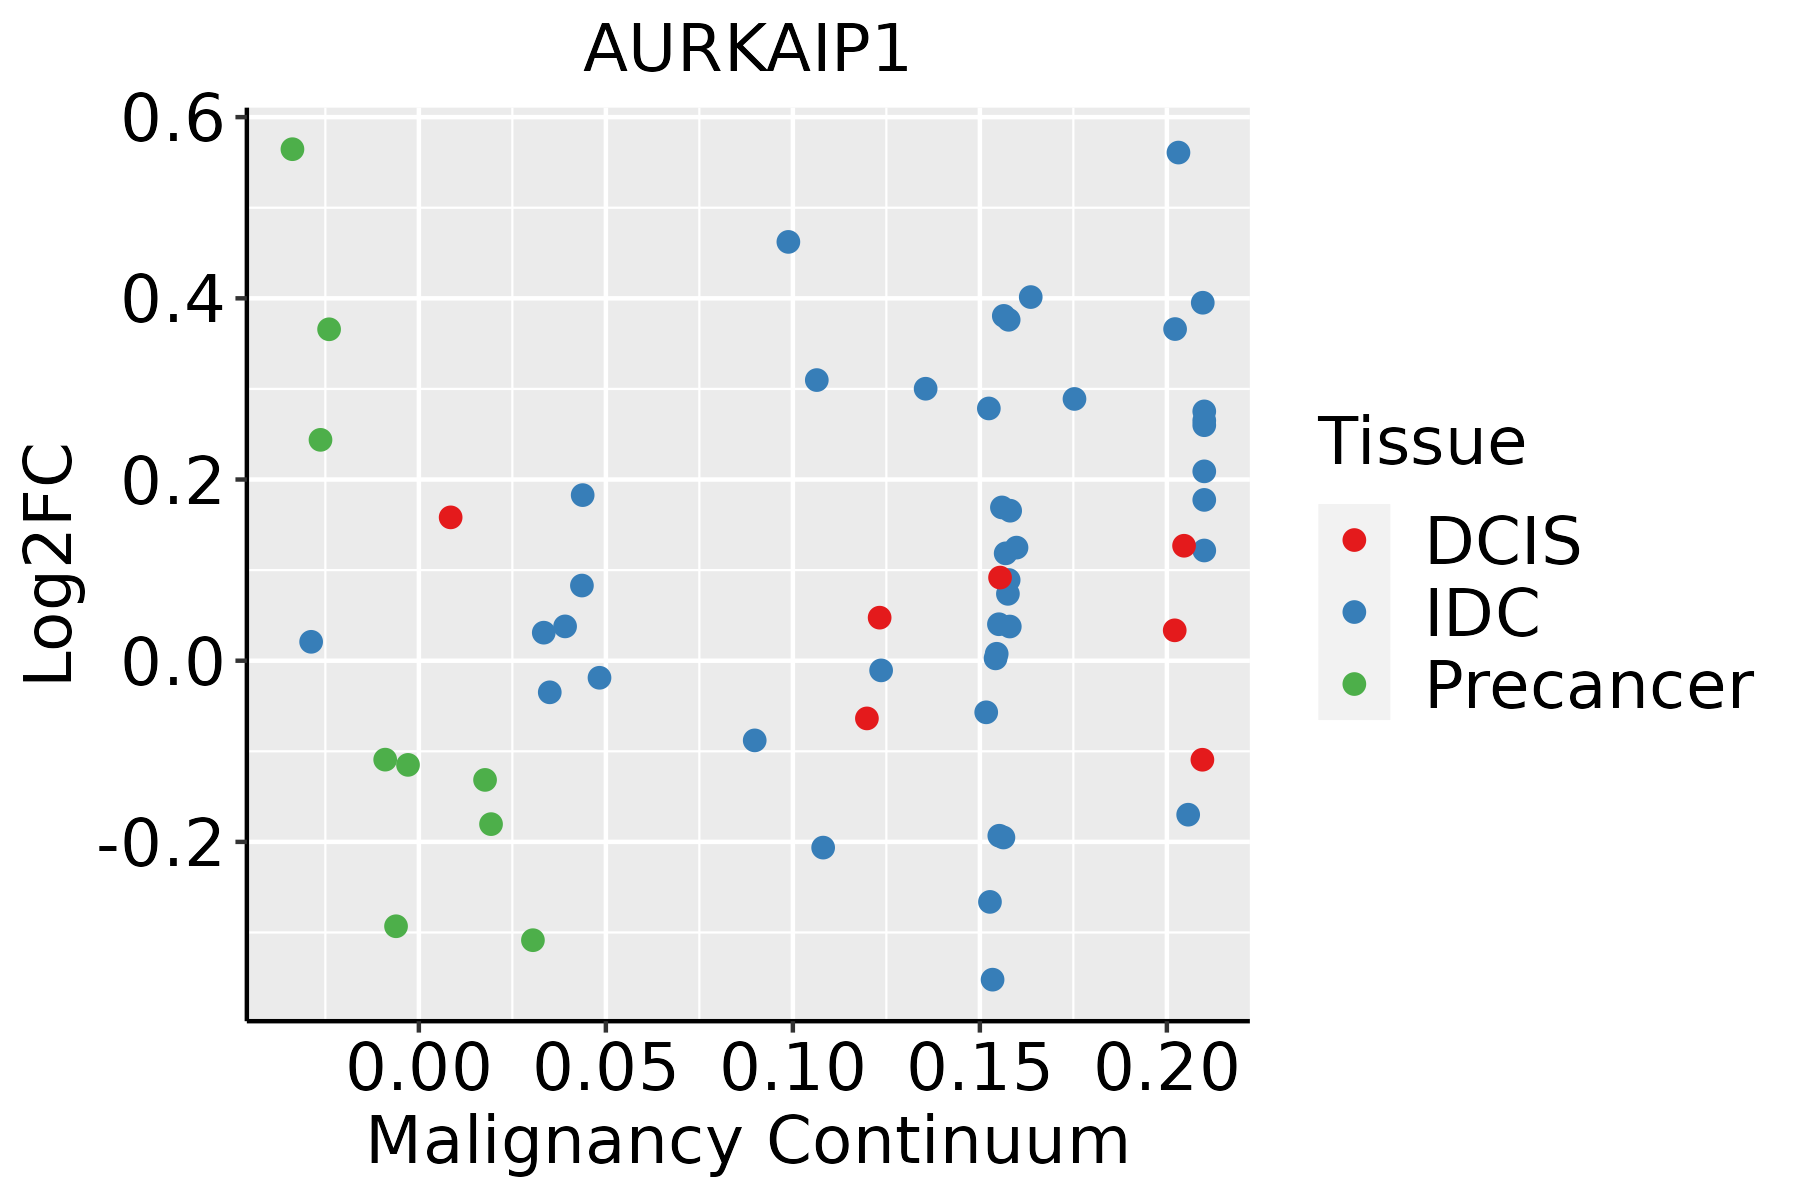 | IDC: Invasive ductal carcinoma |
| DCIS: Ductal carcinoma in situ | ||
| Precancer(BRCA1-mut): Precancerous lesion from BRCA1 mutation carriers | ||
| Cervix | 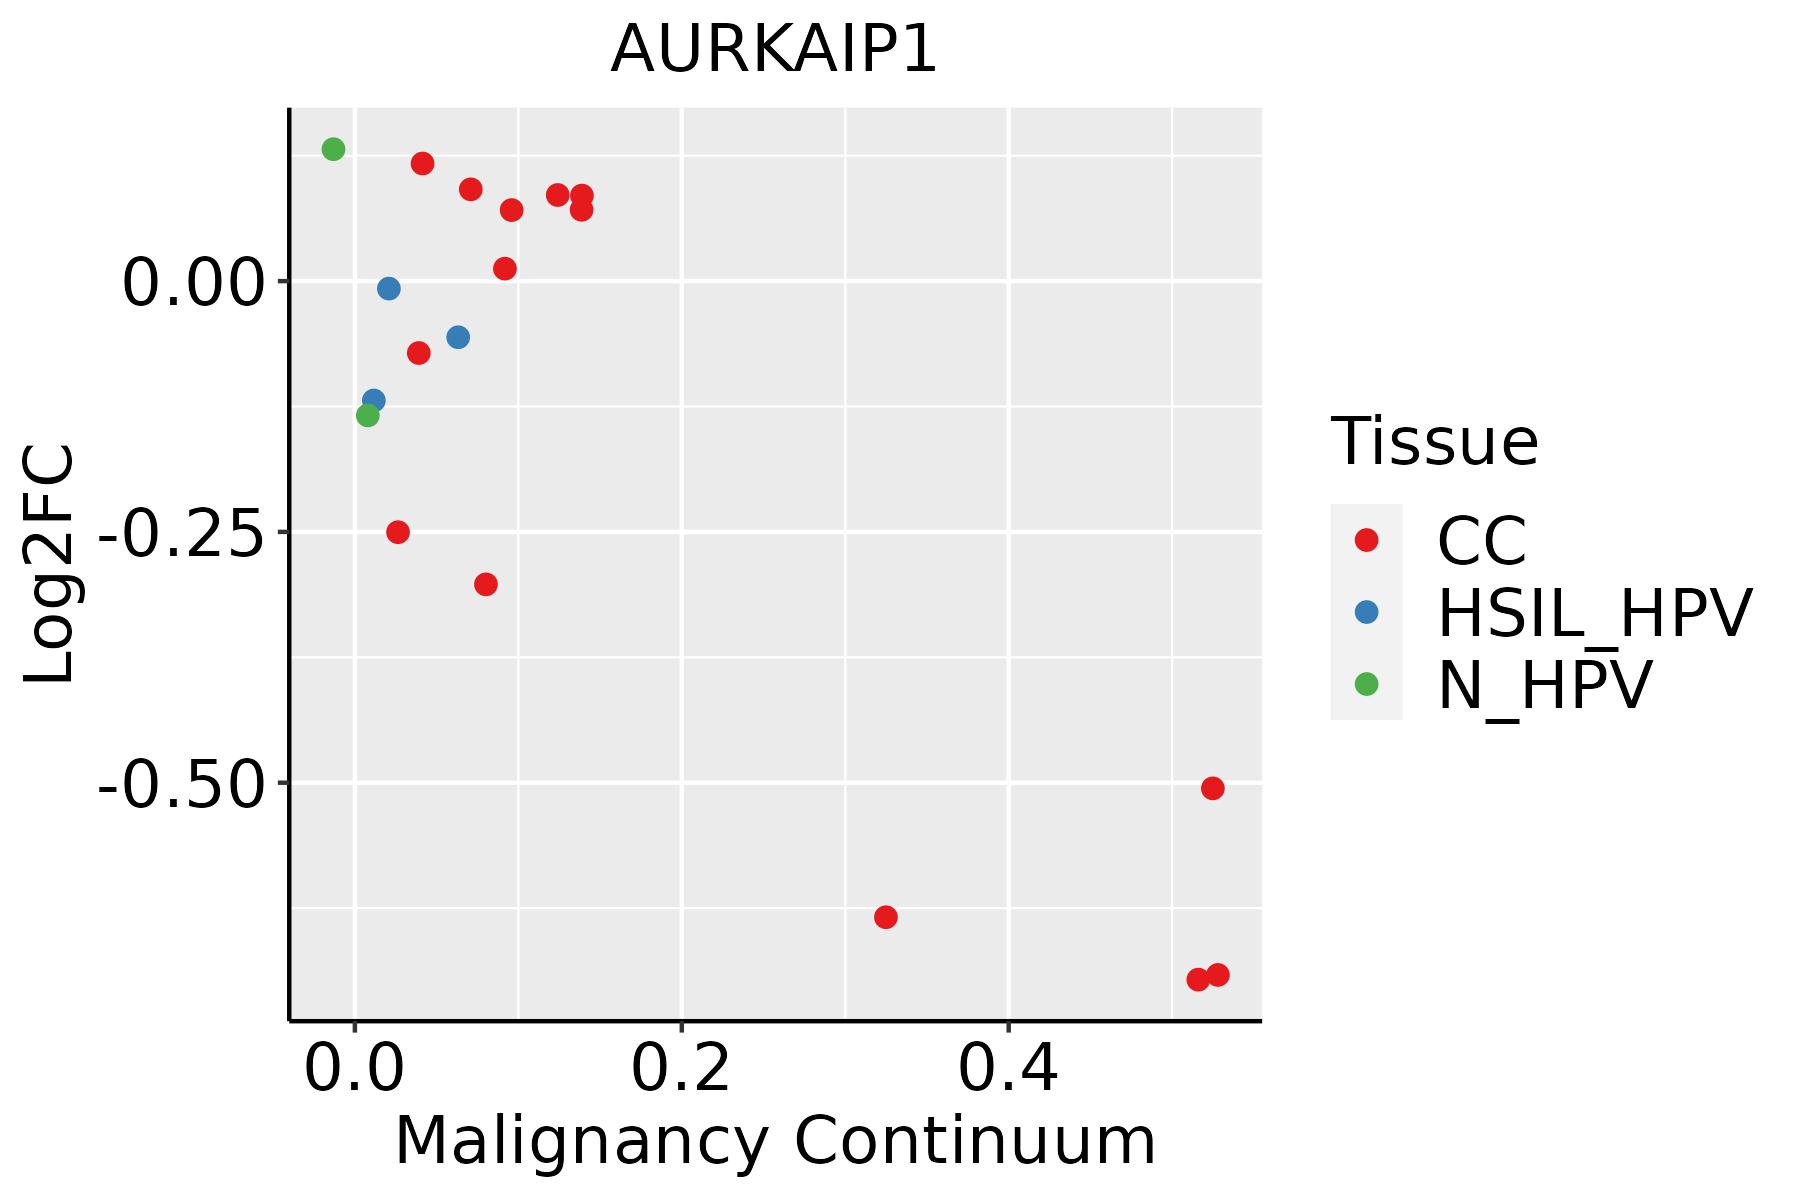 | CC: Cervix cancer |
| HSIL_HPV: HPV-infected high-grade squamous intraepithelial lesions | ||
| N_HPV: HPV-infected normal cervix | ||
| Colorectum (GSE201348) |  | FAP: Familial adenomatous polyposis |
| CRC: Colorectal cancer | ||
| Colorectum (HTA11) |  | AD: Adenomas |
| SER: Sessile serrated lesions | ||
| MSI-H: Microsatellite-high colorectal cancer | ||
| MSS: Microsatellite stable colorectal cancer | ||
| Endometrium | 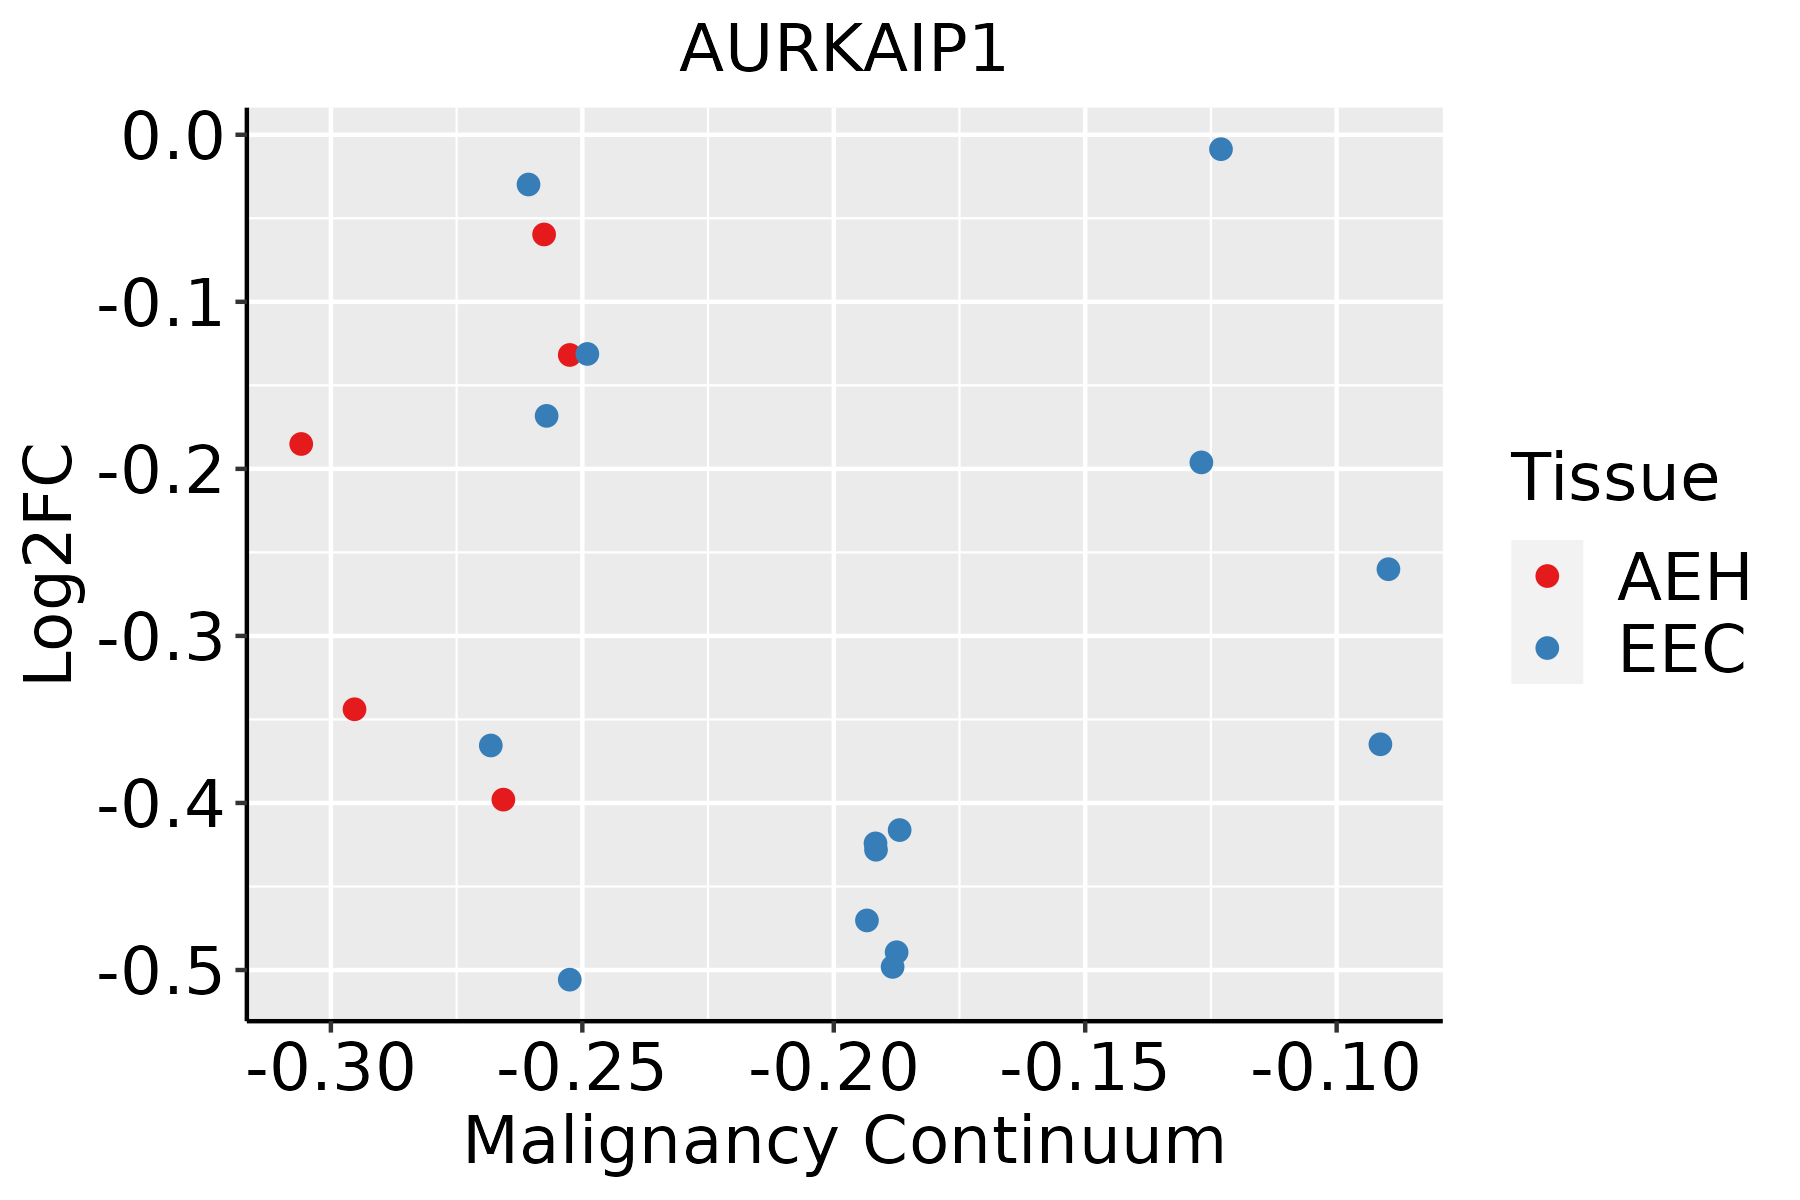 | AEH: Atypical endometrial hyperplasia |
| EEC: Endometrioid Cancer | ||
| Esophagus | 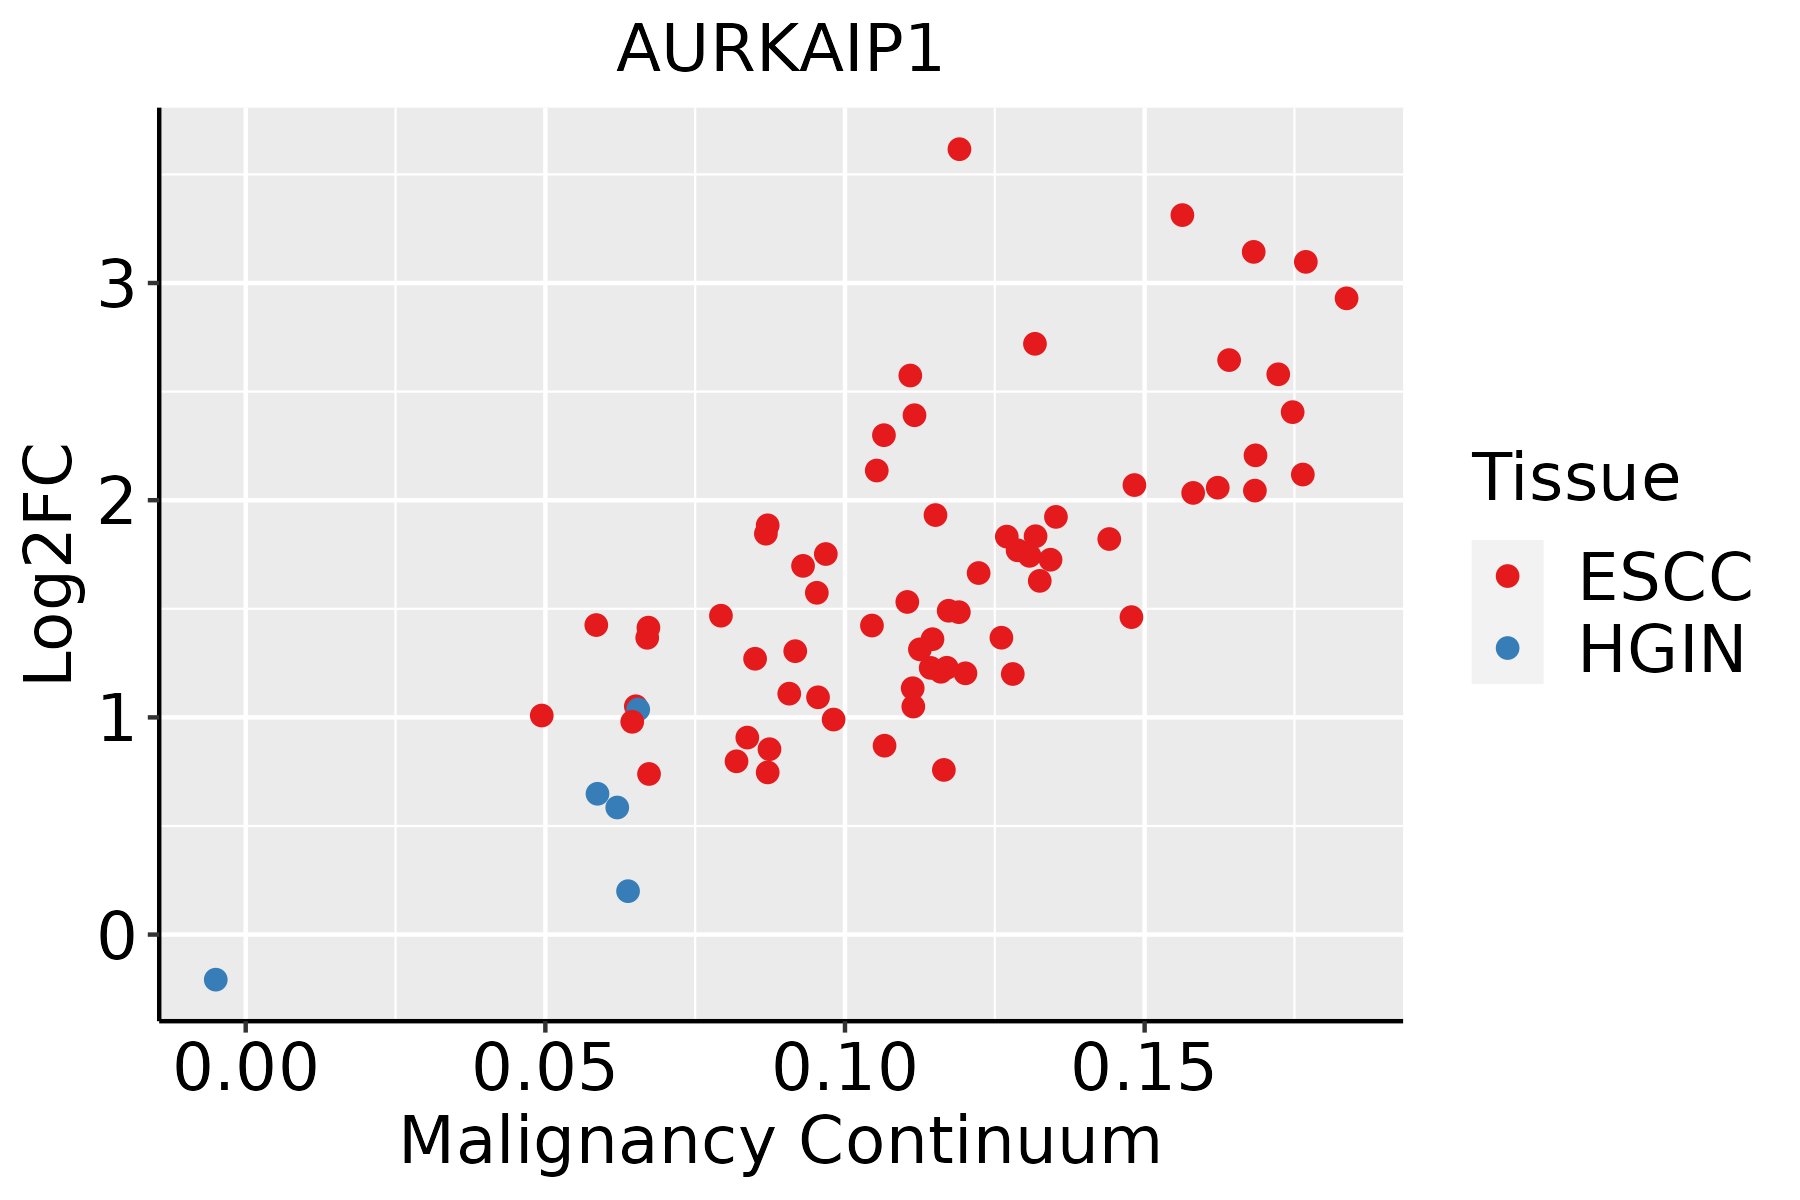 | ESCC: Esophageal squamous cell carcinoma |
| HGIN: High-grade intraepithelial neoplasias | ||
| LGIN: Low-grade intraepithelial neoplasias | ||
| GC | 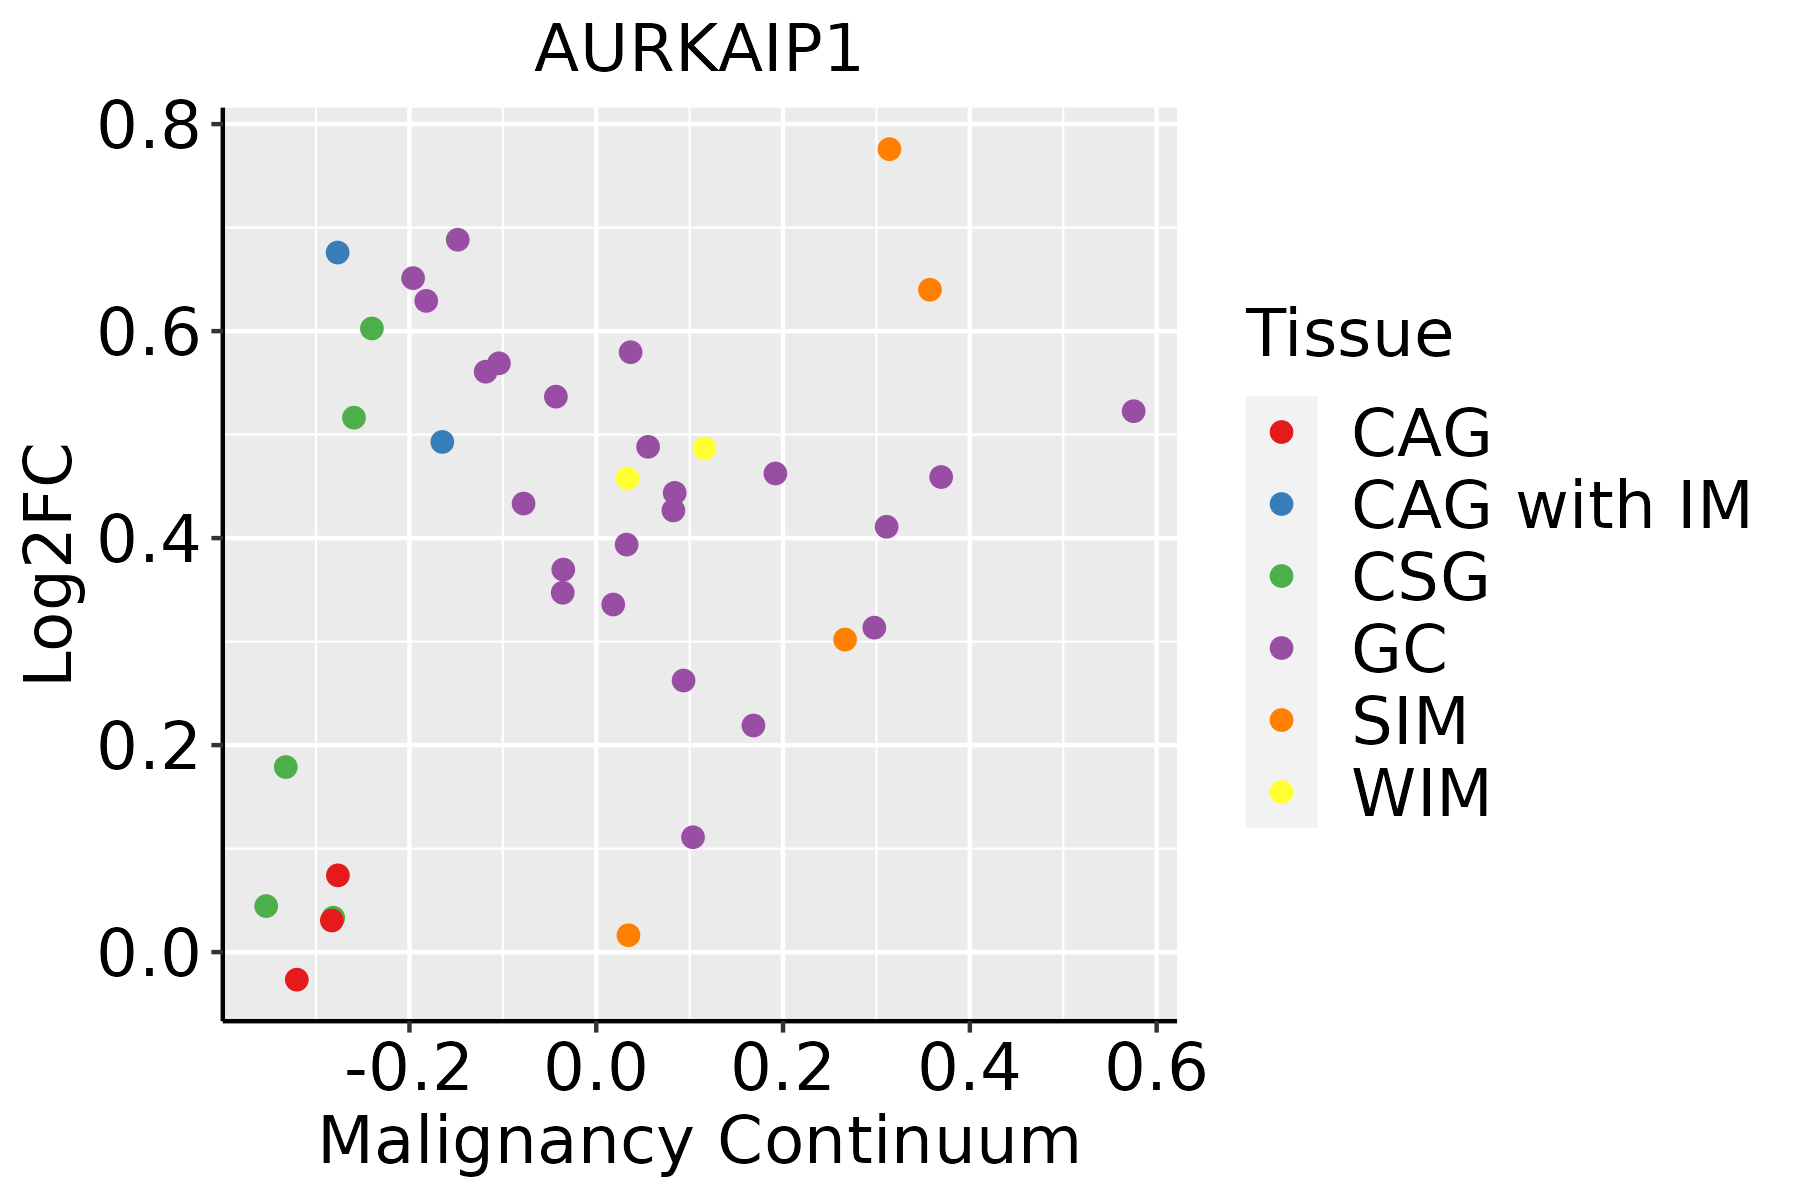 | CAG: Chronic atrophic gastritis |
| CAG with IM: Chronic atrophic gastritis with intestinal metaplasia | ||
| CSG: Chronic superficial gastritis | ||
| GC: Gastric cancer | ||
| SIM: Severe intestinal metaplasia | ||
| WIM: Wild intestinal metaplasia | ||
| Liver | 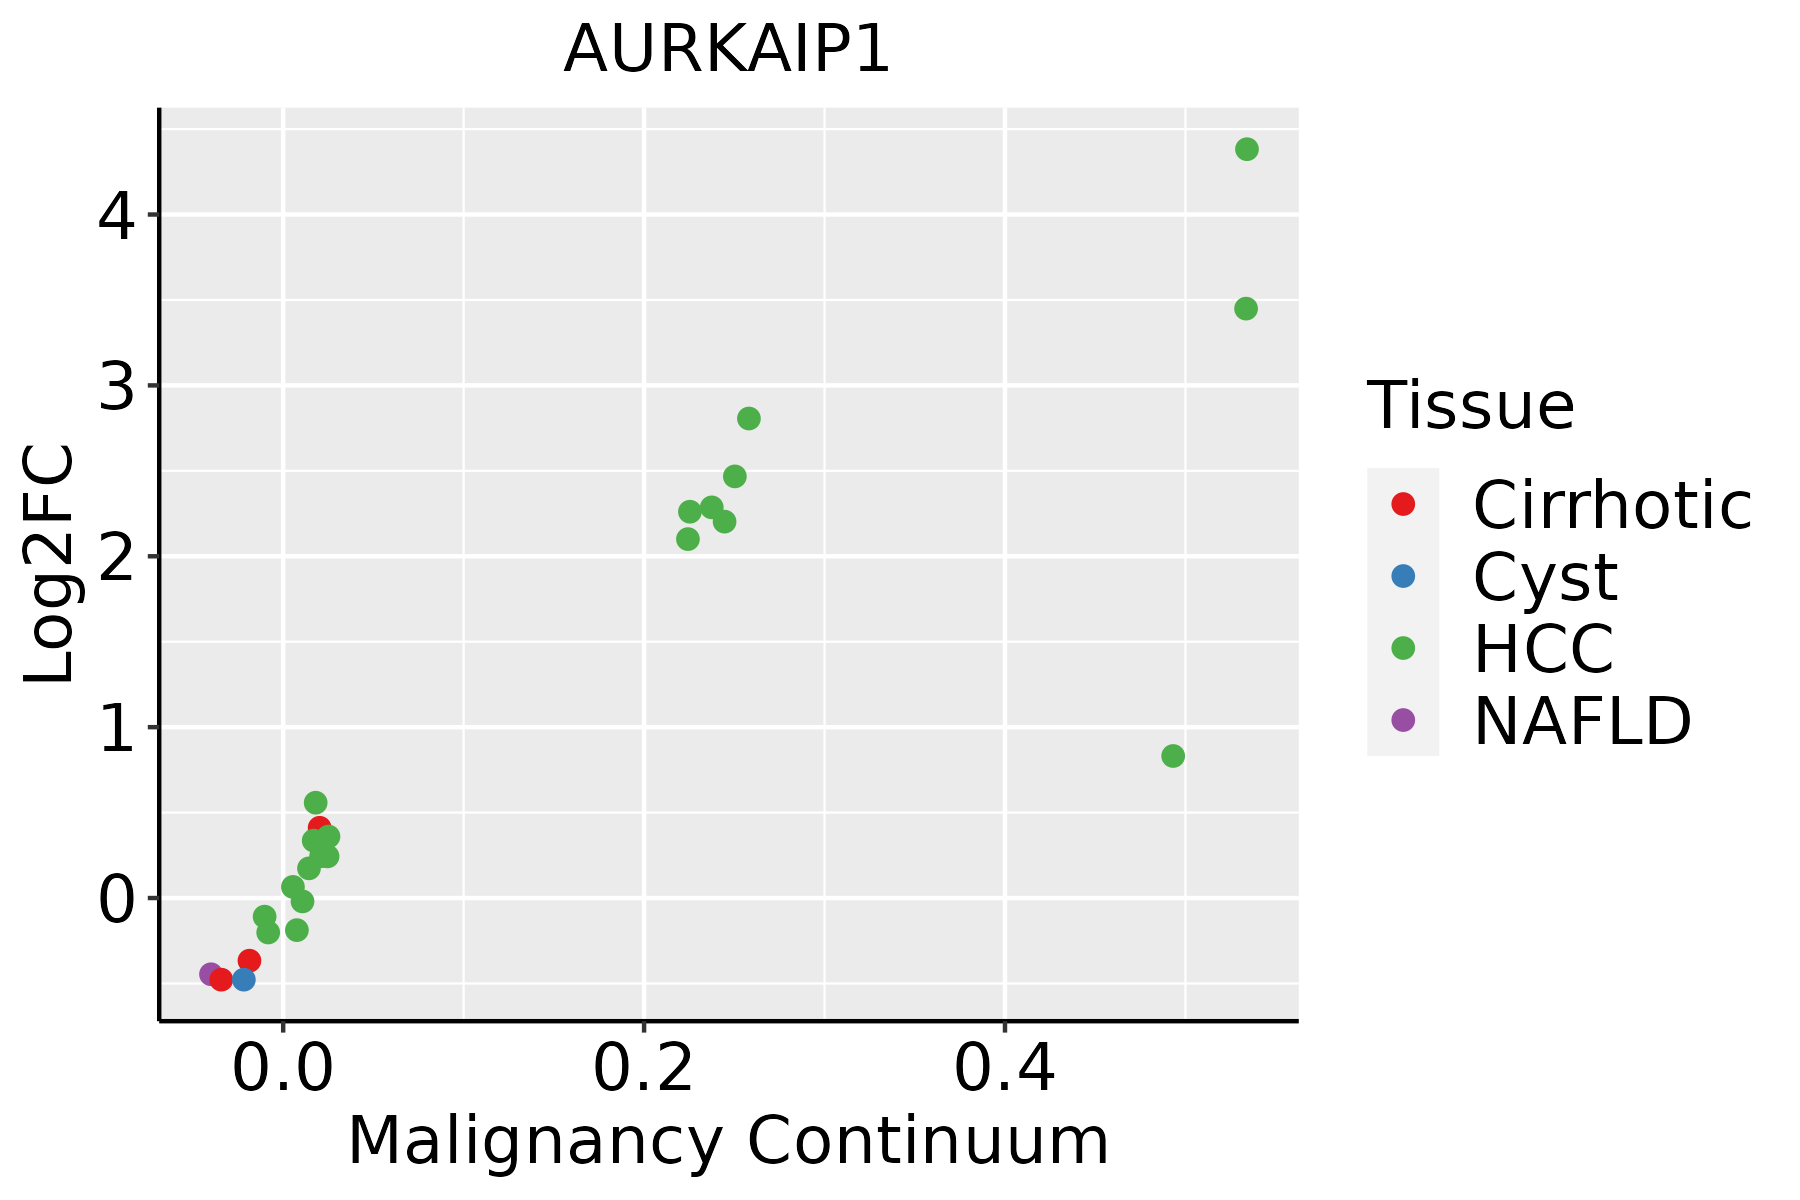 | HCC: Hepatocellular carcinoma |
| NAFLD: Non-alcoholic fatty liver disease | ||
| Oral Cavity | 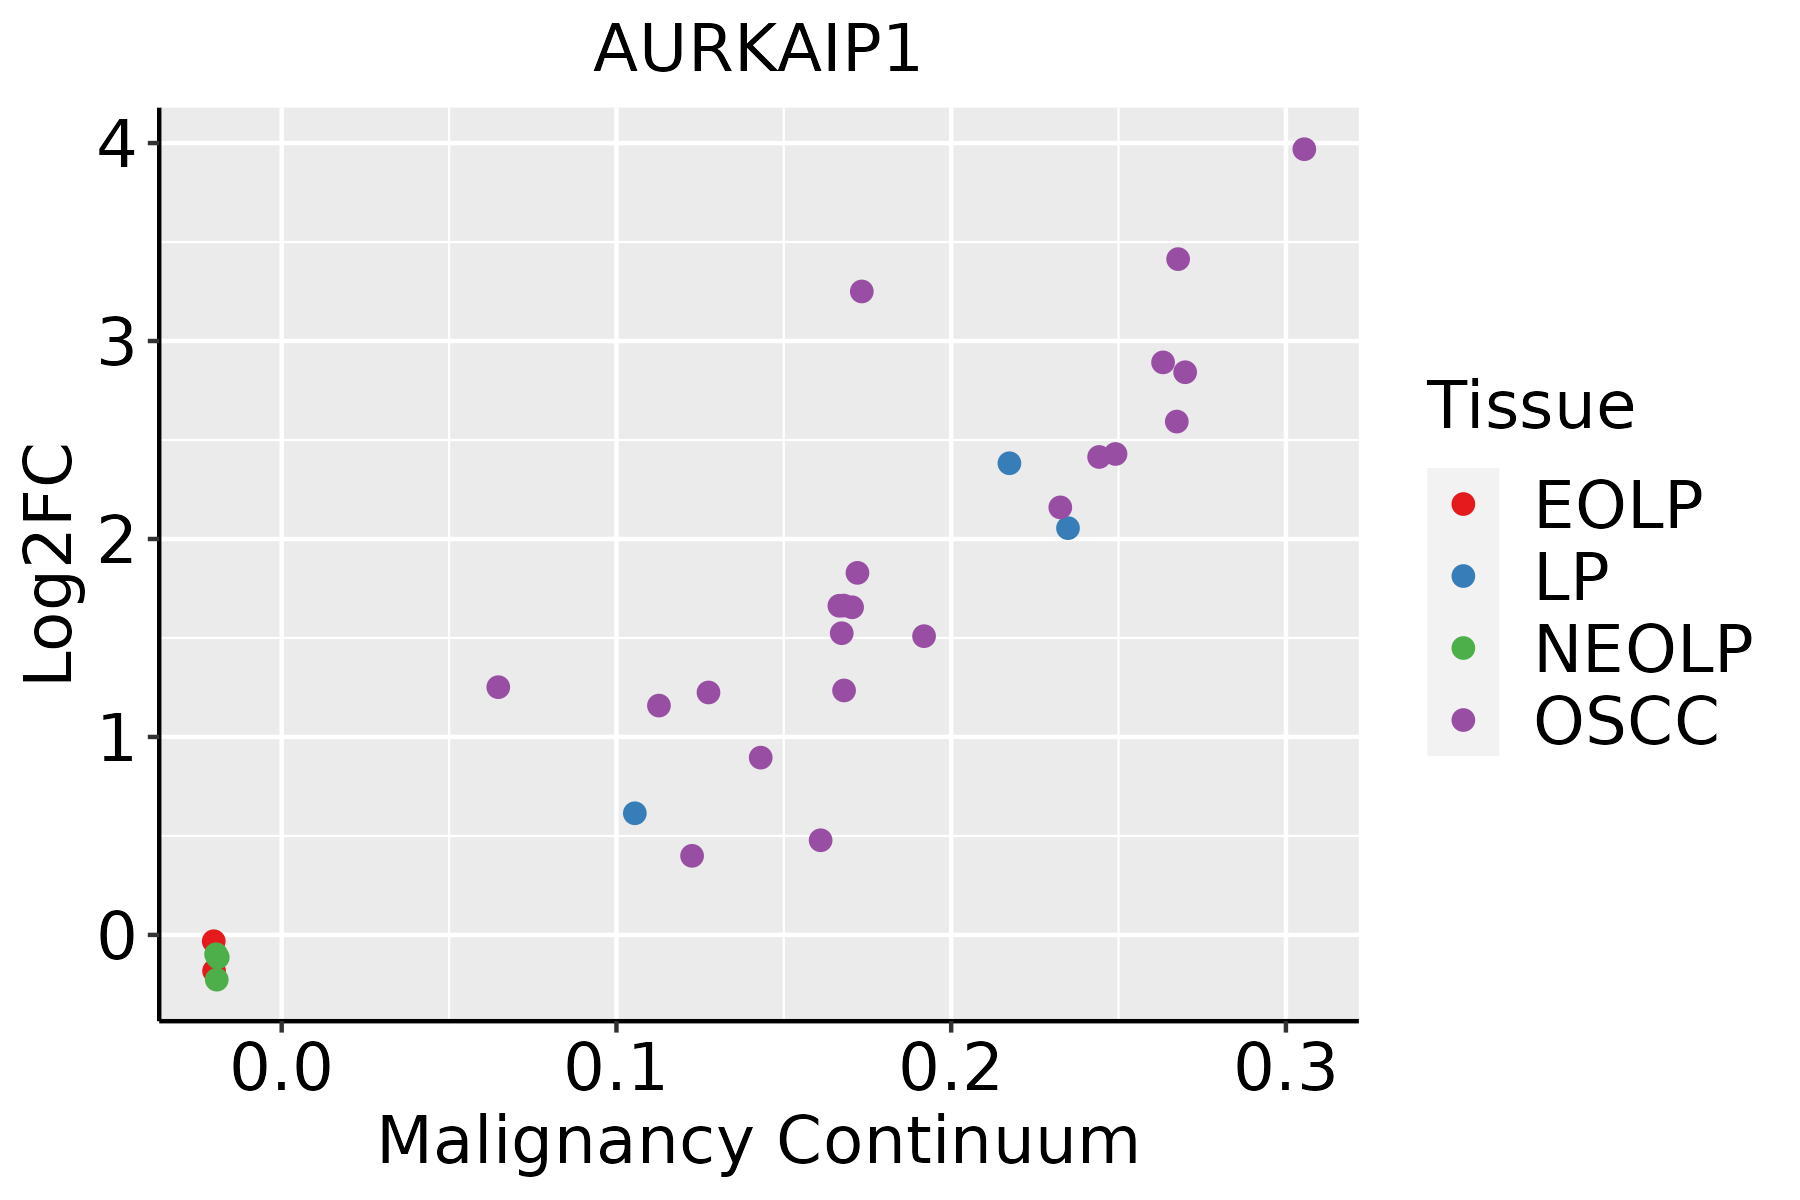 | EOLP: Erosive Oral lichen planus |
| LP: leukoplakia | ||
| NEOLP: Non-erosive oral lichen planus | ||
| OSCC: Oral squamous cell carcinoma | ||
| Prostate | 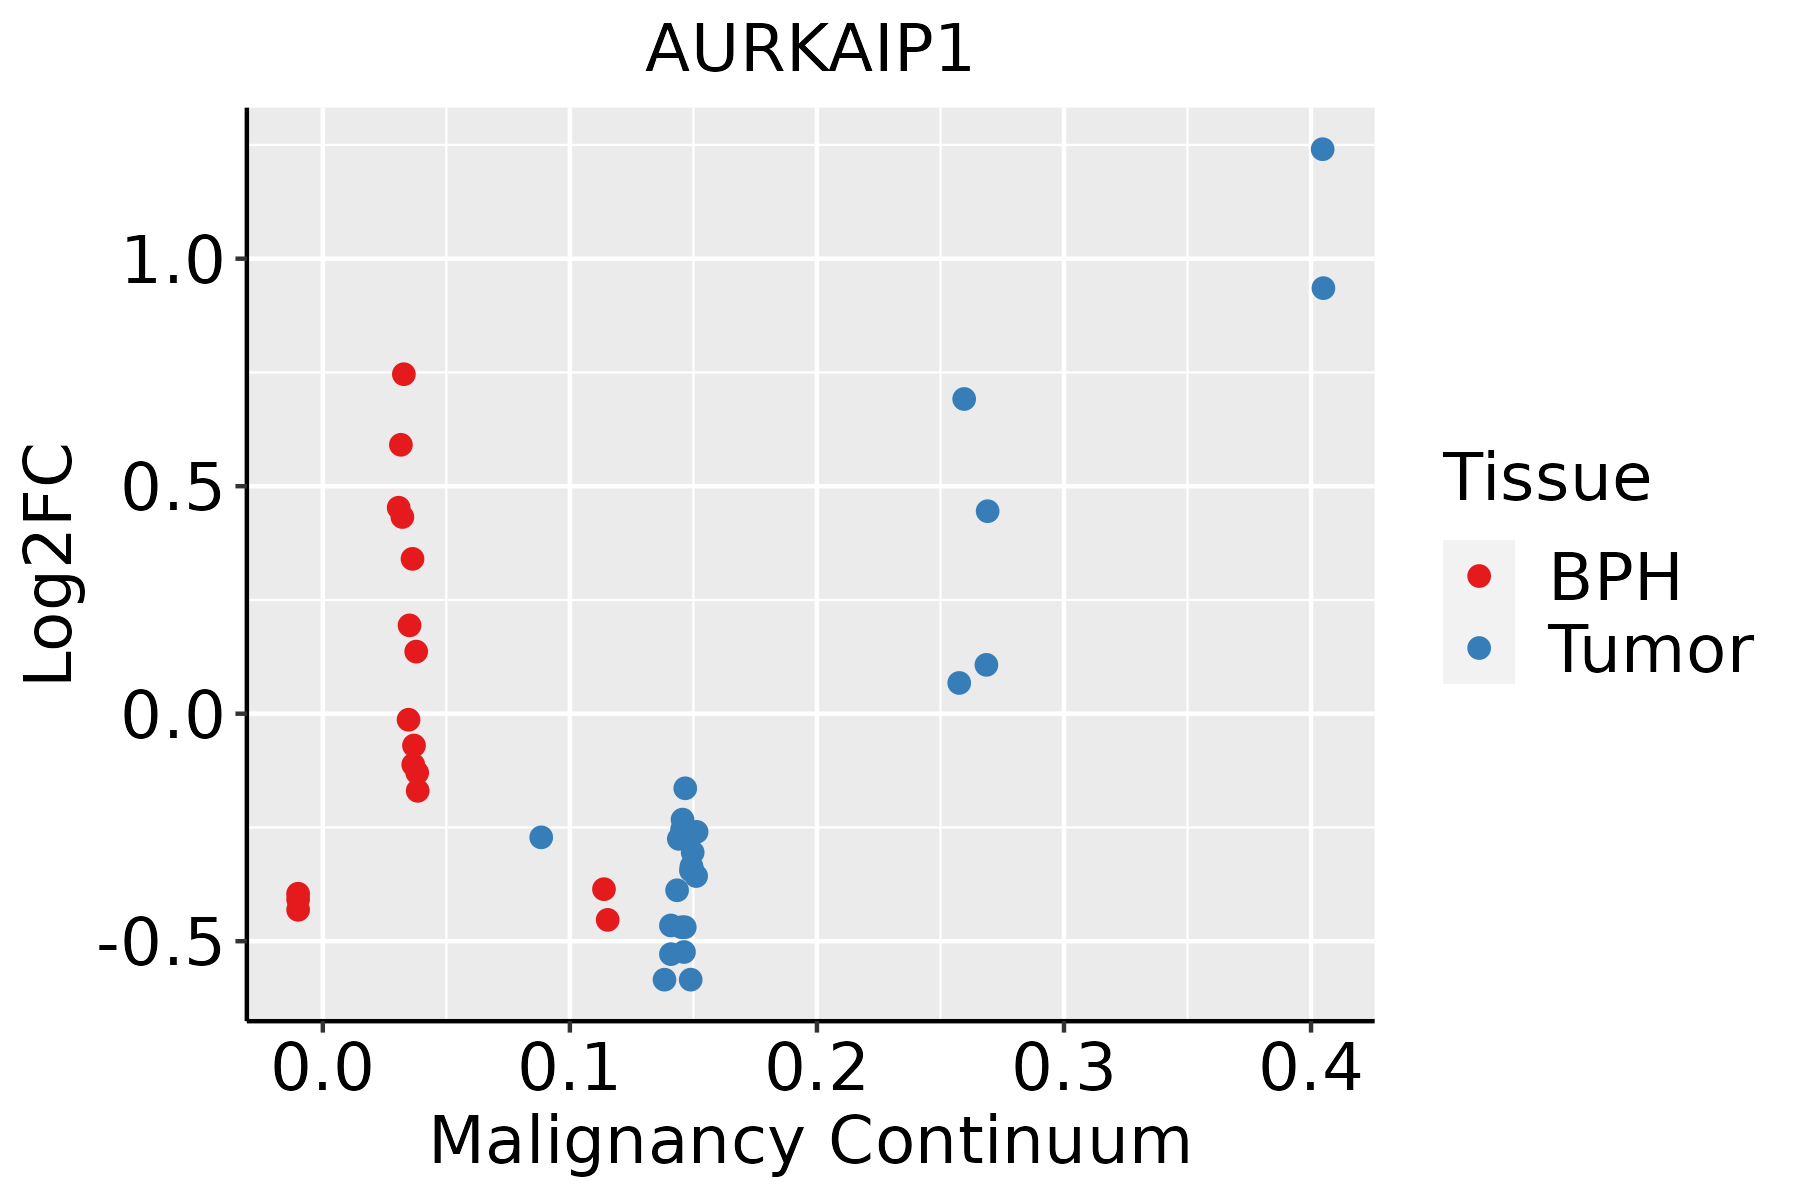 | BPH: Benign Prostatic Hyperplasia |
| Skin | 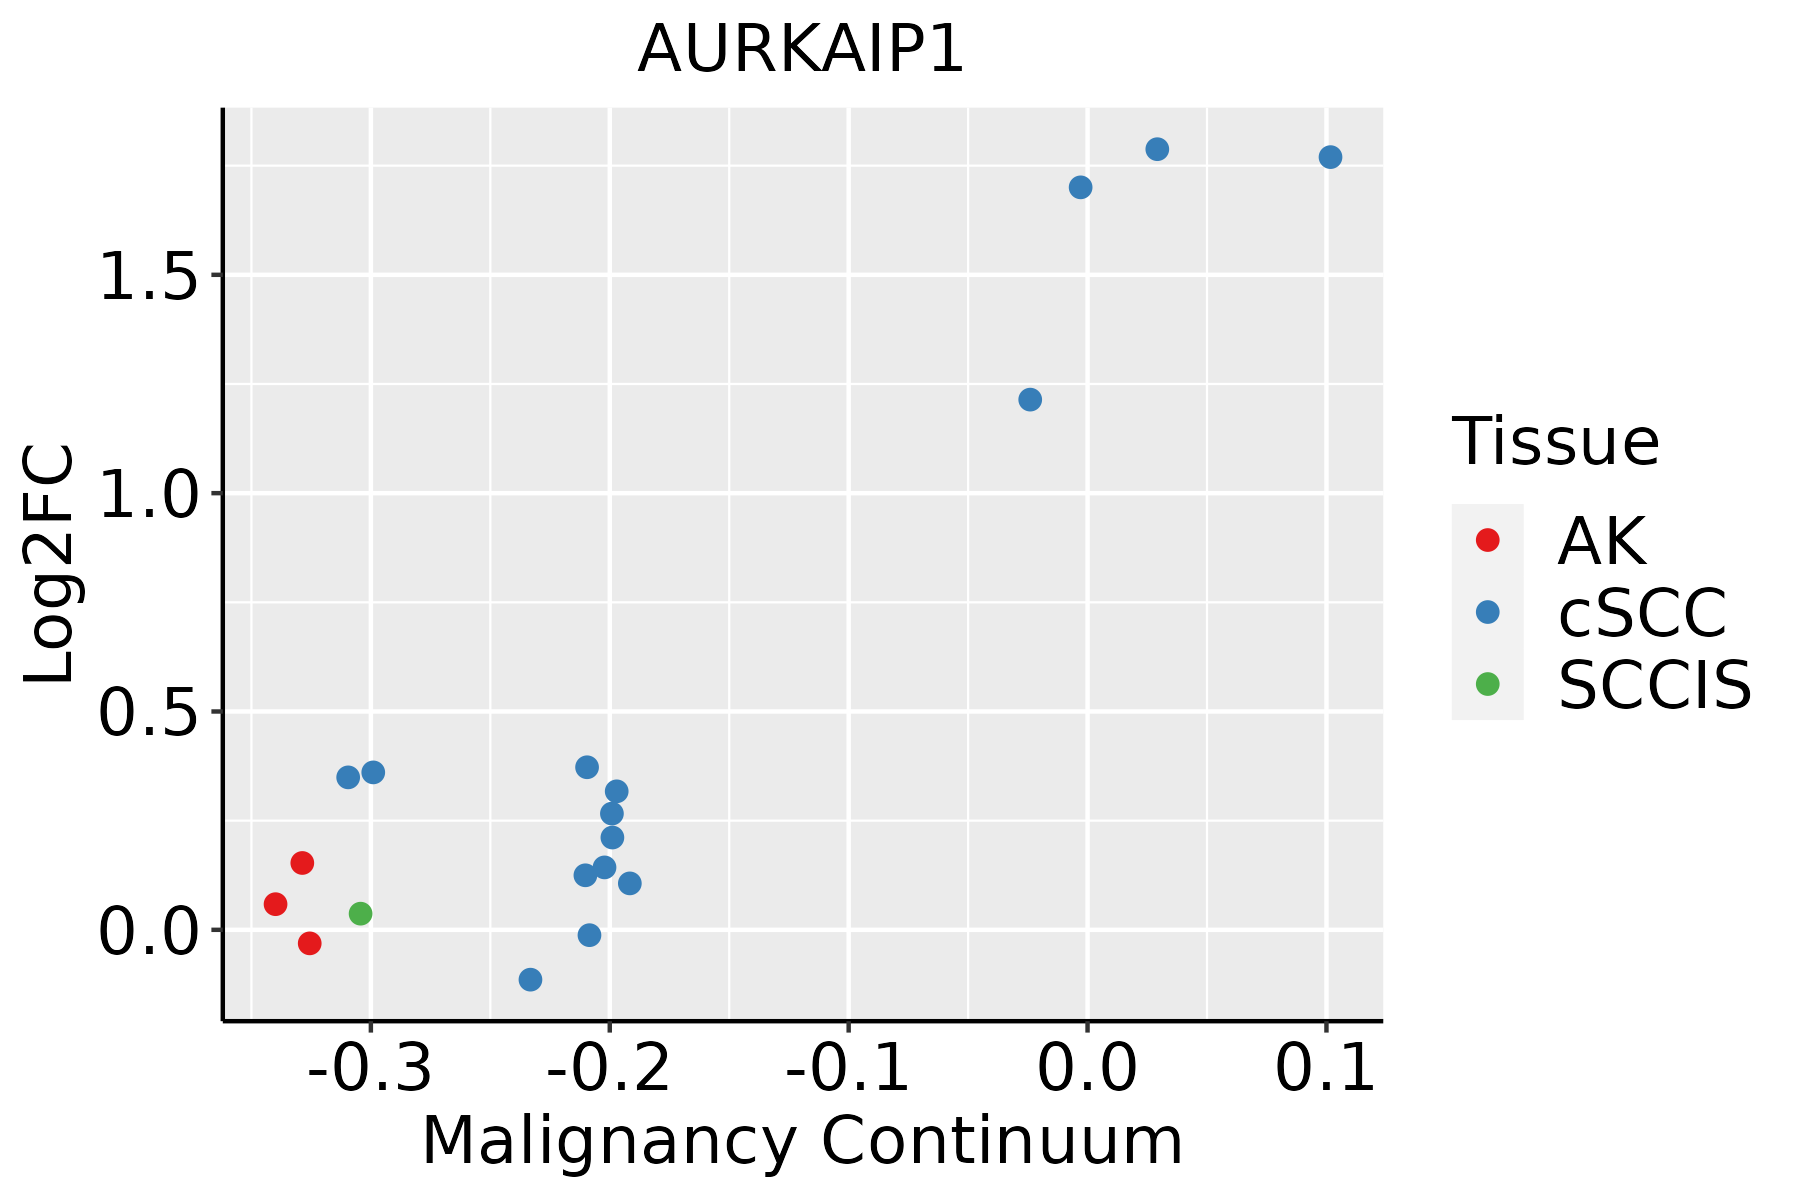 | AK: Actinic keratosis |
| cSCC: Cutaneous squamous cell carcinoma | ||
| SCCIS:squamous cell carcinoma in situ | ||
| Thyroid |  | ATC: Anaplastic thyroid cancer |
| HT: Hashimoto's thyroiditis | ||
| PTC: Papillary thyroid cancer |
| ∗log2FC in expression of this searched gene in stem-like cells from each diseased tissue sample relative to stem-like cells in normal samples in each tissue plotted against the malignancy continuum. Samples are colored based on if they are from different disease stage. |
Top |
Malignant transformation related pathway analysis |
| Find out the enriched GO biological processes and KEGG pathways involved in transition from healthy to precancer to cancer |
| Tissue | Disease Stage | Enriched GO biological Processes |
| Colorectum | AD |  |
| Colorectum | SER |  |
| Colorectum | MSS |  |
| Colorectum | MSI-H |  |
| Colorectum | FAP |  |
| ∗Top 15 enriched GO BP terms are showed in the bar plot of each disease state in each tissue. Each row represents a significant GO biological process which is colored according to the -log10(p.adjust). |
| Page: 1 2 3 4 5 6 7 8 9 |
| GO ID | Tissue | Disease Stage | Description | Gene Ratio | Bg Ratio | pvalue | p.adjust | Count |
| GO:00458629 | Breast | Precancer | positive regulation of proteolysis | 51/1080 | 372/18723 | 7.77e-09 | 5.70e-07 | 51 |
| GO:004586214 | Breast | IDC | positive regulation of proteolysis | 66/1434 | 372/18723 | 9.76e-11 | 1.29e-08 | 66 |
| GO:00073465 | Breast | IDC | regulation of mitotic cell cycle | 51/1434 | 457/18723 | 4.30e-03 | 3.35e-02 | 51 |
| GO:004586224 | Breast | DCIS | positive regulation of proteolysis | 65/1390 | 372/18723 | 7.13e-11 | 9.17e-09 | 65 |
| GO:000734612 | Breast | DCIS | regulation of mitotic cell cycle | 52/1390 | 457/18723 | 1.38e-03 | 1.43e-02 | 52 |
| GO:004586210 | Cervix | CC | positive regulation of proteolysis | 95/2311 | 372/18723 | 1.84e-12 | 6.86e-10 | 95 |
| GO:00073466 | Cervix | CC | regulation of mitotic cell cycle | 88/2311 | 457/18723 | 1.26e-05 | 2.60e-04 | 88 |
| GO:00106399 | Cervix | CC | negative regulation of organelle organization | 68/2311 | 348/18723 | 7.40e-05 | 1.03e-03 | 68 |
| GO:00457862 | Cervix | CC | negative regulation of cell cycle | 67/2311 | 385/18723 | 2.21e-03 | 1.59e-02 | 67 |
| GO:00459302 | Cervix | CC | negative regulation of mitotic cell cycle | 44/2311 | 235/18723 | 3.02e-03 | 1.99e-02 | 44 |
| GO:01400143 | Cervix | CC | mitotic nuclear division | 50/2311 | 287/18723 | 7.27e-03 | 3.91e-02 | 50 |
| GO:00109482 | Cervix | CC | negative regulation of cell cycle process | 51/2311 | 294/18723 | 7.35e-03 | 3.94e-02 | 51 |
| GO:00482851 | Cervix | CC | organelle fission | 78/2311 | 488/18723 | 9.70e-03 | 4.79e-02 | 78 |
| GO:004586225 | Cervix | N_HPV | positive regulation of proteolysis | 29/534 | 372/18723 | 1.08e-06 | 5.80e-05 | 29 |
| GO:001063914 | Cervix | N_HPV | negative regulation of organelle organization | 21/534 | 348/18723 | 1.08e-03 | 1.25e-02 | 21 |
| GO:0045862 | Colorectum | AD | positive regulation of proteolysis | 129/3918 | 372/18723 | 4.04e-10 | 3.46e-08 | 129 |
| GO:0010639 | Colorectum | AD | negative regulation of organelle organization | 114/3918 | 348/18723 | 1.41e-07 | 6.49e-06 | 114 |
| GO:0007346 | Colorectum | AD | regulation of mitotic cell cycle | 119/3918 | 457/18723 | 4.60e-03 | 3.14e-02 | 119 |
| GO:0140014 | Colorectum | AD | mitotic nuclear division | 78/3918 | 287/18723 | 6.48e-03 | 4.05e-02 | 78 |
| GO:00458621 | Colorectum | SER | positive regulation of proteolysis | 106/2897 | 372/18723 | 8.40e-11 | 1.20e-08 | 106 |
| Page: 1 2 3 4 5 6 7 8 |
| Pathway ID | Tissue | Disease Stage | Description | Gene Ratio | Bg Ratio | pvalue | p.adjust | qvalue | Count |
| Page: 1 |
Top |
Cell-cell communication analysis |
| Identification of potential cell-cell interactions between two cell types and their ligand-receptor pairs for different disease states |
| Ligand | Receptor | LRpair | Pathway | Tissue | Disease Stage |
| Page: 1 |
Top |
Single-cell gene regulatory network inference analysis |
| Find out the significant the regulons (TFs) and the target genes of each regulon across cell types for different disease states |
| TF | Cell Type | Tissue | Disease Stage | Target Gene | RSS | Regulon Activity |
| ∗The dot plots of a searched regulon are shown for all cell subpopulations in each disease state of each tissue based on the regulon specific score inferred using pySCENIC and by calculating the average expression. |
| Page: 1 |
Top |
Somatic mutation of malignant transformation related genes |
| Annotation of somatic variants for genes involved in malignant transformation |
| Hugo Symbol | Variant Class | Variant Classification | dbSNP RS | HGVSc | HGVSp | HGVSp Short | SWISSPROT | BIOTYPE | SIFT | PolyPhen | Tumor Sample Barcode | Tissue | Histology | Sex | Age | Stage | Therapy Types | Drugs | Outcome |
| AURKAIP1 | SNV | Missense_Mutation | rs751926763 | c.451C>T | p.Arg151Trp | p.R151W | Q9NWT8 | protein_coding | deleterious(0.03) | probably_damaging(0.999) | TCGA-A7-A3IZ-01 | Breast | breast invasive carcinoma | Female | <65 | I/II | Chemotherapy | cytoxan | SD |
| AURKAIP1 | SNV | Missense_Mutation | novel | c.10N>C | p.Gly4Arg | p.G4R | Q9NWT8 | protein_coding | tolerated(0.34) | benign(0.018) | TCGA-C8-A3M8-01 | Breast | breast invasive carcinoma | Female | >=65 | I/II | Hormone Therapy | tamoxiphen | CR |
| AURKAIP1 | SNV | Missense_Mutation | novel | c.376N>G | p.Gln126Glu | p.Q126E | Q9NWT8 | protein_coding | tolerated(0.24) | possibly_damaging(0.446) | TCGA-C5-A1MH-01 | Cervix | cervical & endocervical cancer | Female | >=65 | III/IV | Chemotherapy | cisplatin | PD |
| AURKAIP1 | SNV | Missense_Mutation | novel | c.502A>C | p.Lys168Gln | p.K168Q | Q9NWT8 | protein_coding | deleterious(0.04) | benign(0.444) | TCGA-AG-3892-01 | Colorectum | rectum adenocarcinoma | Female | <65 | I/II | Unknown | Unknown | SD |
| AURKAIP1 | SNV | Missense_Mutation | rs753960121 | c.559N>A | p.Glu187Lys | p.E187K | Q9NWT8 | protein_coding | tolerated(0.35) | benign(0.005) | TCGA-A5-A0G2-01 | Endometrium | uterine corpus endometrioid carcinoma | Female | <65 | III/IV | Unknown | Unknown | SD |
| AURKAIP1 | SNV | Missense_Mutation | c.482N>T | p.Arg161Leu | p.R161L | Q9NWT8 | protein_coding | deleterious(0) | probably_damaging(0.999) | TCGA-49-AARN-01 | Lung | lung adenocarcinoma | Female | <65 | I/II | Unknown | Unknown | SD | |
| AURKAIP1 | deletion | Frame_Shift_Del | novel | c.145_152delGCCTCTCT | p.Ala49ProfsTer66 | p.A49Pfs*66 | Q9NWT8 | protein_coding | TCGA-85-8287-01 | Lung | lung squamous cell carcinoma | Male | >=65 | I/II | Unknown | Unknown | SD | ||
| AURKAIP1 | SNV | Missense_Mutation | novel | c.77N>G | p.Ser26Cys | p.S26C | Q9NWT8 | protein_coding | deleterious(0.05) | possibly_damaging(0.533) | TCGA-T2-A6WZ-01 | Oral cavity | head & neck squamous cell carcinoma | Male | <65 | III/IV | Chemotherapy | cetuximab | PD |
| AURKAIP1 | SNV | Missense_Mutation | c.209C>G | p.Ser70Cys | p.S70C | Q9NWT8 | protein_coding | deleterious(0.01) | benign(0.003) | TCGA-J9-A52E-01 | Prostate | prostate adenocarcinoma | Male | >=65 | 9 | Hormone Therapy | zoladex | SD | |
| AURKAIP1 | SNV | Missense_Mutation | novel | c.208T>G | p.Ser70Ala | p.S70A | Q9NWT8 | protein_coding | tolerated(0.22) | benign(0.001) | TCGA-XJ-A83F-01 | Prostate | prostate adenocarcinoma | Male | >=65 | 7 | Unknown | Unknown | SD |
| Page: 1 2 |
Top |
Related drugs of malignant transformation related genes |
| Identification of chemicals and drugs interact with genes involved in malignant transfromation |
| (DGIdb 4.0) |
| Entrez ID | Symbol | Category | Interaction Types | Drug Claim Name | Drug Name | PMIDs |
| Page: 1 |

Copyright 2023-Present -The University of Texas Health Science Center at Houston |