
|
|||||
|
 | |
| |
| |
| |
| |
| |
|
Gene: AUH |
Gene summary for AUH |
| Gene information | Species | Human | Gene symbol | AUH | Gene ID | 549 |
| Gene name | AU RNA binding methylglutaconyl-CoA hydratase | |
| Gene Alias | AUH | |
| Cytomap | 9q22.31 | |
| Gene Type | protein-coding | GO ID | GO:0006082 | UniProtAcc | Q13825 |
Top |
Malignant transformation analysis |
| Identification of the aberrant gene expression in precancerous and cancerous lesions by comparing the gene expression of stem-like cells in diseased tissues with normal stem cells |
| Entrez ID | Symbol | Replicates | Species | Organ | Tissue | Adj P-value | Log2FC | Malignancy |
| 549 | AUH | CCI_2 | Human | Cervix | CC | 1.44e-11 | 1.19e+00 | 0.5249 |
| 549 | AUH | CCI_3 | Human | Cervix | CC | 8.65e-20 | 1.05e+00 | 0.516 |
| 549 | AUH | HTA11_3410_2000001011 | Human | Colorectum | AD | 5.61e-11 | -5.27e-01 | 0.0155 |
| 549 | AUH | HTA11_3361_2000001011 | Human | Colorectum | AD | 2.31e-03 | -5.02e-01 | -0.1207 |
| 549 | AUH | HTA11_696_2000001011 | Human | Colorectum | AD | 5.05e-08 | -3.60e-01 | -0.1464 |
| 549 | AUH | HTA11_866_3004761011 | Human | Colorectum | AD | 1.18e-04 | -4.29e-01 | 0.096 |
| 549 | AUH | HTA11_10711_2000001011 | Human | Colorectum | AD | 1.17e-02 | -4.65e-01 | 0.0338 |
| 549 | AUH | HTA11_7696_3000711011 | Human | Colorectum | AD | 5.71e-06 | -3.54e-01 | 0.0674 |
| 549 | AUH | HTA11_99999973899_84307 | Human | Colorectum | MSS | 1.00e-03 | -5.89e-01 | 0.2585 |
| 549 | AUH | HTA11_99999974143_84620 | Human | Colorectum | MSS | 1.38e-07 | -4.33e-01 | 0.3005 |
| 549 | AUH | A015-C-203 | Human | Colorectum | FAP | 6.55e-24 | -2.53e-01 | -0.1294 |
| 549 | AUH | A015-C-204 | Human | Colorectum | FAP | 1.27e-05 | -1.84e-01 | -0.0228 |
| 549 | AUH | A014-C-040 | Human | Colorectum | FAP | 1.97e-03 | -3.59e-01 | -0.1184 |
| 549 | AUH | A002-C-201 | Human | Colorectum | FAP | 1.05e-11 | -2.48e-01 | 0.0324 |
| 549 | AUH | A002-C-203 | Human | Colorectum | FAP | 1.34e-03 | -1.53e-02 | 0.2786 |
| 549 | AUH | A001-C-119 | Human | Colorectum | FAP | 4.93e-03 | -2.38e-01 | -0.1557 |
| 549 | AUH | A001-C-108 | Human | Colorectum | FAP | 5.92e-14 | -8.45e-02 | -0.0272 |
| 549 | AUH | A002-C-205 | Human | Colorectum | FAP | 1.50e-19 | -3.37e-01 | -0.1236 |
| 549 | AUH | A001-C-104 | Human | Colorectum | FAP | 1.46e-03 | 5.25e-03 | 0.0184 |
| 549 | AUH | A015-C-005 | Human | Colorectum | FAP | 4.27e-02 | -1.97e-01 | -0.0336 |
| Page: 1 2 3 4 5 6 |
| Tissue | Expression Dynamics | Abbreviation |
| Cervix |  | CC: Cervix cancer |
| HSIL_HPV: HPV-infected high-grade squamous intraepithelial lesions | ||
| N_HPV: HPV-infected normal cervix | ||
| Colorectum (GSE201348) |  | FAP: Familial adenomatous polyposis |
| CRC: Colorectal cancer | ||
| Colorectum (HTA11) |  | AD: Adenomas |
| SER: Sessile serrated lesions | ||
| MSI-H: Microsatellite-high colorectal cancer | ||
| MSS: Microsatellite stable colorectal cancer | ||
| Esophagus | 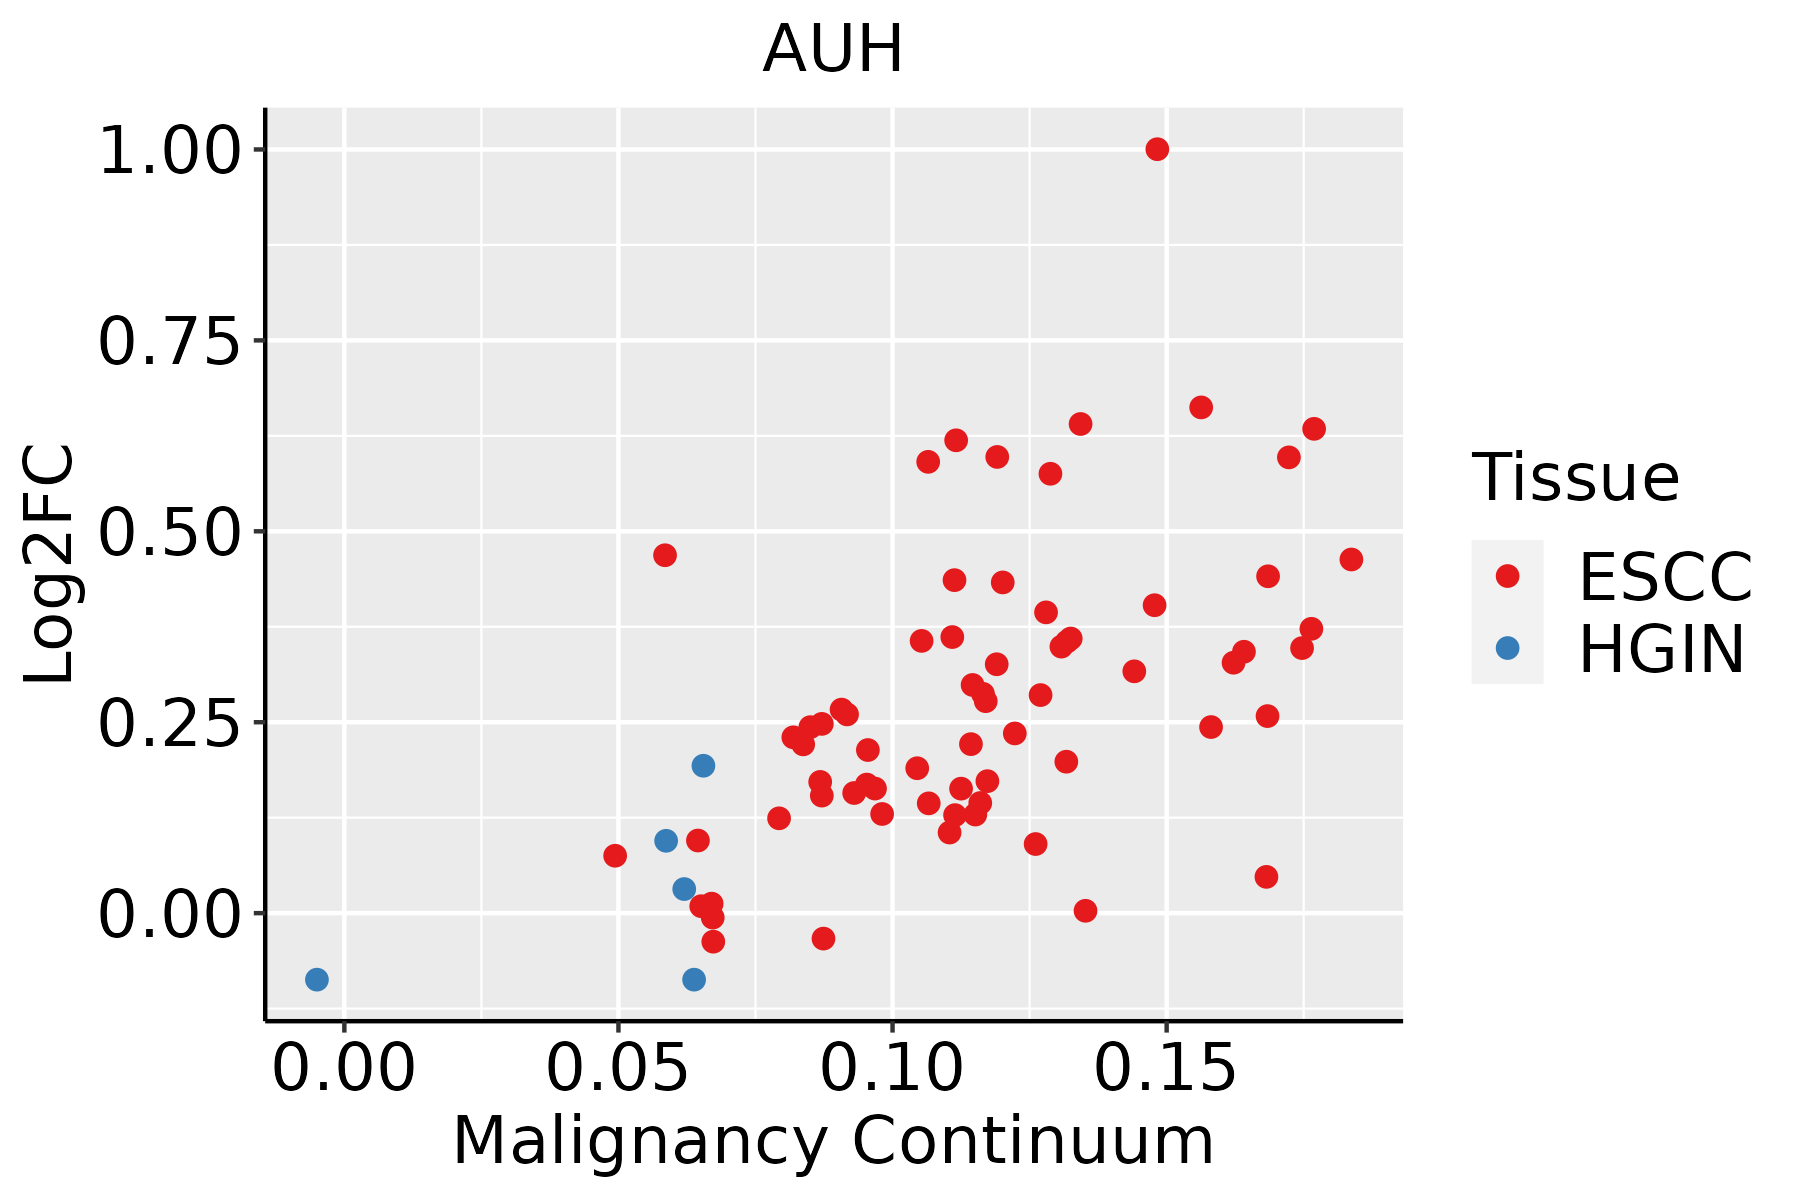 | ESCC: Esophageal squamous cell carcinoma |
| HGIN: High-grade intraepithelial neoplasias | ||
| LGIN: Low-grade intraepithelial neoplasias | ||
| Liver | 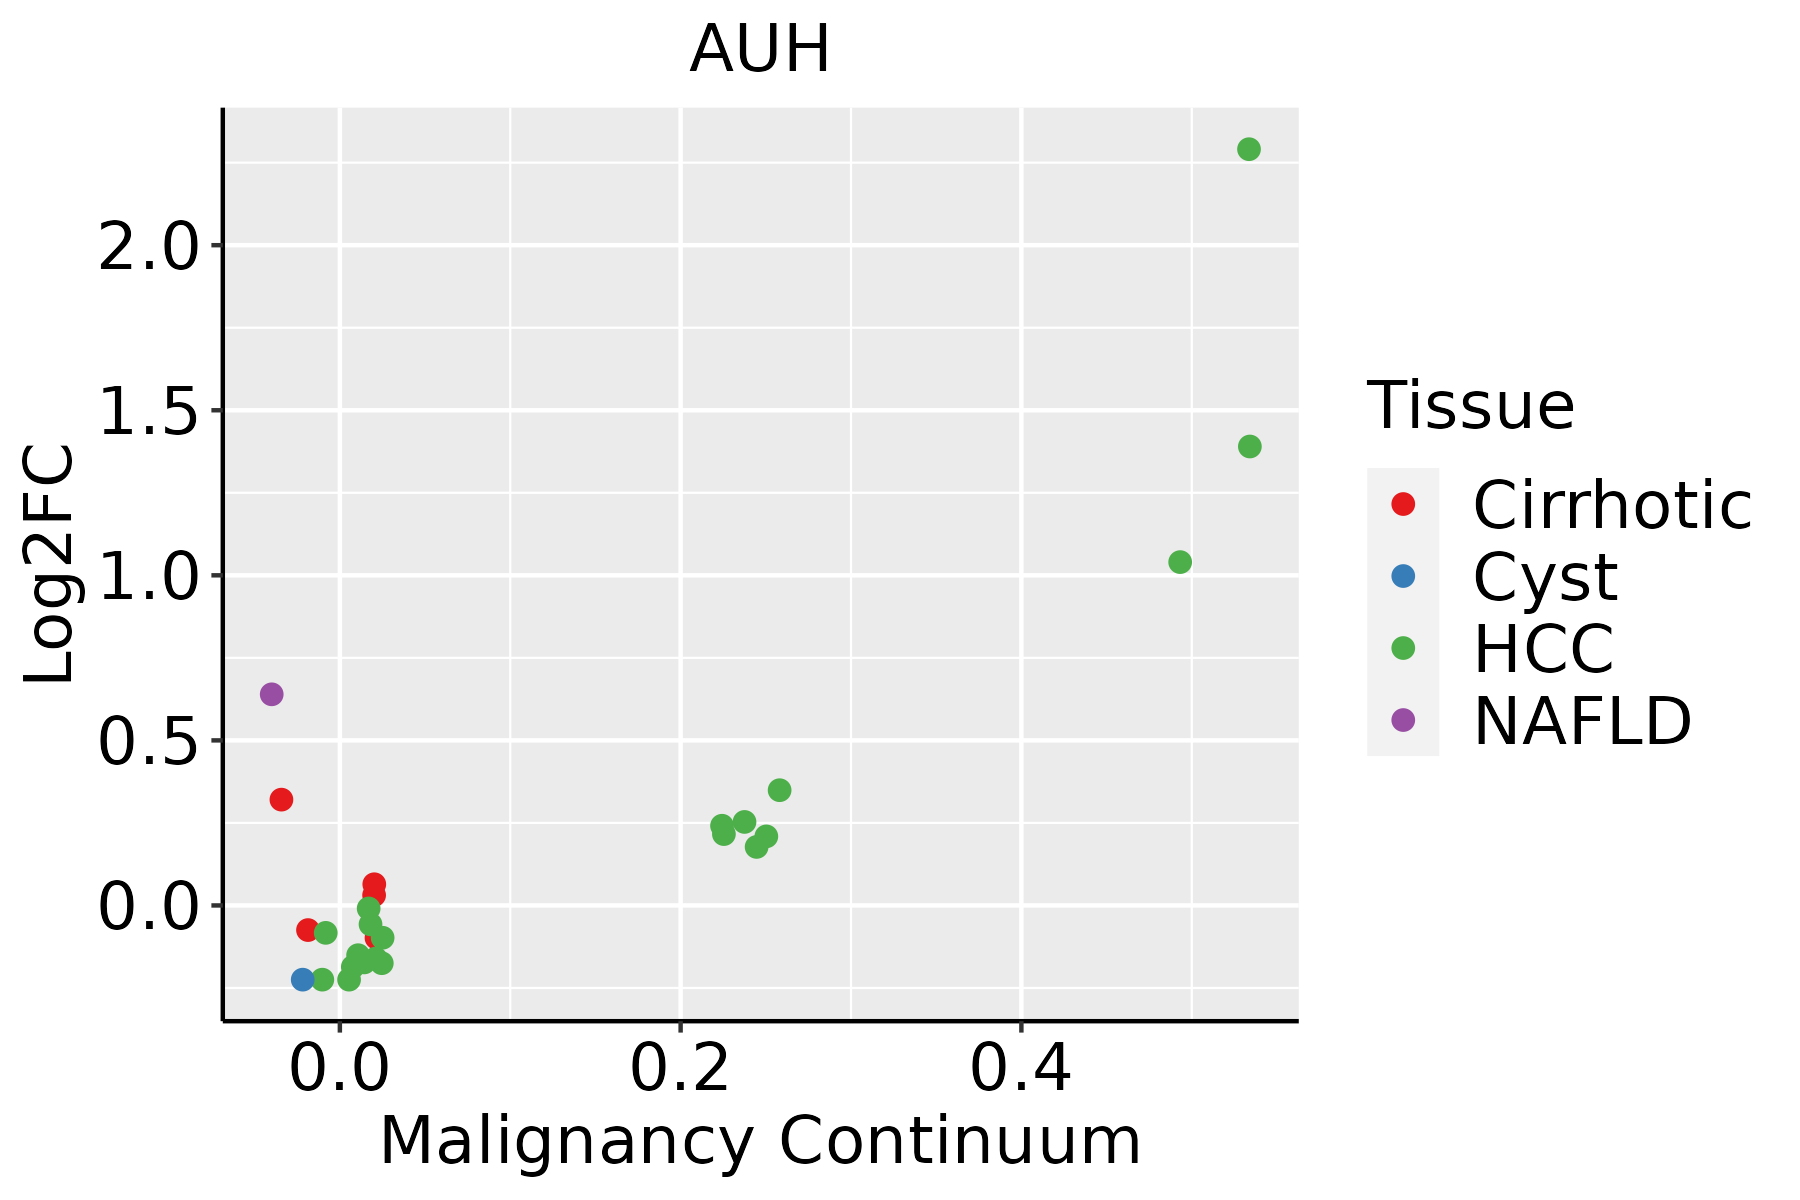 | HCC: Hepatocellular carcinoma |
| NAFLD: Non-alcoholic fatty liver disease | ||
| Prostate | 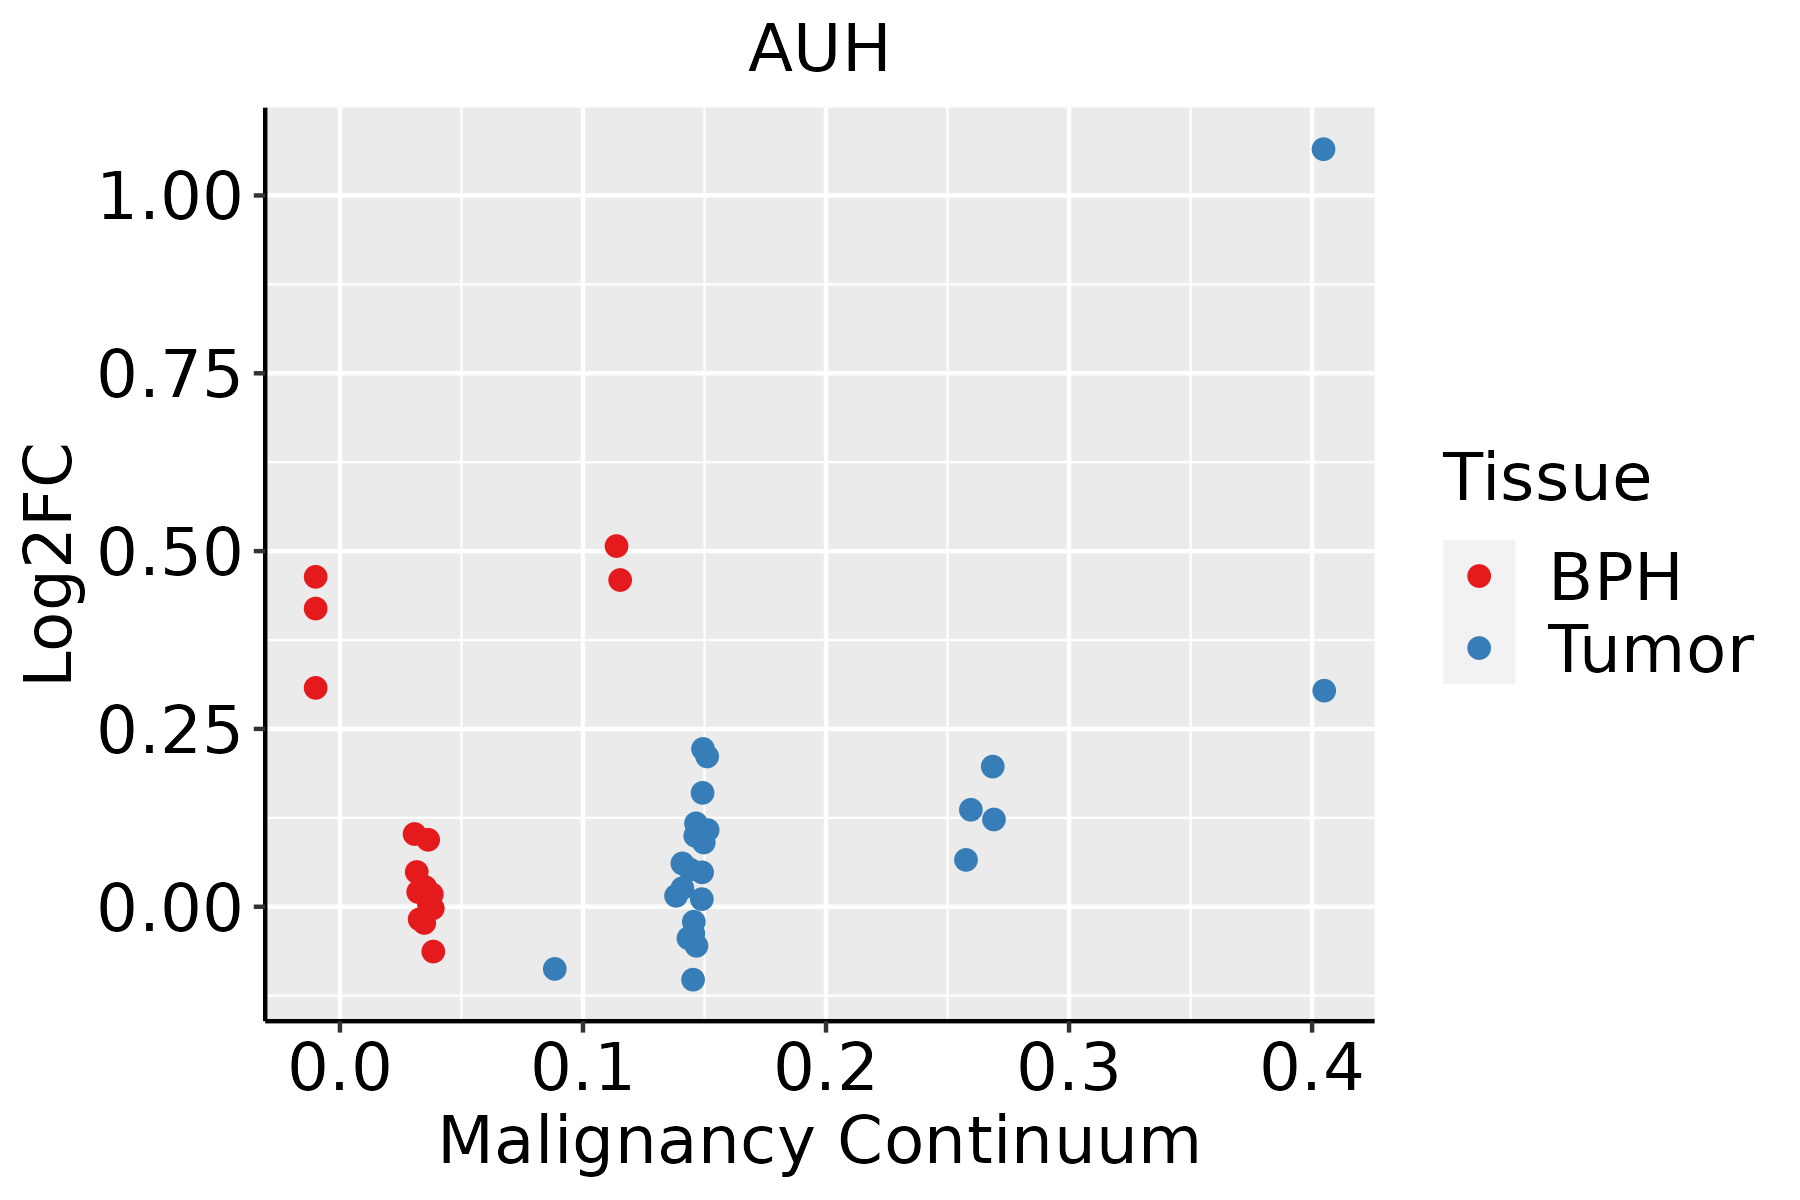 | BPH: Benign Prostatic Hyperplasia |
| ∗log2FC in expression of this searched gene in stem-like cells from each diseased tissue sample relative to stem-like cells in normal samples in each tissue plotted against the malignancy continuum. Samples are colored based on if they are from different disease stage. |
Top |
Malignant transformation related pathway analysis |
| Find out the enriched GO biological processes and KEGG pathways involved in transition from healthy to precancer to cancer |
| Tissue | Disease Stage | Enriched GO biological Processes |
| Colorectum | AD |  |
| Colorectum | SER |  |
| Colorectum | MSS |  |
| Colorectum | MSI-H |  |
| Colorectum | FAP |  |
| ∗Top 15 enriched GO BP terms are showed in the bar plot of each disease state in each tissue. Each row represents a significant GO biological process which is colored according to the -log10(p.adjust). |
| Page: 1 2 3 4 5 6 7 8 9 |
| GO ID | Tissue | Disease Stage | Description | Gene Ratio | Bg Ratio | pvalue | p.adjust | Count |
| GO:0044282 | Colorectum | AD | small molecule catabolic process | 118/3918 | 376/18723 | 1.05e-06 | 3.55e-05 | 118 |
| GO:0006635 | Colorectum | AD | fatty acid beta-oxidation | 33/3918 | 74/18723 | 3.98e-06 | 1.09e-04 | 33 |
| GO:0009062 | Colorectum | AD | fatty acid catabolic process | 41/3918 | 100/18723 | 4.02e-06 | 1.09e-04 | 41 |
| GO:0019395 | Colorectum | AD | fatty acid oxidation | 40/3918 | 103/18723 | 2.43e-05 | 4.69e-04 | 40 |
| GO:0016042 | Colorectum | AD | lipid catabolic process | 97/3918 | 320/18723 | 4.31e-05 | 7.56e-04 | 97 |
| GO:0006631 | Colorectum | AD | fatty acid metabolic process | 114/3918 | 390/18723 | 5.58e-05 | 9.44e-04 | 114 |
| GO:0072329 | Colorectum | AD | monocarboxylic acid catabolic process | 44/3918 | 122/18723 | 8.05e-05 | 1.28e-03 | 44 |
| GO:0034440 | Colorectum | AD | lipid oxidation | 40/3918 | 108/18723 | 8.52e-05 | 1.32e-03 | 40 |
| GO:0030258 | Colorectum | AD | lipid modification | 67/3918 | 212/18723 | 1.66e-04 | 2.27e-03 | 67 |
| GO:0009083 | Colorectum | AD | branched-chain amino acid catabolic process | 10/3918 | 15/18723 | 1.68e-04 | 2.29e-03 | 10 |
| GO:0016054 | Colorectum | AD | organic acid catabolic process | 73/3918 | 240/18723 | 3.20e-04 | 3.81e-03 | 73 |
| GO:0044242 | Colorectum | AD | cellular lipid catabolic process | 66/3918 | 214/18723 | 3.96e-04 | 4.50e-03 | 66 |
| GO:0046395 | Colorectum | AD | carboxylic acid catabolic process | 70/3918 | 236/18723 | 9.06e-04 | 8.71e-03 | 70 |
| GO:0006520 | Colorectum | AD | cellular amino acid metabolic process | 81/3918 | 284/18723 | 1.37e-03 | 1.19e-02 | 81 |
| GO:0009081 | Colorectum | AD | branched-chain amino acid metabolic process | 10/3918 | 19/18723 | 2.25e-03 | 1.77e-02 | 10 |
| GO:00090831 | Colorectum | MSS | branched-chain amino acid catabolic process | 10/3467 | 15/18723 | 5.64e-05 | 9.87e-04 | 10 |
| GO:00090622 | Colorectum | MSS | fatty acid catabolic process | 32/3467 | 100/18723 | 8.28e-04 | 8.67e-03 | 32 |
| GO:00090811 | Colorectum | MSS | branched-chain amino acid metabolic process | 10/3467 | 19/18723 | 8.39e-04 | 8.68e-03 | 10 |
| GO:00442822 | Colorectum | MSS | small molecule catabolic process | 94/3467 | 376/18723 | 9.85e-04 | 9.86e-03 | 94 |
| GO:00302582 | Colorectum | MSS | lipid modification | 57/3467 | 212/18723 | 1.64e-03 | 1.49e-02 | 57 |
| Page: 1 2 3 4 5 6 |
| Pathway ID | Tissue | Disease Stage | Description | Gene Ratio | Bg Ratio | pvalue | p.adjust | qvalue | Count |
| hsa00280 | Colorectum | AD | Valine, leucine and isoleucine degradation | 25/2092 | 48/8465 | 3.97e-05 | 3.41e-04 | 2.18e-04 | 25 |
| hsa002801 | Colorectum | AD | Valine, leucine and isoleucine degradation | 25/2092 | 48/8465 | 3.97e-05 | 3.41e-04 | 2.18e-04 | 25 |
| hsa002804 | Colorectum | FAP | Valine, leucine and isoleucine degradation | 18/1404 | 48/8465 | 3.94e-04 | 3.06e-03 | 1.86e-03 | 18 |
| hsa002805 | Colorectum | FAP | Valine, leucine and isoleucine degradation | 18/1404 | 48/8465 | 3.94e-04 | 3.06e-03 | 1.86e-03 | 18 |
| hsa002809 | Esophagus | ESCC | Valine, leucine and isoleucine degradation | 34/4205 | 48/8465 | 2.34e-03 | 6.54e-03 | 3.35e-03 | 34 |
| hsa0028014 | Esophagus | ESCC | Valine, leucine and isoleucine degradation | 34/4205 | 48/8465 | 2.34e-03 | 6.54e-03 | 3.35e-03 | 34 |
| hsa002806 | Liver | NAFLD | Valine, leucine and isoleucine degradation | 20/1043 | 48/8465 | 3.03e-07 | 1.65e-05 | 1.33e-05 | 20 |
| hsa0028011 | Liver | NAFLD | Valine, leucine and isoleucine degradation | 20/1043 | 48/8465 | 3.03e-07 | 1.65e-05 | 1.33e-05 | 20 |
| hsa0028021 | Liver | Cirrhotic | Valine, leucine and isoleucine degradation | 32/2530 | 48/8465 | 1.45e-07 | 2.02e-06 | 1.24e-06 | 32 |
| hsa0028031 | Liver | Cirrhotic | Valine, leucine and isoleucine degradation | 32/2530 | 48/8465 | 1.45e-07 | 2.02e-06 | 1.24e-06 | 32 |
| hsa0028041 | Liver | HCC | Valine, leucine and isoleucine degradation | 41/4020 | 48/8465 | 4.84e-08 | 7.05e-07 | 3.92e-07 | 41 |
| hsa0028051 | Liver | HCC | Valine, leucine and isoleucine degradation | 41/4020 | 48/8465 | 4.84e-08 | 7.05e-07 | 3.92e-07 | 41 |
| hsa002807 | Prostate | Tumor | Valine, leucine and isoleucine degradation | 20/1791 | 48/8465 | 1.03e-03 | 4.59e-03 | 2.84e-03 | 20 |
| hsa0028012 | Prostate | Tumor | Valine, leucine and isoleucine degradation | 20/1791 | 48/8465 | 1.03e-03 | 4.59e-03 | 2.84e-03 | 20 |
| Page: 1 |
Top |
Cell-cell communication analysis |
| Identification of potential cell-cell interactions between two cell types and their ligand-receptor pairs for different disease states |
| Ligand | Receptor | LRpair | Pathway | Tissue | Disease Stage |
| Page: 1 |
Top |
Single-cell gene regulatory network inference analysis |
| Find out the significant the regulons (TFs) and the target genes of each regulon across cell types for different disease states |
| TF | Cell Type | Tissue | Disease Stage | Target Gene | RSS | Regulon Activity |
| ∗The dot plots of a searched regulon are shown for all cell subpopulations in each disease state of each tissue based on the regulon specific score inferred using pySCENIC and by calculating the average expression. |
| Page: 1 |
Top |
Somatic mutation of malignant transformation related genes |
| Annotation of somatic variants for genes involved in malignant transformation |
| Hugo Symbol | Variant Class | Variant Classification | dbSNP RS | HGVSc | HGVSp | HGVSp Short | SWISSPROT | BIOTYPE | SIFT | PolyPhen | Tumor Sample Barcode | Tissue | Histology | Sex | Age | Stage | Therapy Types | Drugs | Outcome |
| AUH | SNV | Missense_Mutation | c.487G>A | p.Ala163Thr | p.A163T | Q13825 | protein_coding | tolerated(0.27) | benign(0.003) | TCGA-A1-A0SI-01 | Breast | breast invasive carcinoma | Female | <65 | I/II | Unknown | Unknown | SD | |
| AUH | insertion | Nonsense_Mutation | novel | c.703_704insGACTGTAGTCTGTTGTGCCAGAGTGGACTTCCATTGC | p.Glu235GlyfsTer3 | p.E235Gfs*3 | Q13825 | protein_coding | TCGA-AN-A04A-01 | Breast | breast invasive carcinoma | Female | <65 | III/IV | Unknown | Unknown | SD | ||
| AUH | insertion | Frame_Shift_Ins | novel | c.690_691insGGCCACCCCAAGTCAAAATACATTGAAATATGCTGTTTTCTAGTAA | p.Ser231GlyfsTer79 | p.S231Gfs*79 | Q13825 | protein_coding | TCGA-BH-A0DZ-01 | Breast | breast invasive carcinoma | Female | <65 | I/II | Chemotherapy | docetaxel | SD | ||
| AUH | SNV | Missense_Mutation | c.253N>A | p.Glu85Lys | p.E85K | Q13825 | protein_coding | tolerated(0.38) | benign(0.018) | TCGA-C5-A7CL-01 | Cervix | cervical & endocervical cancer | Female | <65 | III/IV | Chemotherapy | cisplatin | PD | |
| AUH | SNV | Missense_Mutation | rs141700491 | c.679N>A | p.Ala227Thr | p.A227T | Q13825 | protein_coding | tolerated(0.42) | benign(0.007) | TCGA-AA-3977-01 | Colorectum | colon adenocarcinoma | Male | >=65 | I/II | Unknown | Unknown | SD |
| AUH | SNV | Missense_Mutation | c.828N>C | p.Arg276Ser | p.R276S | Q13825 | protein_coding | deleterious(0.01) | possibly_damaging(0.778) | TCGA-AD-A5EJ-01 | Colorectum | colon adenocarcinoma | Female | >=65 | I/II | Unknown | Unknown | SD | |
| AUH | SNV | Missense_Mutation | c.638N>T | p.Ala213Val | p.A213V | Q13825 | protein_coding | deleterious(0) | probably_damaging(0.999) | TCGA-G4-6304-01 | Colorectum | colon adenocarcinoma | Female | >=65 | I/II | Chemotherapy | fluorouracil | PD | |
| AUH | deletion | Frame_Shift_Del | c.188delC | p.Pro63ArgfsTer9 | p.P63Rfs*9 | Q13825 | protein_coding | TCGA-G4-6588-01 | Colorectum | colon adenocarcinoma | Female | <65 | I/II | Unknown | Unknown | SD | |||
| AUH | SNV | Missense_Mutation | novel | c.515N>T | p.Pro172Leu | p.P172L | Q13825 | protein_coding | deleterious(0) | probably_damaging(0.998) | TCGA-A5-A0G1-01 | Endometrium | uterine corpus endometrioid carcinoma | Female | >=65 | I/II | Unknown | Unknown | SD |
| AUH | SNV | Missense_Mutation | c.638N>T | p.Ala213Val | p.A213V | Q13825 | protein_coding | deleterious(0) | probably_damaging(0.999) | TCGA-A5-A2K5-01 | Endometrium | uterine corpus endometrioid carcinoma | Female | >=65 | I/II | Unknown | Unknown | SD |
| Page: 1 2 3 4 |
Top |
Related drugs of malignant transformation related genes |
| Identification of chemicals and drugs interact with genes involved in malignant transfromation |
| (DGIdb 4.0) |
| Entrez ID | Symbol | Category | Interaction Types | Drug Claim Name | Drug Name | PMIDs |
| Page: 1 |

Copyright 2023-Present -The University of Texas Health Science Center at Houston |