
|
|||||
|
 | |
| |
| |
| |
| |
| |
|
Gene: ATXN7L3 |
Gene summary for ATXN7L3 |
| Gene information | Species | Human | Gene symbol | ATXN7L3 | Gene ID | 56970 |
| Gene name | ataxin 7 like 3 | |
| Gene Alias | SGF11 | |
| Cytomap | 17q21.31 | |
| Gene Type | protein-coding | GO ID | GO:0006139 | UniProtAcc | NA |
Top |
Malignant transformation analysis |
| Identification of the aberrant gene expression in precancerous and cancerous lesions by comparing the gene expression of stem-like cells in diseased tissues with normal stem cells |
| Entrez ID | Symbol | Replicates | Species | Organ | Tissue | Adj P-value | Log2FC | Malignancy |
| 56970 | ATXN7L3 | HCC1_Meng | Human | Liver | HCC | 4.08e-15 | 5.19e-03 | 0.0246 |
| 56970 | ATXN7L3 | HCC2_Meng | Human | Liver | HCC | 2.11e-02 | 5.21e-02 | 0.0107 |
| 56970 | ATXN7L3 | HCC1 | Human | Liver | HCC | 1.07e-02 | 2.32e+00 | 0.5336 |
| 56970 | ATXN7L3 | HCC2 | Human | Liver | HCC | 7.01e-16 | 3.65e+00 | 0.5341 |
| 56970 | ATXN7L3 | S014 | Human | Liver | HCC | 1.04e-14 | 4.11e-01 | 0.2254 |
| 56970 | ATXN7L3 | S015 | Human | Liver | HCC | 2.98e-22 | 7.58e-01 | 0.2375 |
| 56970 | ATXN7L3 | S016 | Human | Liver | HCC | 8.03e-17 | 4.62e-01 | 0.2243 |
| 56970 | ATXN7L3 | S027 | Human | Liver | HCC | 2.84e-03 | 3.61e-01 | 0.2446 |
| 56970 | ATXN7L3 | S028 | Human | Liver | HCC | 1.71e-08 | 3.28e-01 | 0.2503 |
| 56970 | ATXN7L3 | S029 | Human | Liver | HCC | 2.08e-08 | 3.60e-01 | 0.2581 |
| 56970 | ATXN7L3 | C04 | Human | Oral cavity | OSCC | 8.21e-07 | 3.75e-01 | 0.2633 |
| 56970 | ATXN7L3 | C21 | Human | Oral cavity | OSCC | 6.13e-18 | 3.84e-01 | 0.2678 |
| 56970 | ATXN7L3 | C30 | Human | Oral cavity | OSCC | 3.31e-35 | 1.29e+00 | 0.3055 |
| 56970 | ATXN7L3 | C38 | Human | Oral cavity | OSCC | 1.51e-02 | 3.16e-01 | 0.172 |
| 56970 | ATXN7L3 | C51 | Human | Oral cavity | OSCC | 8.19e-10 | 3.18e-01 | 0.2674 |
| 56970 | ATXN7L3 | C57 | Human | Oral cavity | OSCC | 1.61e-04 | 1.72e-01 | 0.1679 |
| 56970 | ATXN7L3 | C06 | Human | Oral cavity | OSCC | 3.66e-02 | 3.12e-01 | 0.2699 |
| 56970 | ATXN7L3 | C08 | Human | Oral cavity | OSCC | 2.83e-08 | 1.67e-01 | 0.1919 |
| 56970 | ATXN7L3 | C09 | Human | Oral cavity | OSCC | 1.65e-03 | 1.55e-01 | 0.1431 |
| 56970 | ATXN7L3 | LN38 | Human | Oral cavity | OSCC | 2.57e-03 | 5.17e-01 | 0.168 |
| Page: 1 2 |
| Tissue | Expression Dynamics | Abbreviation |
| Liver |  | HCC: Hepatocellular carcinoma |
| NAFLD: Non-alcoholic fatty liver disease | ||
| Oral Cavity | 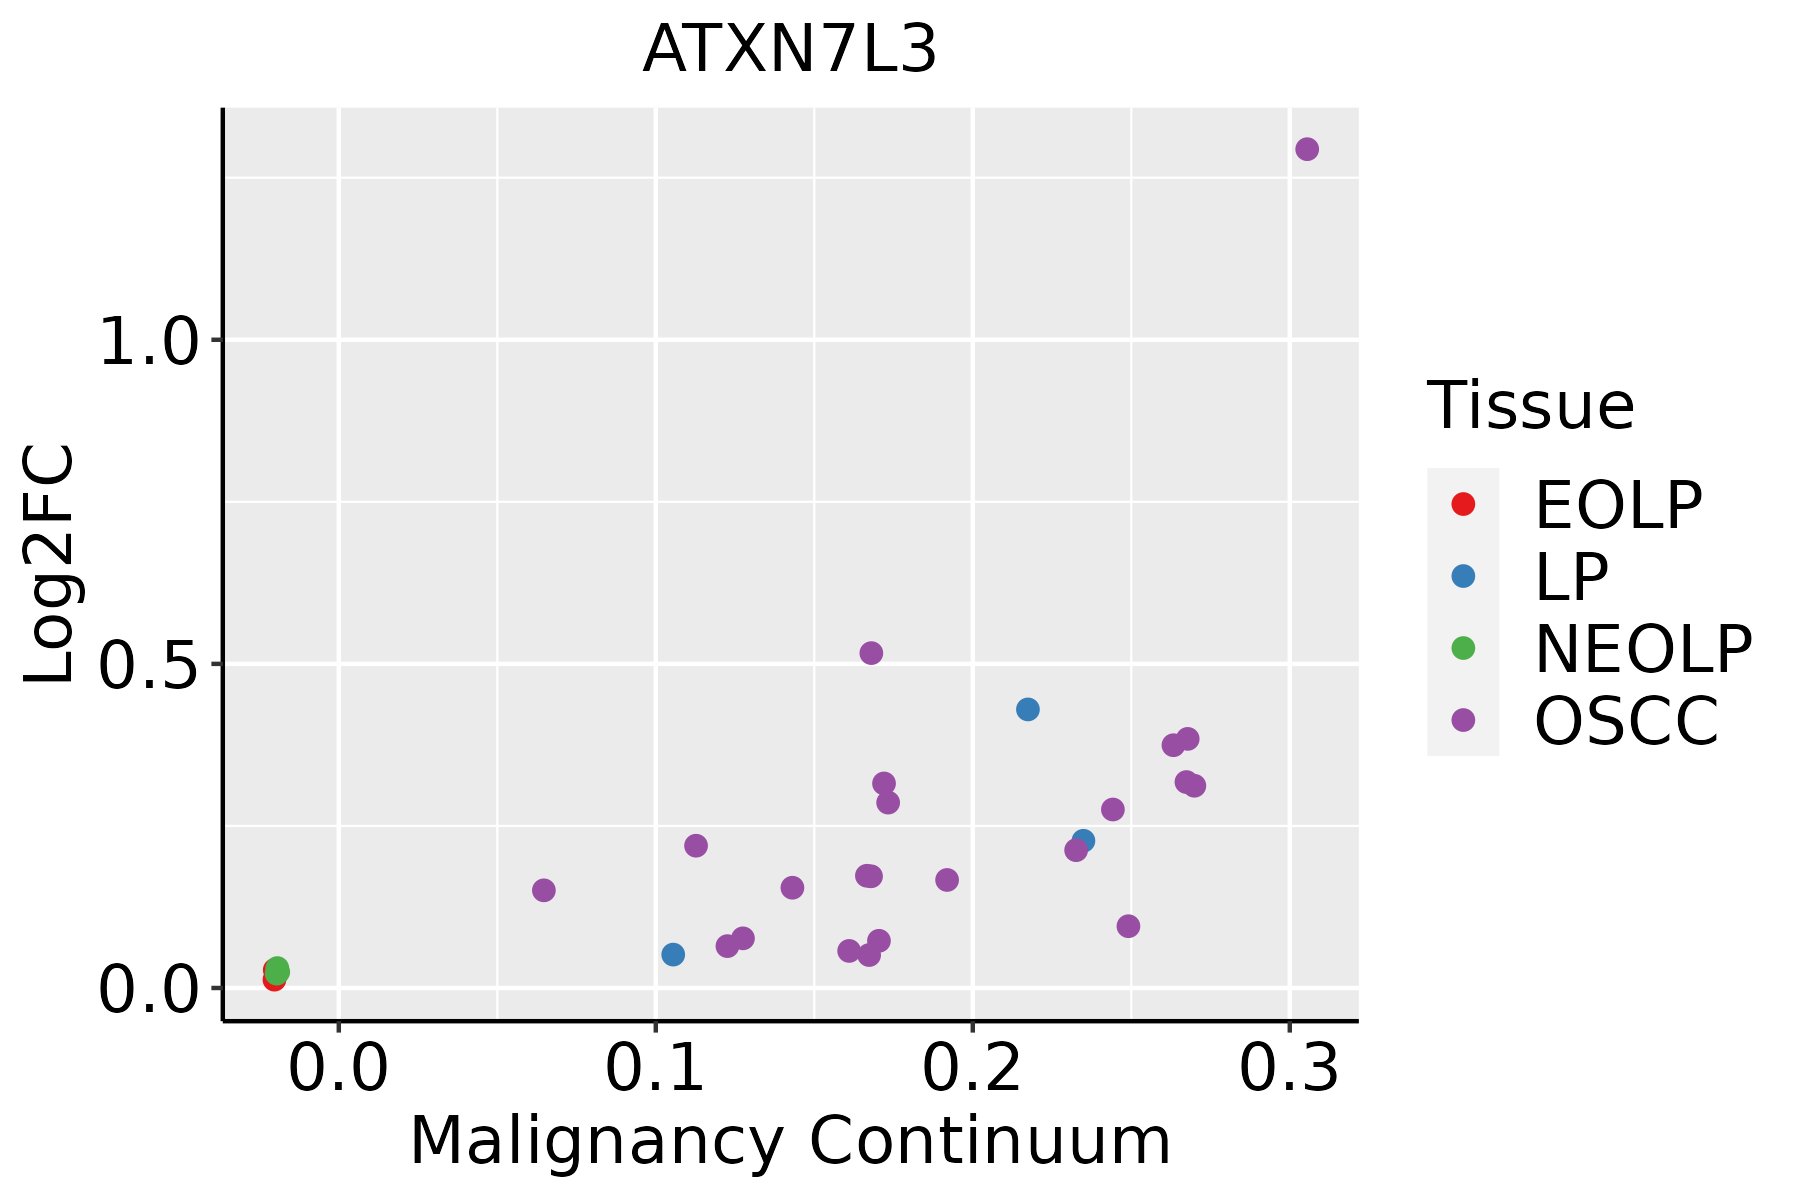 | EOLP: Erosive Oral lichen planus |
| LP: leukoplakia | ||
| NEOLP: Non-erosive oral lichen planus | ||
| OSCC: Oral squamous cell carcinoma |
| ∗log2FC in expression of this searched gene in stem-like cells from each diseased tissue sample relative to stem-like cells in normal samples in each tissue plotted against the malignancy continuum. Samples are colored based on if they are from different disease stage. |
Top |
Malignant transformation related pathway analysis |
| Find out the enriched GO biological processes and KEGG pathways involved in transition from healthy to precancer to cancer |
| Tissue | Disease Stage | Enriched GO biological Processes |
| Colorectum | AD |  |
| Colorectum | SER |  |
| Colorectum | MSS |  |
| Colorectum | MSI-H |  |
| Colorectum | FAP |  |
| ∗Top 15 enriched GO BP terms are showed in the bar plot of each disease state in each tissue. Each row represents a significant GO biological process which is colored according to the -log10(p.adjust). |
| Page: 1 2 3 4 5 6 7 8 9 |
| GO ID | Tissue | Disease Stage | Description | Gene Ratio | Bg Ratio | pvalue | p.adjust | Count |
| GO:001657021 | Liver | HCC | histone modification | 283/7958 | 463/18723 | 2.68e-16 | 2.33e-14 | 283 |
| GO:00165742 | Liver | HCC | histone ubiquitination | 37/7958 | 47/18723 | 4.37e-07 | 7.23e-06 | 37 |
| GO:0010390 | Liver | HCC | histone monoubiquitination | 23/7958 | 29/18723 | 5.86e-05 | 5.38e-04 | 23 |
| GO:00706461 | Liver | HCC | protein modification by small protein removal | 91/7958 | 157/18723 | 6.50e-05 | 5.92e-04 | 91 |
| GO:000651311 | Liver | HCC | protein monoubiquitination | 44/7958 | 67/18723 | 1.08e-04 | 9.22e-04 | 44 |
| GO:00165791 | Liver | HCC | protein deubiquitination | 78/7958 | 139/18723 | 8.13e-04 | 4.87e-03 | 78 |
| GO:0016578 | Liver | HCC | histone deubiquitination | 17/7958 | 23/18723 | 2.28e-03 | 1.13e-02 | 17 |
| GO:00165707 | Oral cavity | OSCC | histone modification | 270/7305 | 463/18723 | 1.59e-17 | 1.50e-15 | 270 |
| GO:00165746 | Oral cavity | OSCC | histone ubiquitination | 38/7305 | 47/18723 | 5.22e-09 | 1.14e-07 | 38 |
| GO:00065135 | Oral cavity | OSCC | protein monoubiquitination | 47/7305 | 67/18723 | 2.32e-07 | 3.68e-06 | 47 |
| GO:00103903 | Oral cavity | OSCC | histone monoubiquitination | 24/7305 | 29/18723 | 1.74e-06 | 2.26e-05 | 24 |
| GO:00706462 | Oral cavity | OSCC | protein modification by small protein removal | 77/7305 | 157/18723 | 6.55e-03 | 2.43e-02 | 77 |
| GO:00165782 | Oral cavity | OSCC | histone deubiquitination | 15/7305 | 23/18723 | 9.84e-03 | 3.46e-02 | 15 |
| GO:001657014 | Oral cavity | LP | histone modification | 152/4623 | 463/18723 | 4.04e-05 | 5.90e-04 | 152 |
| GO:000651313 | Oral cavity | LP | protein monoubiquitination | 29/4623 | 67/18723 | 6.51e-04 | 5.90e-03 | 29 |
| GO:001657413 | Oral cavity | LP | histone ubiquitination | 22/4623 | 47/18723 | 8.02e-04 | 7.05e-03 | 22 |
| GO:00103901 | Oral cavity | LP | histone monoubiquitination | 15/4623 | 29/18723 | 1.55e-03 | 1.20e-02 | 15 |
| Page: 1 |
| Pathway ID | Tissue | Disease Stage | Description | Gene Ratio | Bg Ratio | pvalue | p.adjust | qvalue | Count |
| Page: 1 |
Top |
Cell-cell communication analysis |
| Identification of potential cell-cell interactions between two cell types and their ligand-receptor pairs for different disease states |
| Ligand | Receptor | LRpair | Pathway | Tissue | Disease Stage |
| Page: 1 |
Top |
Single-cell gene regulatory network inference analysis |
| Find out the significant the regulons (TFs) and the target genes of each regulon across cell types for different disease states |
| TF | Cell Type | Tissue | Disease Stage | Target Gene | RSS | Regulon Activity |
| ∗The dot plots of a searched regulon are shown for all cell subpopulations in each disease state of each tissue based on the regulon specific score inferred using pySCENIC and by calculating the average expression. |
| Page: 1 |
Top |
Somatic mutation of malignant transformation related genes |
| Annotation of somatic variants for genes involved in malignant transformation |
| Hugo Symbol | Variant Class | Variant Classification | dbSNP RS | HGVSc | HGVSp | HGVSp Short | SWISSPROT | BIOTYPE | SIFT | PolyPhen | Tumor Sample Barcode | Tissue | Histology | Sex | Age | Stage | Therapy Types | Drugs | Outcome |
| ATXN7L3 | SNV | Missense_Mutation | c.328C>T | p.Arg110Trp | p.R110W | Q14CW9 | protein_coding | deleterious(0) | probably_damaging(0.977) | TCGA-EW-A1P8-01 | Breast | breast invasive carcinoma | Female | <65 | III/IV | Chemotherapy | fluorouracil | PD | |
| ATXN7L3 | SNV | Missense_Mutation | novel | c.871N>C | p.Asp291His | p.D291H | Q14CW9 | protein_coding | deleterious(0) | possibly_damaging(0.882) | TCGA-OL-A6VO-01 | Breast | breast invasive carcinoma | Female | <65 | I/II | Chemotherapy | taxotere | CR |
| ATXN7L3 | insertion | Frame_Shift_Ins | novel | c.655_656insCACAGATGAGCAGAGGCGAACCGTACGGATTTATTTTCTCGGG | p.Ile219ThrfsTer17 | p.I219Tfs*17 | Q14CW9 | protein_coding | TCGA-A8-A09C-01 | Breast | breast invasive carcinoma | Female | >=65 | I/II | Unknown | Unknown | SD | ||
| ATXN7L3 | insertion | Frame_Shift_Ins | novel | c.620_621insTG | p.Glu207AspfsTer7 | p.E207Dfs*7 | Q14CW9 | protein_coding | TCGA-AN-A0FV-01 | Breast | breast invasive carcinoma | Female | <65 | I/II | Unknown | Unknown | SD | ||
| ATXN7L3 | insertion | Frame_Shift_Ins | novel | c.618_619insAATAACTTGAAGTCAGGGGTTCGAAGCTGCAGTGCAGG | p.Glu207AsnfsTer19 | p.E207Nfs*19 | Q14CW9 | protein_coding | TCGA-AN-A0FV-01 | Breast | breast invasive carcinoma | Female | <65 | I/II | Unknown | Unknown | SD | ||
| ATXN7L3 | SNV | Missense_Mutation | c.695N>A | p.Arg232His | p.R232H | Q14CW9 | protein_coding | deleterious(0.05) | benign(0.073) | TCGA-2W-A8YY-01 | Cervix | cervical & endocervical cancer | Female | <65 | I/II | Chemotherapy | cisplatin | CR | |
| ATXN7L3 | SNV | Missense_Mutation | c.271N>T | p.Arg91Cys | p.R91C | Q14CW9 | protein_coding | deleterious(0.04) | benign(0.041) | TCGA-EA-A5FO-01 | Cervix | cervical & endocervical cancer | Female | <65 | I/II | Unknown | Unknown | SD | |
| ATXN7L3 | SNV | Missense_Mutation | c.994G>T | p.Gly332Cys | p.G332C | Q14CW9 | protein_coding | deleterious_low_confidence(0.02) | benign(0.326) | TCGA-AA-A01R-01 | Colorectum | colon adenocarcinoma | Male | <65 | III/IV | Chemotherapy | 5-fluorouracil | PD | |
| ATXN7L3 | SNV | Missense_Mutation | c.695G>A | p.Arg232His | p.R232H | Q14CW9 | protein_coding | deleterious(0.05) | benign(0.073) | TCGA-D5-6930-01 | Colorectum | colon adenocarcinoma | Male | >=65 | I/II | Unknown | Unknown | SD | |
| ATXN7L3 | SNV | Missense_Mutation | rs55884059 | c.890C>T | p.Thr297Met | p.T297M | Q14CW9 | protein_coding | deleterious_low_confidence(0.01) | possibly_damaging(0.482) | TCGA-G4-6588-01 | Colorectum | colon adenocarcinoma | Female | <65 | I/II | Unknown | Unknown | SD |
| Page: 1 2 3 4 5 |
Top |
Related drugs of malignant transformation related genes |
| Identification of chemicals and drugs interact with genes involved in malignant transfromation |
| (DGIdb 4.0) |
| Entrez ID | Symbol | Category | Interaction Types | Drug Claim Name | Drug Name | PMIDs |
| Page: 1 |

Copyright 2023-Present -The University of Texas Health Science Center at Houston |