
|
|||||
|
 | |
| |
| |
| |
| |
| |
|
Gene: ATXN2L |
Gene summary for ATXN2L |
| Gene information | Species | Human | Gene symbol | ATXN2L | Gene ID | 11273 |
| Gene name | ataxin 2 like | |
| Gene Alias | A2D | |
| Cytomap | 16p11.2 | |
| Gene Type | protein-coding | GO ID | GO:0006996 | UniProtAcc | H3BUF6 |
Top |
Malignant transformation analysis |
| Identification of the aberrant gene expression in precancerous and cancerous lesions by comparing the gene expression of stem-like cells in diseased tissues with normal stem cells |
| Entrez ID | Symbol | Replicates | Species | Organ | Tissue | Adj P-value | Log2FC | Malignancy |
| 11273 | ATXN2L | LZE4T | Human | Esophagus | ESCC | 6.09e-05 | 1.07e-01 | 0.0811 |
| 11273 | ATXN2L | LZE7T | Human | Esophagus | ESCC | 7.67e-09 | 6.27e-01 | 0.0667 |
| 11273 | ATXN2L | LZE8T | Human | Esophagus | ESCC | 6.97e-13 | 2.70e-01 | 0.067 |
| 11273 | ATXN2L | LZE20T | Human | Esophagus | ESCC | 5.56e-08 | 1.49e-01 | 0.0662 |
| 11273 | ATXN2L | LZE22T | Human | Esophagus | ESCC | 8.17e-09 | 5.75e-01 | 0.068 |
| 11273 | ATXN2L | LZE24T | Human | Esophagus | ESCC | 1.17e-31 | 1.05e+00 | 0.0596 |
| 11273 | ATXN2L | LZE21T | Human | Esophagus | ESCC | 6.75e-04 | 5.43e-01 | 0.0655 |
| 11273 | ATXN2L | P1T-E | Human | Esophagus | ESCC | 5.42e-19 | 1.04e+00 | 0.0875 |
| 11273 | ATXN2L | P2T-E | Human | Esophagus | ESCC | 1.02e-71 | 1.38e+00 | 0.1177 |
| 11273 | ATXN2L | P4T-E | Human | Esophagus | ESCC | 4.01e-55 | 1.54e+00 | 0.1323 |
| 11273 | ATXN2L | P5T-E | Human | Esophagus | ESCC | 2.84e-26 | 5.27e-01 | 0.1327 |
| 11273 | ATXN2L | P8T-E | Human | Esophagus | ESCC | 4.92e-31 | 6.49e-01 | 0.0889 |
| 11273 | ATXN2L | P9T-E | Human | Esophagus | ESCC | 2.06e-12 | 2.36e-01 | 0.1131 |
| 11273 | ATXN2L | P10T-E | Human | Esophagus | ESCC | 9.12e-22 | 3.97e-01 | 0.116 |
| 11273 | ATXN2L | P11T-E | Human | Esophagus | ESCC | 2.82e-17 | 8.00e-01 | 0.1426 |
| 11273 | ATXN2L | P12T-E | Human | Esophagus | ESCC | 1.29e-42 | 1.01e+00 | 0.1122 |
| 11273 | ATXN2L | P15T-E | Human | Esophagus | ESCC | 1.47e-27 | 7.21e-01 | 0.1149 |
| 11273 | ATXN2L | P16T-E | Human | Esophagus | ESCC | 1.53e-24 | 6.30e-01 | 0.1153 |
| 11273 | ATXN2L | P17T-E | Human | Esophagus | ESCC | 6.54e-09 | 4.62e-01 | 0.1278 |
| 11273 | ATXN2L | P19T-E | Human | Esophagus | ESCC | 7.68e-03 | 3.63e-01 | 0.1662 |
| Page: 1 2 3 4 5 6 |
| Tissue | Expression Dynamics | Abbreviation |
| Esophagus | 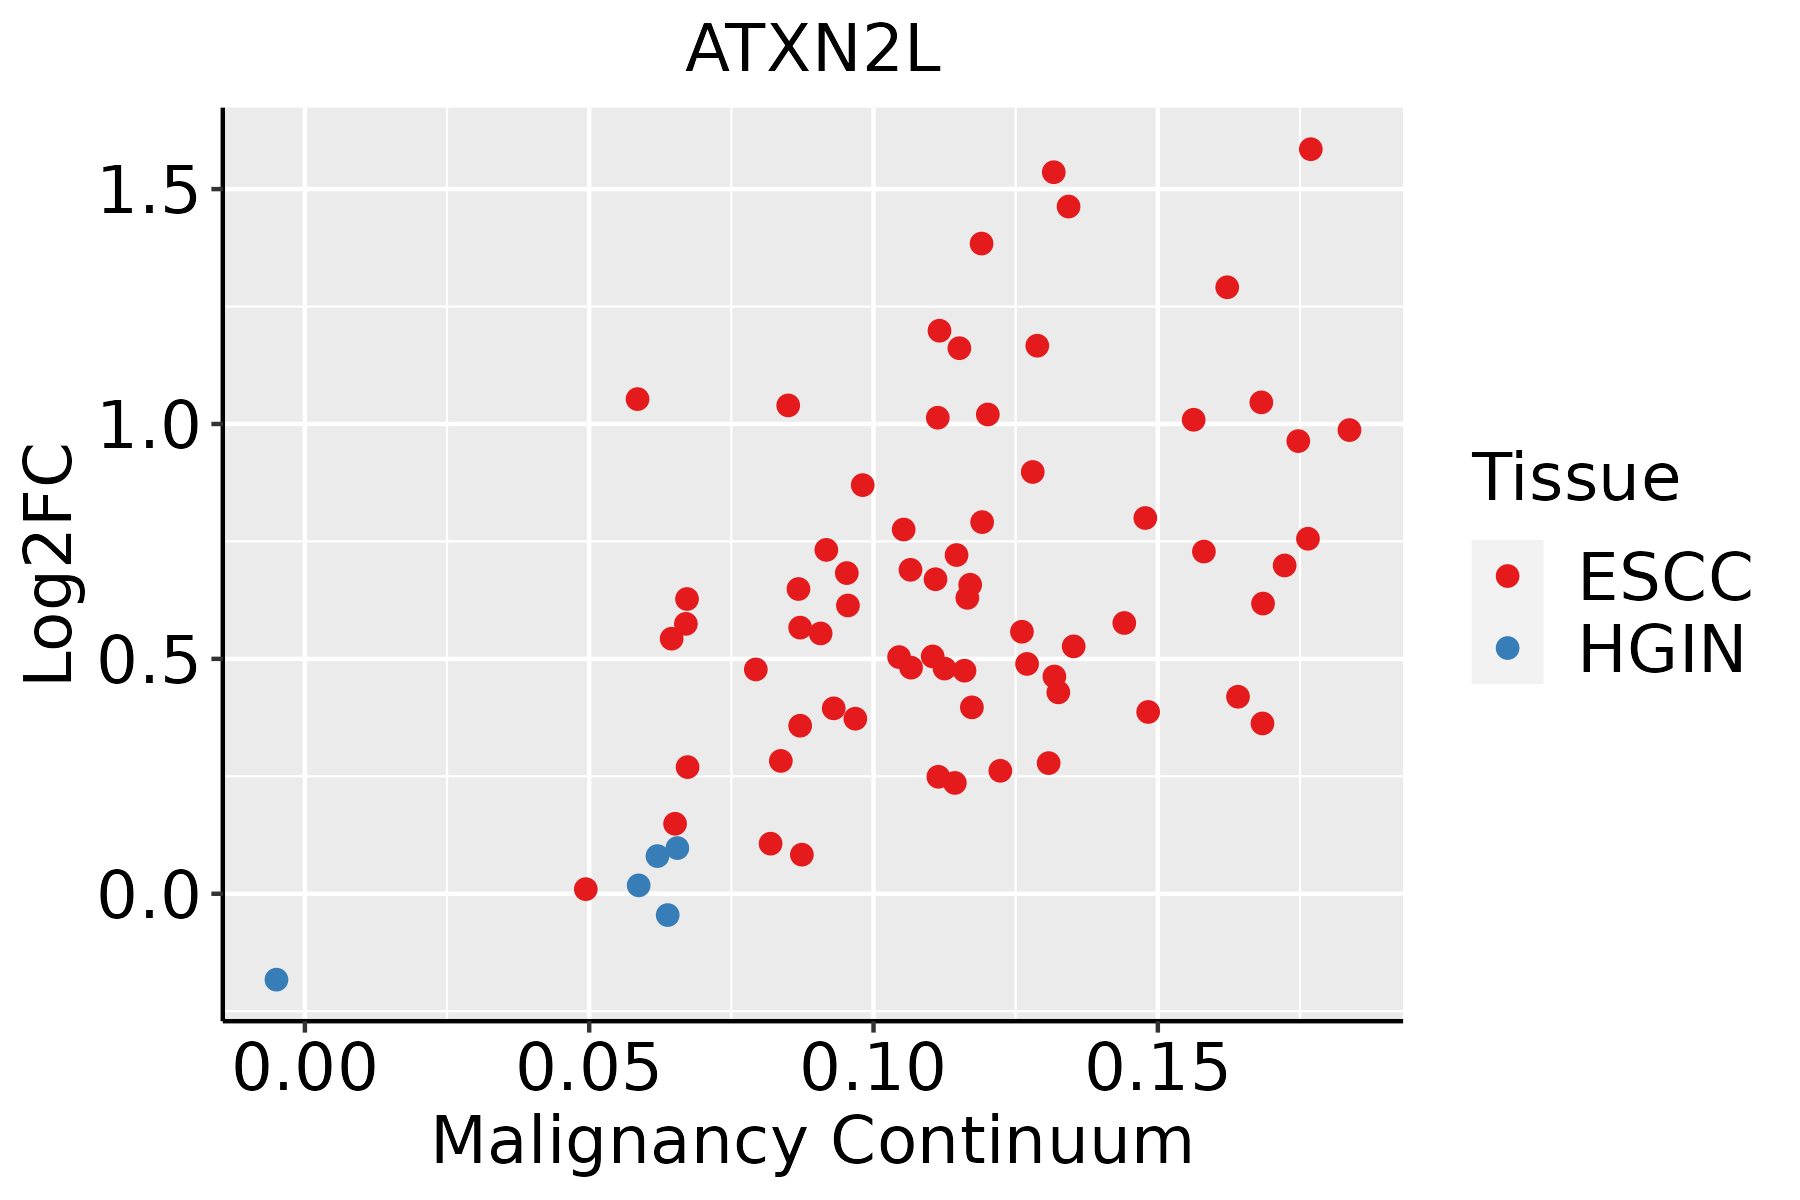 | ESCC: Esophageal squamous cell carcinoma |
| HGIN: High-grade intraepithelial neoplasias | ||
| LGIN: Low-grade intraepithelial neoplasias | ||
| Liver | 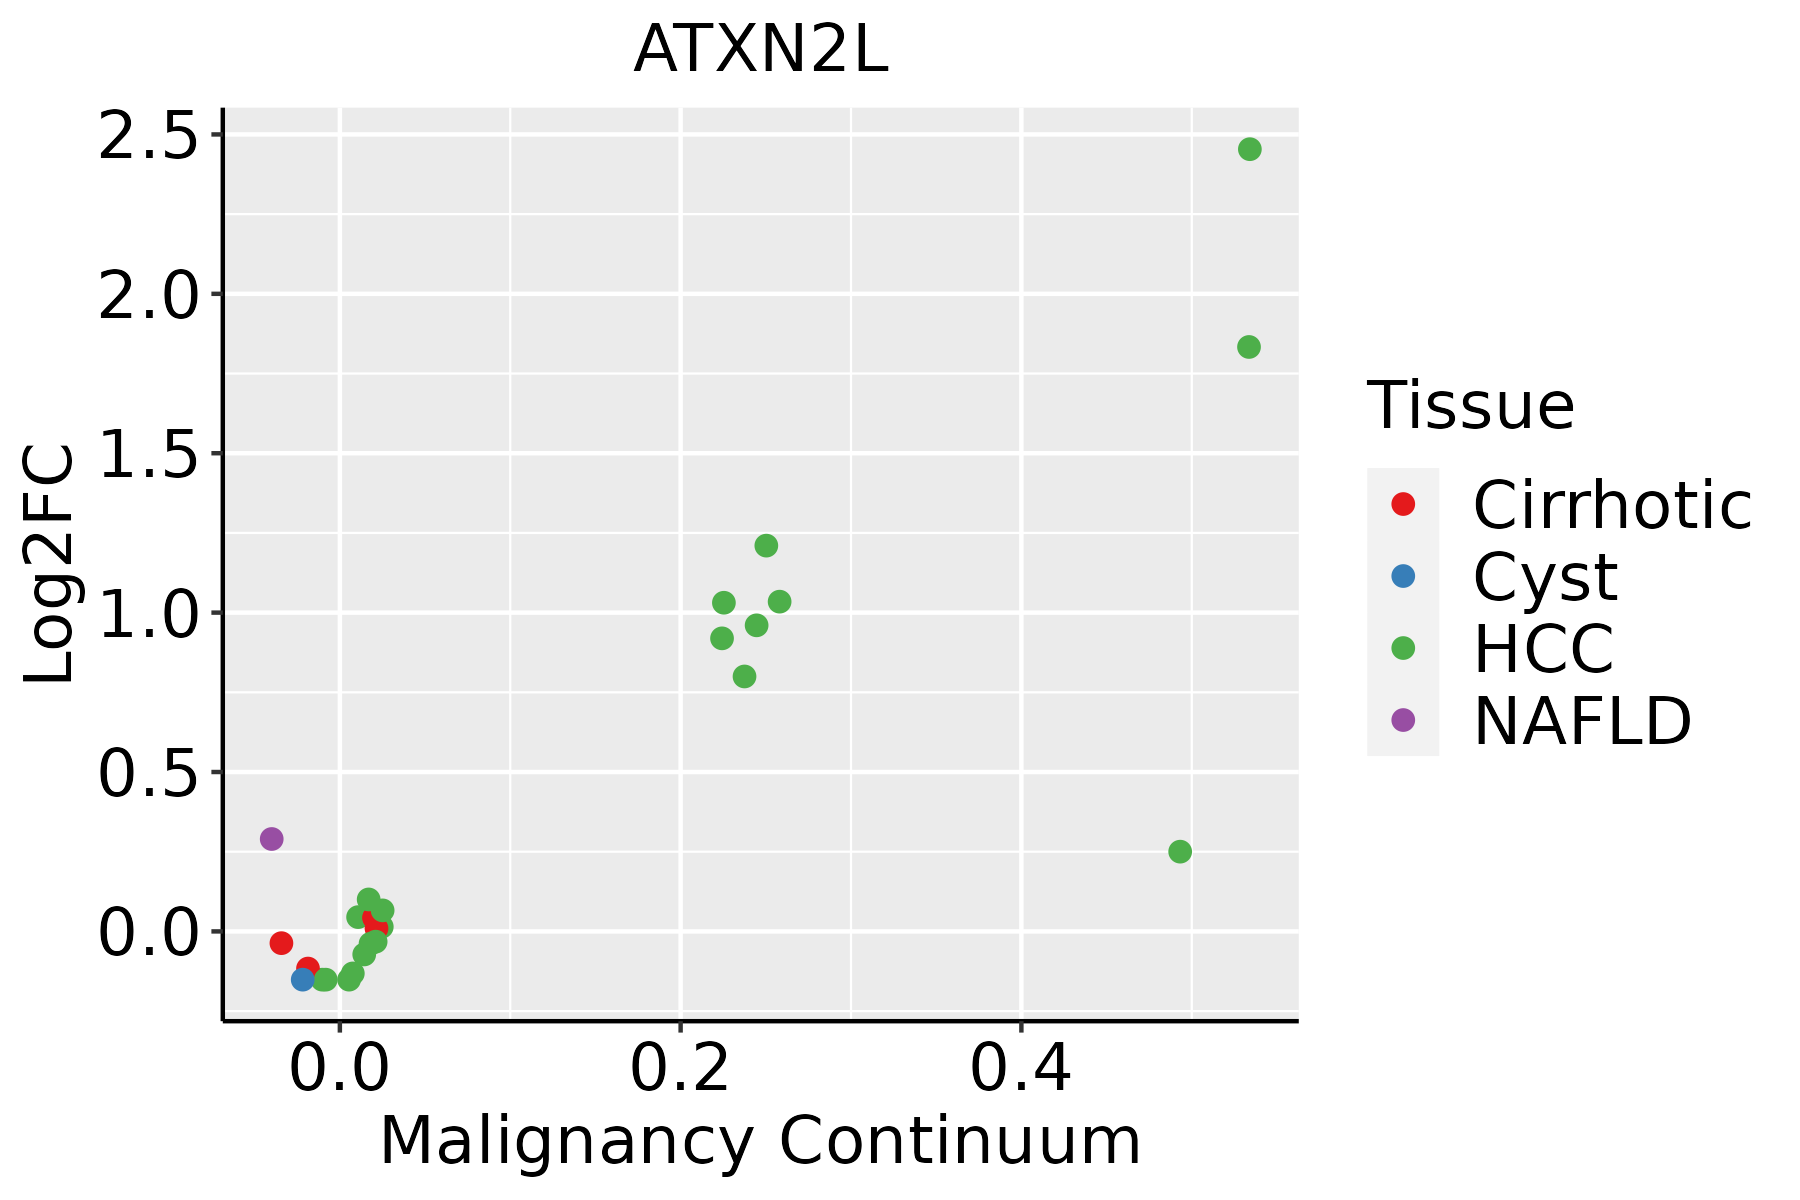 | HCC: Hepatocellular carcinoma |
| NAFLD: Non-alcoholic fatty liver disease | ||
| Oral Cavity | 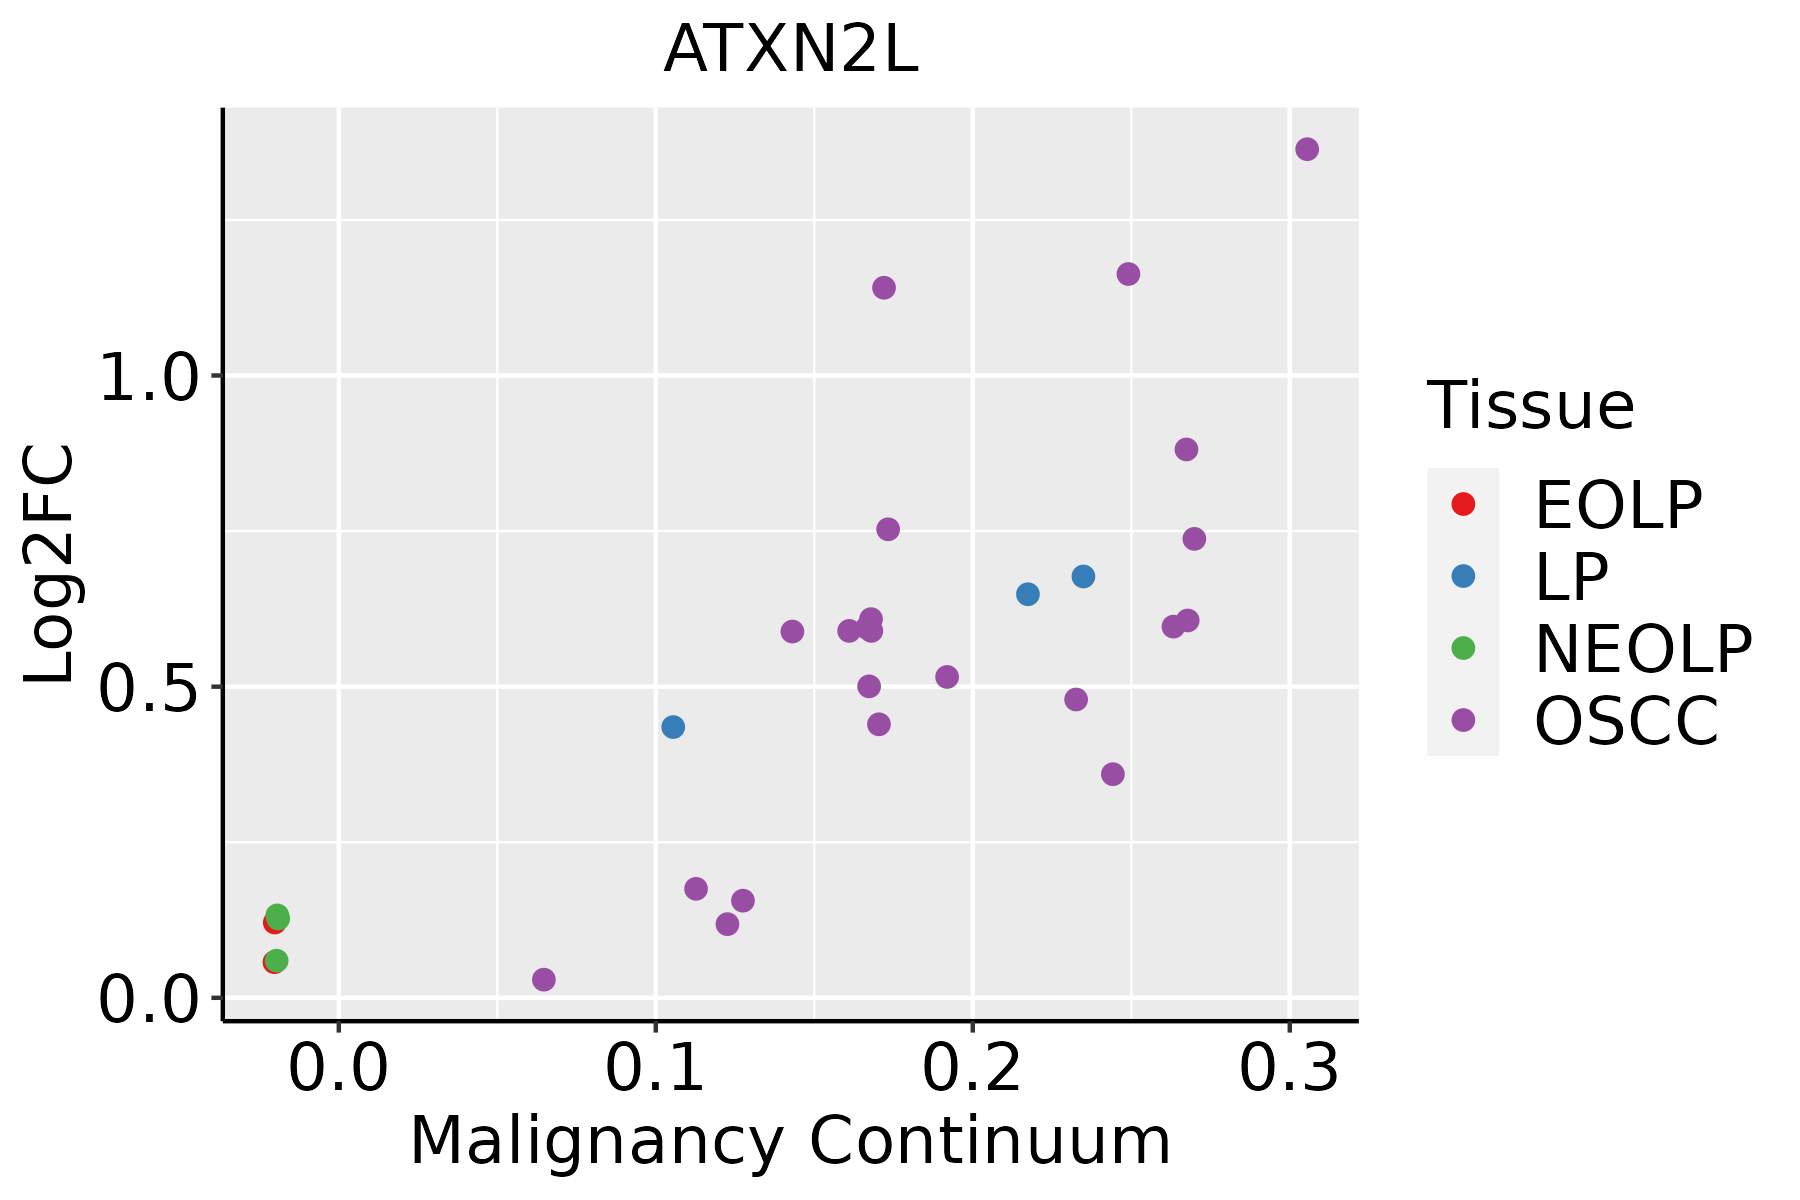 | EOLP: Erosive Oral lichen planus |
| LP: leukoplakia | ||
| NEOLP: Non-erosive oral lichen planus | ||
| OSCC: Oral squamous cell carcinoma | ||
| Thyroid |  | ATC: Anaplastic thyroid cancer |
| HT: Hashimoto's thyroiditis | ||
| PTC: Papillary thyroid cancer |
| ∗log2FC in expression of this searched gene in stem-like cells from each diseased tissue sample relative to stem-like cells in normal samples in each tissue plotted against the malignancy continuum. Samples are colored based on if they are from different disease stage. |
Top |
Malignant transformation related pathway analysis |
| Find out the enriched GO biological processes and KEGG pathways involved in transition from healthy to precancer to cancer |
| Tissue | Disease Stage | Enriched GO biological Processes |
| Colorectum | AD |  |
| Colorectum | SER |  |
| Colorectum | MSS |  |
| Colorectum | MSI-H |  |
| Colorectum | FAP |  |
| ∗Top 15 enriched GO BP terms are showed in the bar plot of each disease state in each tissue. Each row represents a significant GO biological process which is colored according to the -log10(p.adjust). |
| Page: 1 2 3 4 5 6 7 8 9 |
| GO ID | Tissue | Disease Stage | Description | Gene Ratio | Bg Ratio | pvalue | p.adjust | Count |
| GO:003406315 | Esophagus | ESCC | stress granule assembly | 23/8552 | 26/18723 | 6.82e-06 | 6.90e-05 | 23 |
| GO:00340633 | Liver | NAFLD | stress granule assembly | 9/1882 | 26/18723 | 6.56e-04 | 8.50e-03 | 9 |
| GO:00340632 | Liver | HCC | stress granule assembly | 24/7958 | 26/18723 | 1.35e-07 | 2.57e-06 | 24 |
| GO:00340637 | Oral cavity | OSCC | stress granule assembly | 21/7305 | 26/18723 | 1.66e-05 | 1.64e-04 | 21 |
| GO:003406314 | Oral cavity | LP | stress granule assembly | 14/4623 | 26/18723 | 1.33e-03 | 1.07e-02 | 14 |
| GO:003406317 | Thyroid | PTC | stress granule assembly | 21/5968 | 26/18723 | 3.95e-07 | 6.55e-06 | 21 |
| GO:003406323 | Thyroid | ATC | stress granule assembly | 20/6293 | 26/18723 | 7.65e-06 | 7.83e-05 | 20 |
| Page: 1 |
| Pathway ID | Tissue | Disease Stage | Description | Gene Ratio | Bg Ratio | pvalue | p.adjust | qvalue | Count |
| hsa05014210 | Esophagus | ESCC | Amyotrophic lateral sclerosis | 266/4205 | 364/8465 | 1.31e-20 | 2.20e-18 | 1.13e-18 | 266 |
| hsa05022210 | Esophagus | ESCC | Pathways of neurodegeneration - multiple diseases | 318/4205 | 476/8465 | 6.10e-15 | 2.04e-13 | 1.05e-13 | 318 |
| hsa0501728 | Esophagus | ESCC | Spinocerebellar ataxia | 94/4205 | 143/8465 | 6.77e-05 | 2.90e-04 | 1.48e-04 | 94 |
| hsa0501438 | Esophagus | ESCC | Amyotrophic lateral sclerosis | 266/4205 | 364/8465 | 1.31e-20 | 2.20e-18 | 1.13e-18 | 266 |
| hsa0502238 | Esophagus | ESCC | Pathways of neurodegeneration - multiple diseases | 318/4205 | 476/8465 | 6.10e-15 | 2.04e-13 | 1.05e-13 | 318 |
| hsa0501736 | Esophagus | ESCC | Spinocerebellar ataxia | 94/4205 | 143/8465 | 6.77e-05 | 2.90e-04 | 1.48e-04 | 94 |
| hsa0501422 | Liver | HCC | Amyotrophic lateral sclerosis | 252/4020 | 364/8465 | 8.85e-18 | 7.41e-16 | 4.12e-16 | 252 |
| hsa0502222 | Liver | HCC | Pathways of neurodegeneration - multiple diseases | 298/4020 | 476/8465 | 6.59e-12 | 1.30e-10 | 7.22e-11 | 298 |
| hsa0501721 | Liver | HCC | Spinocerebellar ataxia | 92/4020 | 143/8465 | 3.20e-05 | 1.88e-04 | 1.04e-04 | 92 |
| hsa0501432 | Liver | HCC | Amyotrophic lateral sclerosis | 252/4020 | 364/8465 | 8.85e-18 | 7.41e-16 | 4.12e-16 | 252 |
| hsa0502232 | Liver | HCC | Pathways of neurodegeneration - multiple diseases | 298/4020 | 476/8465 | 6.59e-12 | 1.30e-10 | 7.22e-11 | 298 |
| hsa0501731 | Liver | HCC | Spinocerebellar ataxia | 92/4020 | 143/8465 | 3.20e-05 | 1.88e-04 | 1.04e-04 | 92 |
| hsa0501428 | Oral cavity | OSCC | Amyotrophic lateral sclerosis | 246/3704 | 364/8465 | 6.65e-21 | 1.11e-18 | 5.67e-19 | 246 |
| hsa0502228 | Oral cavity | OSCC | Pathways of neurodegeneration - multiple diseases | 292/3704 | 476/8465 | 1.60e-15 | 4.47e-14 | 2.28e-14 | 292 |
| hsa0501725 | Oral cavity | OSCC | Spinocerebellar ataxia | 86/3704 | 143/8465 | 5.21e-05 | 2.08e-04 | 1.06e-04 | 86 |
| hsa05014112 | Oral cavity | OSCC | Amyotrophic lateral sclerosis | 246/3704 | 364/8465 | 6.65e-21 | 1.11e-18 | 5.67e-19 | 246 |
| hsa05022112 | Oral cavity | OSCC | Pathways of neurodegeneration - multiple diseases | 292/3704 | 476/8465 | 1.60e-15 | 4.47e-14 | 2.28e-14 | 292 |
| hsa05017111 | Oral cavity | OSCC | Spinocerebellar ataxia | 86/3704 | 143/8465 | 5.21e-05 | 2.08e-04 | 1.06e-04 | 86 |
| hsa0501429 | Oral cavity | LP | Amyotrophic lateral sclerosis | 197/2418 | 364/8465 | 1.25e-25 | 1.39e-23 | 8.93e-24 | 197 |
| hsa0502229 | Oral cavity | LP | Pathways of neurodegeneration - multiple diseases | 232/2418 | 476/8465 | 7.77e-22 | 3.69e-20 | 2.38e-20 | 232 |
| Page: 1 2 |
Top |
Cell-cell communication analysis |
| Identification of potential cell-cell interactions between two cell types and their ligand-receptor pairs for different disease states |
| Ligand | Receptor | LRpair | Pathway | Tissue | Disease Stage |
| Page: 1 |
Top |
Single-cell gene regulatory network inference analysis |
| Find out the significant the regulons (TFs) and the target genes of each regulon across cell types for different disease states |
| TF | Cell Type | Tissue | Disease Stage | Target Gene | RSS | Regulon Activity |
| ∗The dot plots of a searched regulon are shown for all cell subpopulations in each disease state of each tissue based on the regulon specific score inferred using pySCENIC and by calculating the average expression. |
| Page: 1 |
Top |
Somatic mutation of malignant transformation related genes |
| Annotation of somatic variants for genes involved in malignant transformation |
| Hugo Symbol | Variant Class | Variant Classification | dbSNP RS | HGVSc | HGVSp | HGVSp Short | SWISSPROT | BIOTYPE | SIFT | PolyPhen | Tumor Sample Barcode | Tissue | Histology | Sex | Age | Stage | Therapy Types | Drugs | Outcome |
| ATXN2L | SNV | Missense_Mutation | c.2737N>G | p.Leu913Val | p.L913V | Q8WWM7 | protein_coding | deleterious(0) | possibly_damaging(0.775) | TCGA-AC-A23H-01 | Breast | breast invasive carcinoma | Female | >=65 | I/II | Unknown | Unknown | PD | |
| ATXN2L | SNV | Missense_Mutation | c.1112G>A | p.Gly371Asp | p.G371D | Q8WWM7 | protein_coding | tolerated(0.14) | probably_damaging(0.974) | TCGA-BH-A0HX-01 | Breast | breast invasive carcinoma | Female | <65 | I/II | Chemotherapy | adrimycin | SD | |
| ATXN2L | SNV | Missense_Mutation | c.1244N>T | p.Pro415Leu | p.P415L | Q8WWM7 | protein_coding | deleterious(0.01) | probably_damaging(0.944) | TCGA-C8-A12K-01 | Breast | breast invasive carcinoma | Female | >=65 | I/II | Unknown | Unknown | SD | |
| ATXN2L | SNV | Missense_Mutation | rs777759993 | c.1811N>T | p.Ser604Leu | p.S604L | Q8WWM7 | protein_coding | tolerated(0.16) | benign(0) | TCGA-D8-A1XC-01 | Breast | breast invasive carcinoma | Female | >=65 | III/IV | Unknown | Unknown | PD |
| ATXN2L | SNV | Missense_Mutation | rs745855139 | c.1585N>G | p.Lys529Glu | p.K529E | Q8WWM7 | protein_coding | deleterious(0.05) | possibly_damaging(0.533) | TCGA-D8-A1Y3-01 | Breast | breast invasive carcinoma | Female | <65 | III/IV | Chemotherapy | doxorubicine+cyclophosphamide | SD |
| ATXN2L | SNV | Missense_Mutation | rs745855139 | c.1585N>G | p.Lys529Glu | p.K529E | Q8WWM7 | protein_coding | deleterious(0.05) | possibly_damaging(0.533) | TCGA-E9-A1N5-01 | Breast | breast invasive carcinoma | Female | <65 | I/II | Chemotherapy | doxorubicin | SD |
| ATXN2L | deletion | Frame_Shift_Del | c.2791delT | p.Ser931LeufsTer58 | p.S931Lfs*58 | Q8WWM7 | protein_coding | TCGA-EW-A2FV-01 | Breast | breast invasive carcinoma | Female | <65 | III/IV | Chemotherapy | docetaxel | SD | |||
| ATXN2L | SNV | Missense_Mutation | novel | c.985G>A | p.Ala329Thr | p.A329T | Q8WWM7 | protein_coding | deleterious(0.01) | benign(0.197) | TCGA-2W-A8YY-01 | Cervix | cervical & endocervical cancer | Female | <65 | I/II | Chemotherapy | cisplatin | CR |
| ATXN2L | SNV | Missense_Mutation | rs747076514 | c.2315C>T | p.Ala772Val | p.A772V | Q8WWM7 | protein_coding | deleterious(0.01) | possibly_damaging(0.467) | TCGA-2W-A8YY-01 | Cervix | cervical & endocervical cancer | Female | <65 | I/II | Chemotherapy | cisplatin | CR |
| ATXN2L | SNV | Missense_Mutation | rs772634261 | c.1507N>T | p.Pro503Ser | p.P503S | Q8WWM7 | protein_coding | tolerated(0.18) | benign(0.005) | TCGA-C5-A7X3-01 | Cervix | cervical & endocervical cancer | Female | >=65 | III/IV | Chemotherapy | cisplatin | SD |
| Page: 1 2 3 4 5 6 7 8 9 10 11 12 13 14 |
Top |
Related drugs of malignant transformation related genes |
| Identification of chemicals and drugs interact with genes involved in malignant transfromation |
| (DGIdb 4.0) |
| Entrez ID | Symbol | Category | Interaction Types | Drug Claim Name | Drug Name | PMIDs |
| Page: 1 |

Copyright 2023-Present -The University of Texas Health Science Center at Houston |