
|
|||||
|
 | |
| |
| |
| |
| |
| |
|
Gene: ATXN1L |
Gene summary for ATXN1L |
| Gene information | Species | Human | Gene symbol | ATXN1L | Gene ID | 342371 |
| Gene name | ataxin 1 like | |
| Gene Alias | BOAT | |
| Cytomap | 16q22.2 | |
| Gene Type | protein-coding | GO ID | GO:0000122 | UniProtAcc | P0C7T5 |
Top |
Malignant transformation analysis |
| Identification of the aberrant gene expression in precancerous and cancerous lesions by comparing the gene expression of stem-like cells in diseased tissues with normal stem cells |
| Entrez ID | Symbol | Replicates | Species | Organ | Tissue | Adj P-value | Log2FC | Malignancy |
| 342371 | ATXN1L | C04 | Human | Oral cavity | OSCC | 3.83e-04 | 4.49e-01 | 0.2633 |
| 342371 | ATXN1L | C21 | Human | Oral cavity | OSCC | 1.09e-10 | 4.47e-01 | 0.2678 |
| 342371 | ATXN1L | C30 | Human | Oral cavity | OSCC | 1.10e-12 | 5.16e-01 | 0.3055 |
| 342371 | ATXN1L | C38 | Human | Oral cavity | OSCC | 3.09e-03 | 5.60e-01 | 0.172 |
| 342371 | ATXN1L | C43 | Human | Oral cavity | OSCC | 1.16e-07 | 2.02e-01 | 0.1704 |
| 342371 | ATXN1L | C46 | Human | Oral cavity | OSCC | 6.30e-05 | 2.19e-01 | 0.1673 |
| 342371 | ATXN1L | C57 | Human | Oral cavity | OSCC | 3.72e-05 | 2.64e-01 | 0.1679 |
| 342371 | ATXN1L | C08 | Human | Oral cavity | OSCC | 1.96e-07 | 2.61e-01 | 0.1919 |
| 342371 | ATXN1L | LN46 | Human | Oral cavity | OSCC | 7.49e-03 | 3.30e-01 | 0.1666 |
| 342371 | ATXN1L | SYSMH2 | Human | Oral cavity | OSCC | 2.21e-06 | 2.23e-01 | 0.2326 |
| 342371 | ATXN1L | SYSMH3 | Human | Oral cavity | OSCC | 3.11e-03 | 1.38e-01 | 0.2442 |
| Page: 1 |
| Tissue | Expression Dynamics | Abbreviation |
| Oral Cavity | 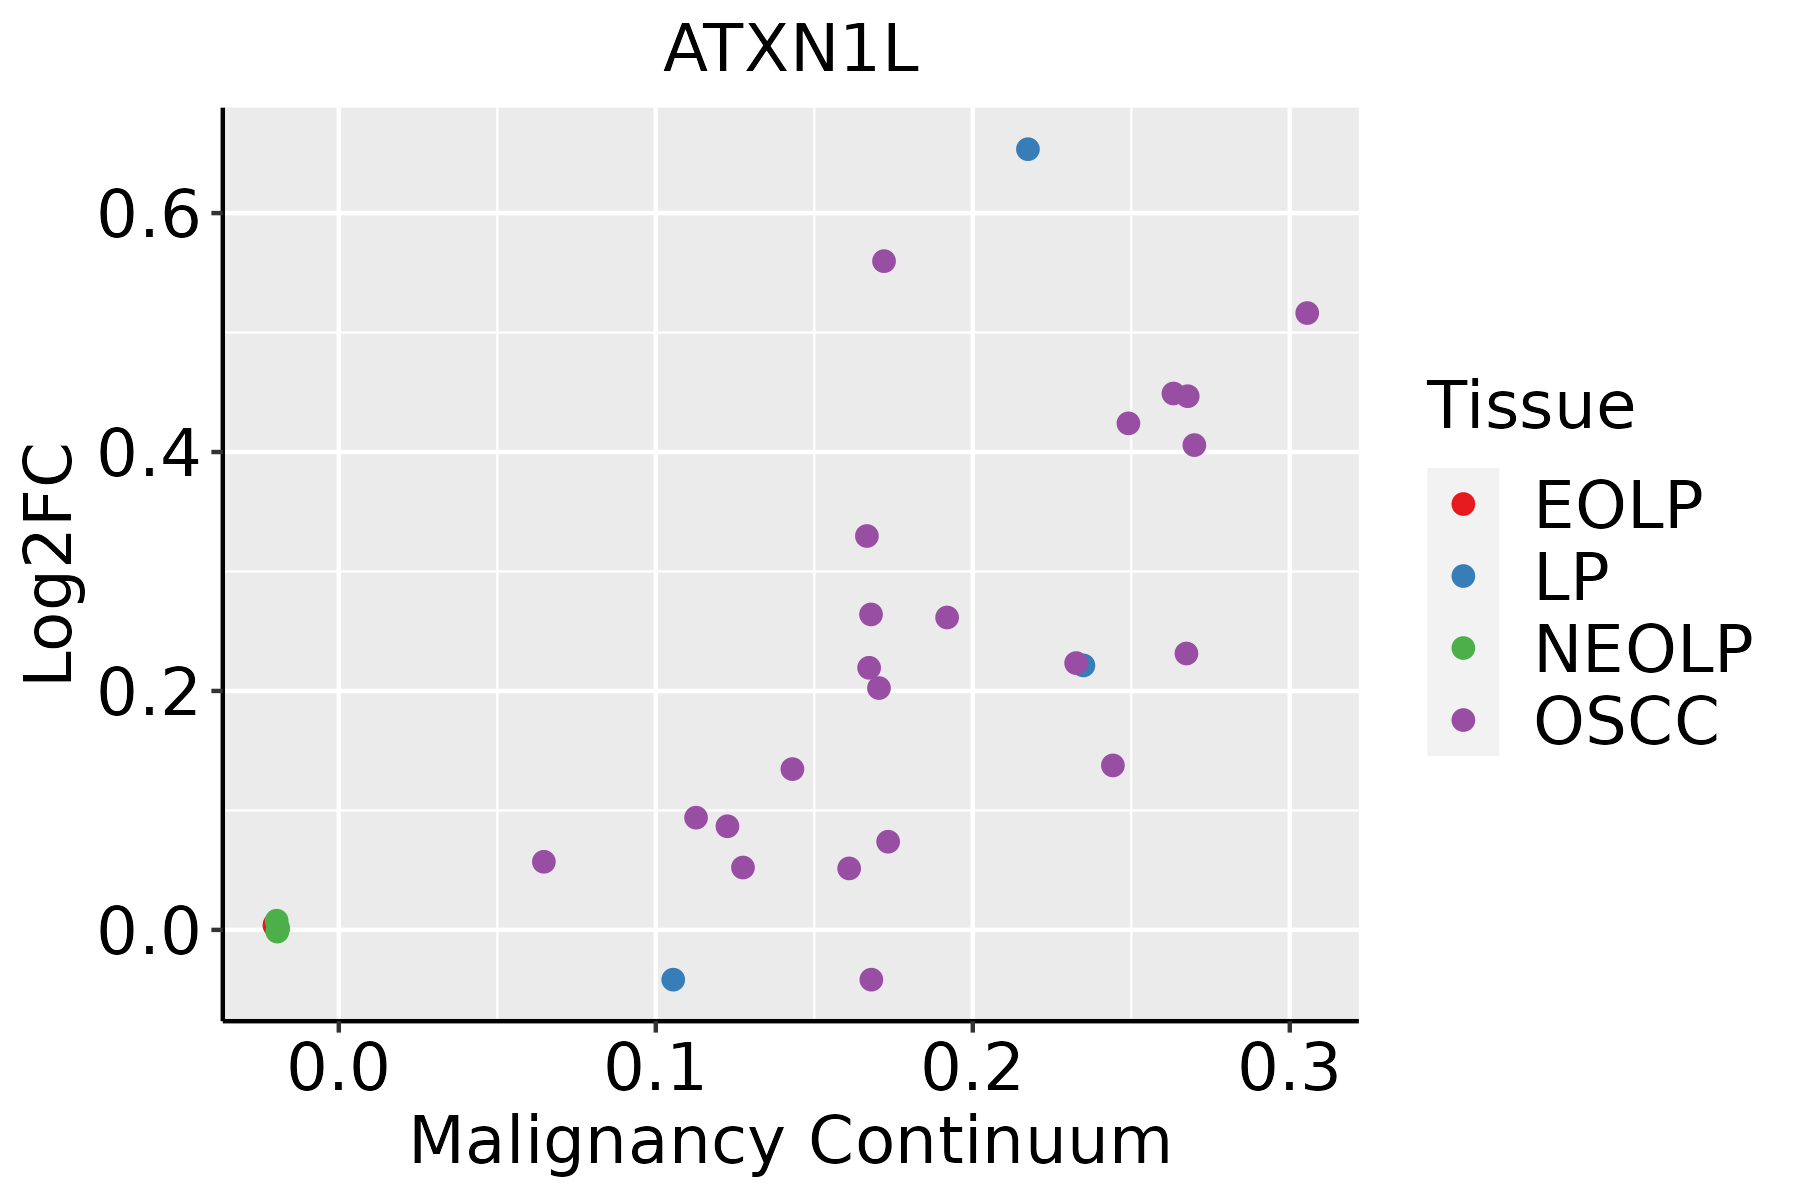 | EOLP: Erosive Oral lichen planus |
| LP: leukoplakia | ||
| NEOLP: Non-erosive oral lichen planus | ||
| OSCC: Oral squamous cell carcinoma |
| ∗log2FC in expression of this searched gene in stem-like cells from each diseased tissue sample relative to stem-like cells in normal samples in each tissue plotted against the malignancy continuum. Samples are colored based on if they are from different disease stage. |
Top |
Malignant transformation related pathway analysis |
| Find out the enriched GO biological processes and KEGG pathways involved in transition from healthy to precancer to cancer |
| Tissue | Disease Stage | Enriched GO biological Processes |
| Colorectum | AD |  |
| Colorectum | SER |  |
| Colorectum | MSS |  |
| Colorectum | MSI-H |  |
| Colorectum | FAP |  |
| ∗Top 15 enriched GO BP terms are showed in the bar plot of each disease state in each tissue. Each row represents a significant GO biological process which is colored according to the -log10(p.adjust). |
| Page: 1 2 3 4 5 6 7 8 9 |
| GO ID | Tissue | Disease Stage | Description | Gene Ratio | Bg Ratio | pvalue | p.adjust | Count |
| GO:00303238 | Oral cavity | OSCC | respiratory tube development | 95/7305 | 181/18723 | 1.53e-04 | 1.07e-03 | 95 |
| GO:00301983 | Oral cavity | OSCC | extracellular matrix organization | 146/7305 | 301/18723 | 4.67e-04 | 2.77e-03 | 146 |
| GO:00303248 | Oral cavity | OSCC | lung development | 91/7305 | 177/18723 | 5.18e-04 | 3.01e-03 | 91 |
| GO:00452293 | Oral cavity | OSCC | external encapsulating structure organization | 147/7305 | 304/18723 | 5.30e-04 | 3.08e-03 | 147 |
| GO:00430623 | Oral cavity | OSCC | extracellular structure organization | 146/7305 | 302/18723 | 5.59e-04 | 3.23e-03 | 146 |
| GO:00605416 | Oral cavity | OSCC | respiratory system development | 100/7305 | 203/18723 | 1.83e-03 | 8.60e-03 | 100 |
| Page: 1 |
| Pathway ID | Tissue | Disease Stage | Description | Gene Ratio | Bg Ratio | pvalue | p.adjust | qvalue | Count |
| hsa0502228 | Oral cavity | OSCC | Pathways of neurodegeneration - multiple diseases | 292/3704 | 476/8465 | 1.60e-15 | 4.47e-14 | 2.28e-14 | 292 |
| hsa043305 | Oral cavity | OSCC | Notch signaling pathway | 44/3704 | 62/8465 | 1.26e-05 | 5.55e-05 | 2.83e-05 | 44 |
| hsa0501725 | Oral cavity | OSCC | Spinocerebellar ataxia | 86/3704 | 143/8465 | 5.21e-05 | 2.08e-04 | 1.06e-04 | 86 |
| hsa05022112 | Oral cavity | OSCC | Pathways of neurodegeneration - multiple diseases | 292/3704 | 476/8465 | 1.60e-15 | 4.47e-14 | 2.28e-14 | 292 |
| hsa0433012 | Oral cavity | OSCC | Notch signaling pathway | 44/3704 | 62/8465 | 1.26e-05 | 5.55e-05 | 2.83e-05 | 44 |
| hsa05017111 | Oral cavity | OSCC | Spinocerebellar ataxia | 86/3704 | 143/8465 | 5.21e-05 | 2.08e-04 | 1.06e-04 | 86 |
| Page: 1 |
Top |
Cell-cell communication analysis |
| Identification of potential cell-cell interactions between two cell types and their ligand-receptor pairs for different disease states |
| Ligand | Receptor | LRpair | Pathway | Tissue | Disease Stage |
| Page: 1 |
Top |
Single-cell gene regulatory network inference analysis |
| Find out the significant the regulons (TFs) and the target genes of each regulon across cell types for different disease states |
| TF | Cell Type | Tissue | Disease Stage | Target Gene | RSS | Regulon Activity |
| ∗The dot plots of a searched regulon are shown for all cell subpopulations in each disease state of each tissue based on the regulon specific score inferred using pySCENIC and by calculating the average expression. |
| Page: 1 |
Top |
Somatic mutation of malignant transformation related genes |
| Annotation of somatic variants for genes involved in malignant transformation |
| Hugo Symbol | Variant Class | Variant Classification | dbSNP RS | HGVSc | HGVSp | HGVSp Short | SWISSPROT | BIOTYPE | SIFT | PolyPhen | Tumor Sample Barcode | Tissue | Histology | Sex | Age | Stage | Therapy Types | Drugs | Outcome |
| ATXN1L | SNV | Missense_Mutation | c.682C>G | p.Pro228Ala | p.P228A | P0C7T5 | protein_coding | deleterious(0.01) | benign(0.14) | TCGA-D8-A13Z-01 | Breast | breast invasive carcinoma | Female | <65 | I/II | Chemotherapy | doxorubicine | SD | |
| ATXN1L | SNV | Missense_Mutation | rs761404202 | c.1015C>T | p.Arg339Trp | p.R339W | P0C7T5 | protein_coding | deleterious(0) | probably_damaging(0.939) | TCGA-2W-A8YY-01 | Cervix | cervical & endocervical cancer | Female | <65 | I/II | Chemotherapy | cisplatin | CR |
| ATXN1L | SNV | Missense_Mutation | novel | c.1484G>A | p.Arg495His | p.R495H | P0C7T5 | protein_coding | tolerated(0.05) | probably_damaging(0.927) | TCGA-2W-A8YY-01 | Cervix | cervical & endocervical cancer | Female | <65 | I/II | Chemotherapy | cisplatin | CR |
| ATXN1L | SNV | Missense_Mutation | c.1847G>A | p.Arg616Lys | p.R616K | P0C7T5 | protein_coding | tolerated(0.23) | possibly_damaging(0.533) | TCGA-C5-A3HE-01 | Cervix | cervical & endocervical cancer | Female | <65 | I/II | Unknown | Unknown | PD | |
| ATXN1L | SNV | Missense_Mutation | rs760845337 | c.1940G>T | p.Cys647Phe | p.C647F | P0C7T5 | protein_coding | tolerated(0.69) | benign(0.033) | TCGA-C5-A3HE-01 | Cervix | cervical & endocervical cancer | Female | <65 | I/II | Unknown | Unknown | PD |
| ATXN1L | SNV | Missense_Mutation | novel | c.1631N>T | p.Pro544Leu | p.P544L | P0C7T5 | protein_coding | deleterious(0) | probably_damaging(1) | TCGA-VS-A8QH-01 | Cervix | cervical & endocervical cancer | Female | >=65 | I/II | Chemotherapy | gemcitabine | PD |
| ATXN1L | SNV | Missense_Mutation | c.1301N>T | p.Ser434Leu | p.S434L | P0C7T5 | protein_coding | tolerated(0.08) | benign(0.001) | TCGA-AA-3811-01 | Colorectum | colon adenocarcinoma | Female | >=65 | III/IV | Unknown | Unknown | PD | |
| ATXN1L | SNV | Missense_Mutation | rs770317159 | c.1832N>T | p.Thr611Met | p.T611M | P0C7T5 | protein_coding | tolerated(0.1) | probably_damaging(0.913) | TCGA-AA-A022-01 | Colorectum | colon adenocarcinoma | Female | >=65 | I/II | Unknown | Unknown | SD |
| ATXN1L | SNV | Missense_Mutation | c.811G>C | p.Gly271Arg | p.G271R | P0C7T5 | protein_coding | tolerated(0.08) | benign(0.02) | TCGA-AA-A03J-01 | Colorectum | colon adenocarcinoma | Female | >=65 | I/II | Unknown | Unknown | SD | |
| ATXN1L | SNV | Missense_Mutation | rs761404202 | c.1015C>T | p.Arg339Trp | p.R339W | P0C7T5 | protein_coding | deleterious(0) | probably_damaging(0.939) | TCGA-AD-6895-01 | Colorectum | colon adenocarcinoma | Male | >=65 | III/IV | Unknown | Unknown | SD |
| Page: 1 2 3 4 |
Top |
Related drugs of malignant transformation related genes |
| Identification of chemicals and drugs interact with genes involved in malignant transfromation |
| (DGIdb 4.0) |
| Entrez ID | Symbol | Category | Interaction Types | Drug Claim Name | Drug Name | PMIDs |
| 342371 | ATXN1L | DRUG RESISTANCE | TRAMETINIB | TRAMETINIB | 28178529 | |
| 342371 | ATXN1L | DRUG RESISTANCE | VEMURAFENIB | VEMURAFENIB | 28178529 | |
| 342371 | ATXN1L | DRUG RESISTANCE | DABRAFENIB | DABRAFENIB | 28178529 |
| Page: 1 |

Copyright 2023-Present -The University of Texas Health Science Center at Houston |