
|
|||||
|
 | |
| |
| |
| |
| |
| |
|
Gene: ATXN1 |
Gene summary for ATXN1 |
| Gene information | Species | Human | Gene symbol | ATXN1 | Gene ID | 6310 |
| Gene name | ataxin 1 | |
| Gene Alias | ATX1 | |
| Cytomap | 6p22.3 | |
| Gene Type | protein-coding | GO ID | GO:0000122 | UniProtAcc | P54253 |
Top |
Malignant transformation analysis |
| Identification of the aberrant gene expression in precancerous and cancerous lesions by comparing the gene expression of stem-like cells in diseased tissues with normal stem cells |
| Entrez ID | Symbol | Replicates | Species | Organ | Tissue | Adj P-value | Log2FC | Malignancy |
| 6310 | ATXN1 | CCI_1 | Human | Cervix | CC | 5.65e-11 | 1.52e+00 | 0.528 |
| 6310 | ATXN1 | CCI_3 | Human | Cervix | CC | 7.33e-06 | 8.03e-01 | 0.516 |
| 6310 | ATXN1 | Tumor | Human | Cervix | CC | 2.01e-02 | -2.47e-01 | 0.1241 |
| 6310 | ATXN1 | HTA11_1938_2000001011 | Human | Colorectum | AD | 4.01e-05 | 6.42e-01 | -0.0811 |
| 6310 | ATXN1 | HTA11_347_2000001011 | Human | Colorectum | AD | 2.74e-10 | 6.19e-01 | -0.1954 |
| 6310 | ATXN1 | HTA11_411_2000001011 | Human | Colorectum | SER | 3.42e-03 | 7.63e-01 | -0.2602 |
| 6310 | ATXN1 | HTA11_7663_2000001011 | Human | Colorectum | SER | 3.07e-05 | 6.47e-01 | 0.0131 |
| 6310 | ATXN1 | HTA11_6818_2000001021 | Human | Colorectum | AD | 1.86e-05 | 6.25e-01 | 0.0588 |
| 6310 | ATXN1 | HTA11_99999970781_79442 | Human | Colorectum | MSS | 5.03e-19 | 1.11e+00 | 0.294 |
| 6310 | ATXN1 | HTA11_99999965062_69753 | Human | Colorectum | MSI-H | 6.28e-09 | 1.18e+00 | 0.3487 |
| 6310 | ATXN1 | HTA11_99999965104_69814 | Human | Colorectum | MSS | 2.83e-11 | 8.97e-01 | 0.281 |
| 6310 | ATXN1 | HTA11_99999971662_82457 | Human | Colorectum | MSS | 2.76e-09 | 9.76e-01 | 0.3859 |
| 6310 | ATXN1 | HTA11_99999974143_84620 | Human | Colorectum | MSS | 1.28e-02 | -2.77e-01 | 0.3005 |
| 6310 | ATXN1 | A002-C-010 | Human | Colorectum | FAP | 2.24e-05 | 3.42e-01 | 0.242 |
| 6310 | ATXN1 | A001-C-207 | Human | Colorectum | FAP | 3.12e-04 | 3.11e-01 | 0.1278 |
| 6310 | ATXN1 | A015-C-203 | Human | Colorectum | FAP | 7.04e-28 | -1.72e-01 | -0.1294 |
| 6310 | ATXN1 | A015-C-204 | Human | Colorectum | FAP | 3.36e-02 | -1.78e-01 | -0.0228 |
| 6310 | ATXN1 | A002-C-201 | Human | Colorectum | FAP | 1.95e-08 | -2.28e-01 | 0.0324 |
| 6310 | ATXN1 | A002-C-203 | Human | Colorectum | FAP | 1.23e-03 | 2.10e-01 | 0.2786 |
| 6310 | ATXN1 | A001-C-108 | Human | Colorectum | FAP | 8.00e-15 | -1.10e-01 | -0.0272 |
| Page: 1 2 3 4 5 6 7 8 9 10 11 12 |
| Tissue | Expression Dynamics | Abbreviation |
| Cervix |  | CC: Cervix cancer |
| HSIL_HPV: HPV-infected high-grade squamous intraepithelial lesions | ||
| N_HPV: HPV-infected normal cervix | ||
| Colorectum (GSE201348) |  | FAP: Familial adenomatous polyposis |
| CRC: Colorectal cancer | ||
| Colorectum (HTA11) |  | AD: Adenomas |
| SER: Sessile serrated lesions | ||
| MSI-H: Microsatellite-high colorectal cancer | ||
| MSS: Microsatellite stable colorectal cancer | ||
| Endometrium |  | AEH: Atypical endometrial hyperplasia |
| EEC: Endometrioid Cancer | ||
| Esophagus | 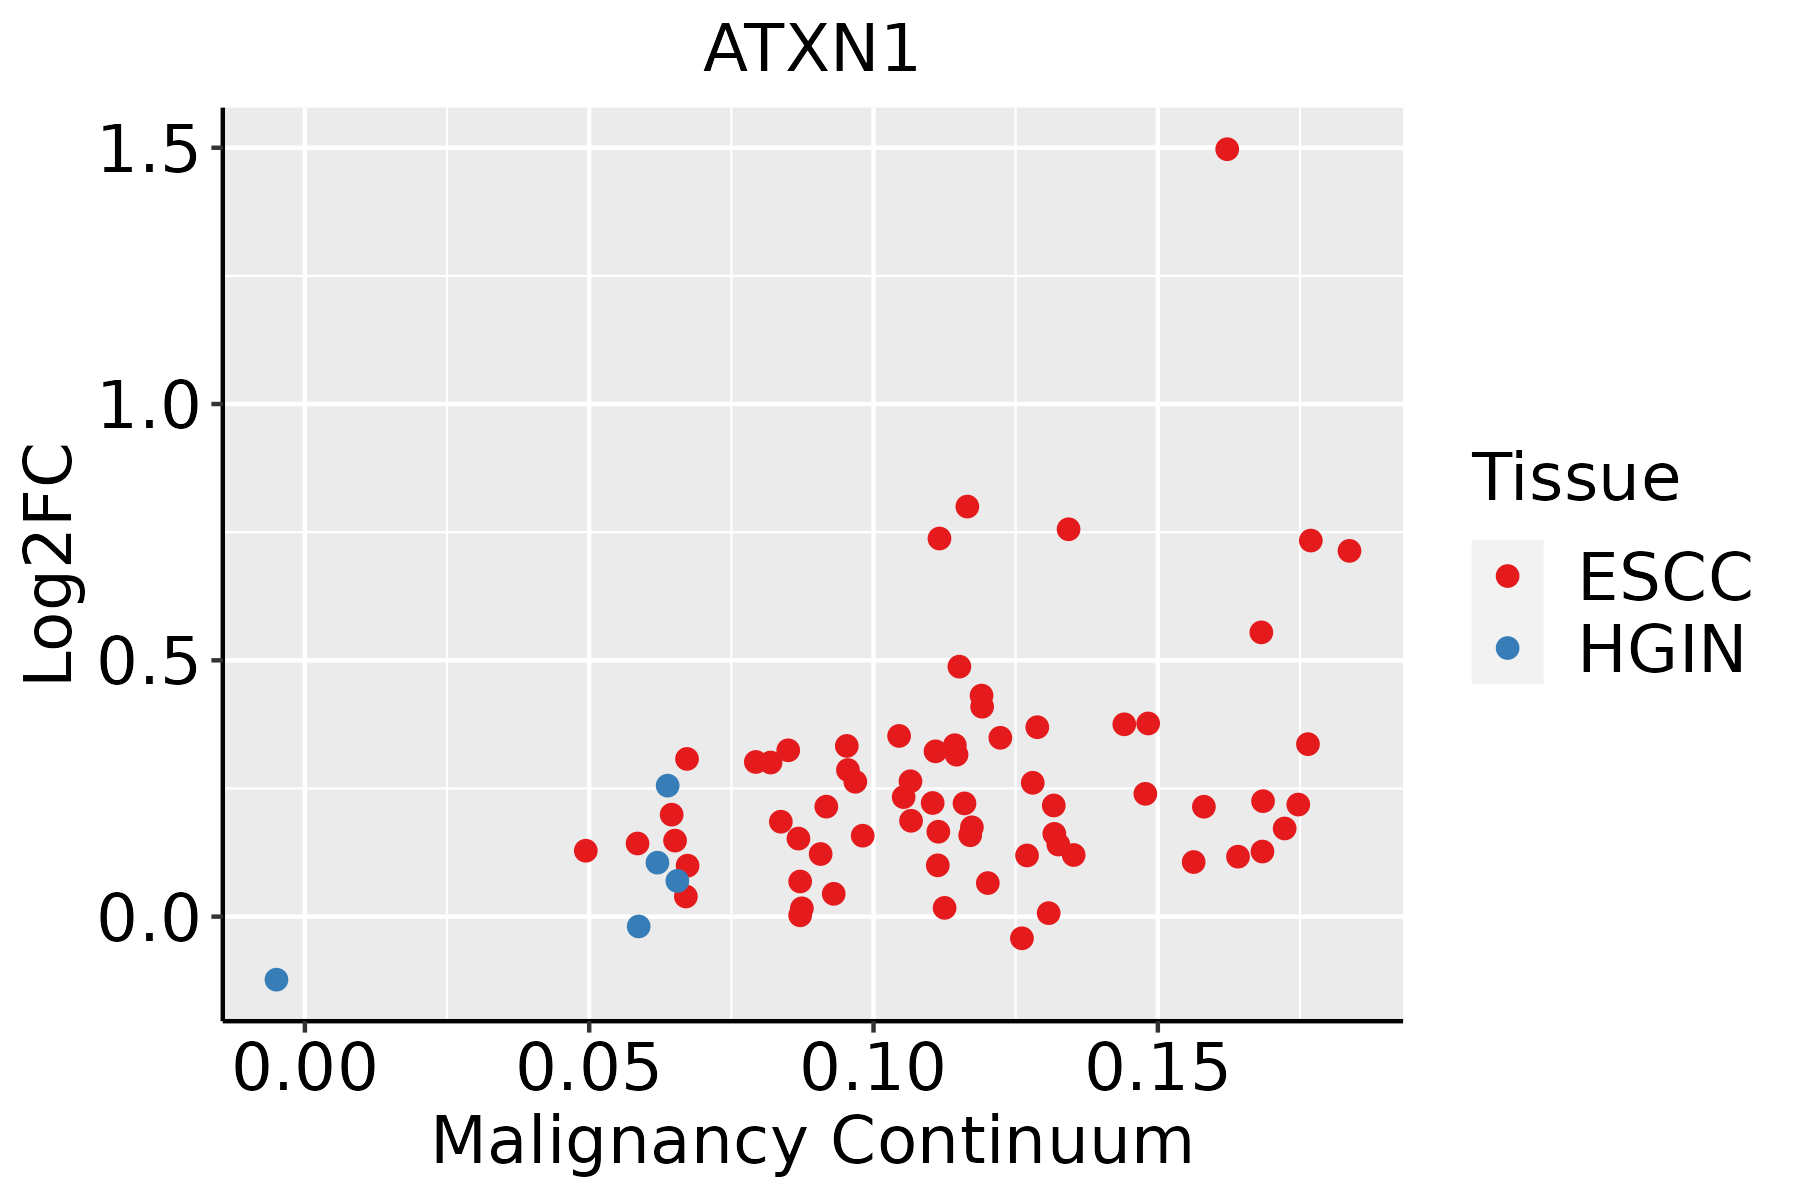 | ESCC: Esophageal squamous cell carcinoma |
| HGIN: High-grade intraepithelial neoplasias | ||
| LGIN: Low-grade intraepithelial neoplasias | ||
| GC |  | CAG: Chronic atrophic gastritis |
| CAG with IM: Chronic atrophic gastritis with intestinal metaplasia | ||
| CSG: Chronic superficial gastritis | ||
| GC: Gastric cancer | ||
| SIM: Severe intestinal metaplasia | ||
| WIM: Wild intestinal metaplasia | ||
| Liver | 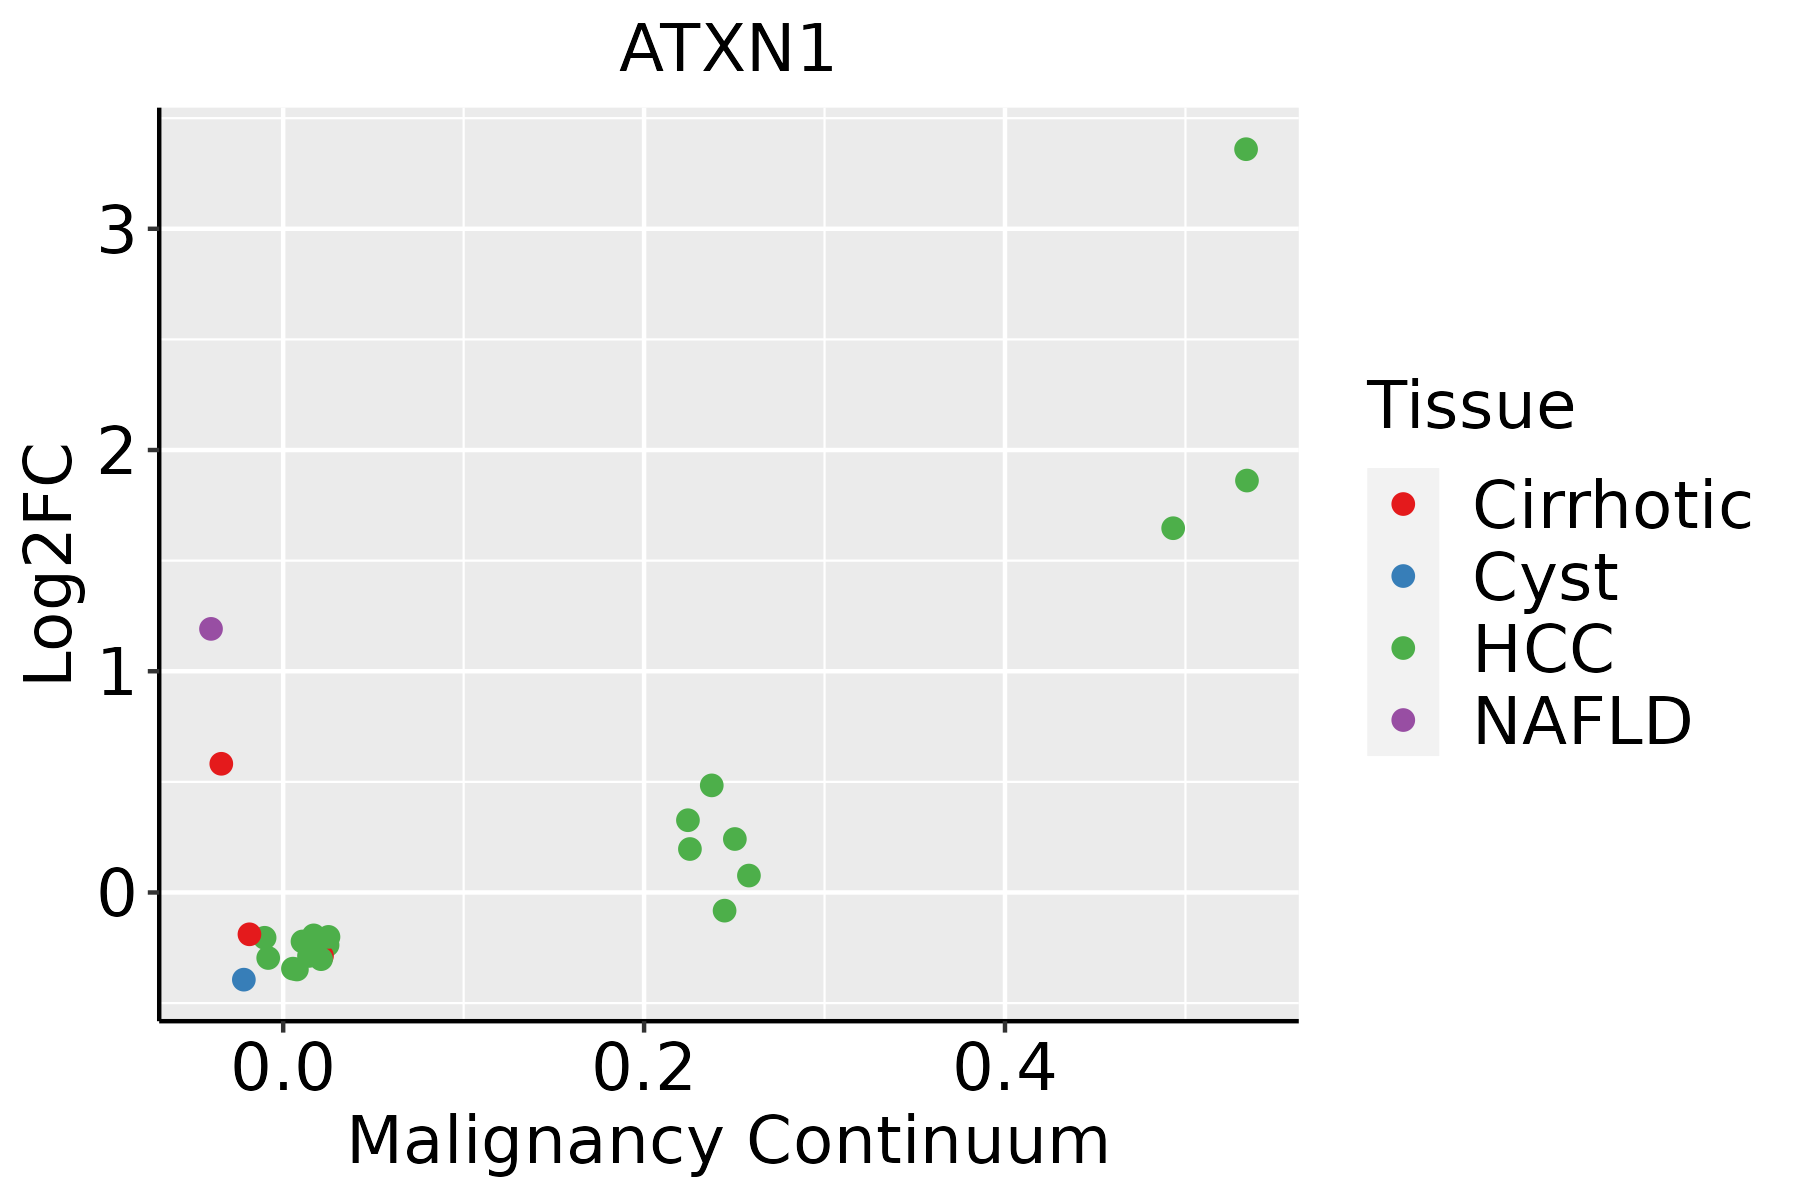 | HCC: Hepatocellular carcinoma |
| NAFLD: Non-alcoholic fatty liver disease | ||
| Lung | 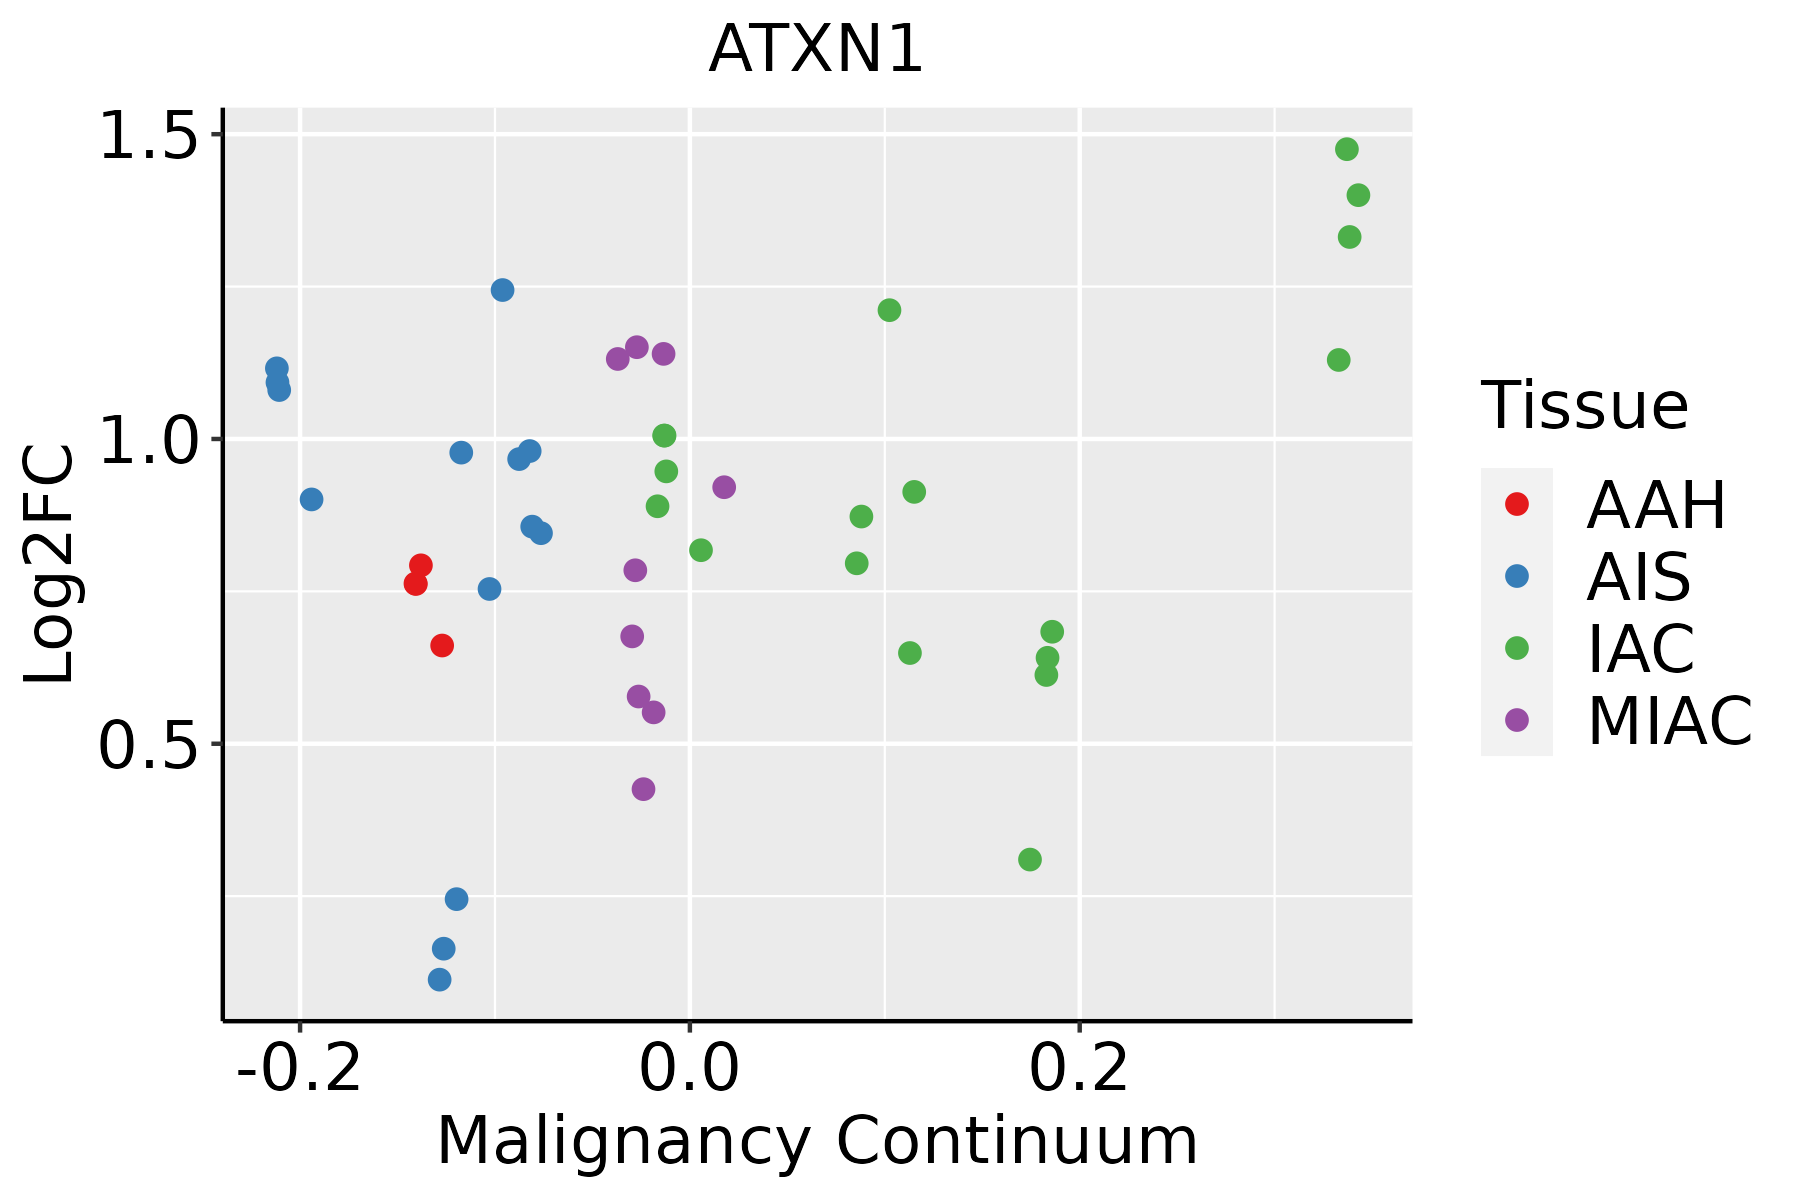 | AAH: Atypical adenomatous hyperplasia |
| AIS: Adenocarcinoma in situ | ||
| IAC: Invasive lung adenocarcinoma | ||
| MIA: Minimally invasive adenocarcinoma | ||
| Oral Cavity | 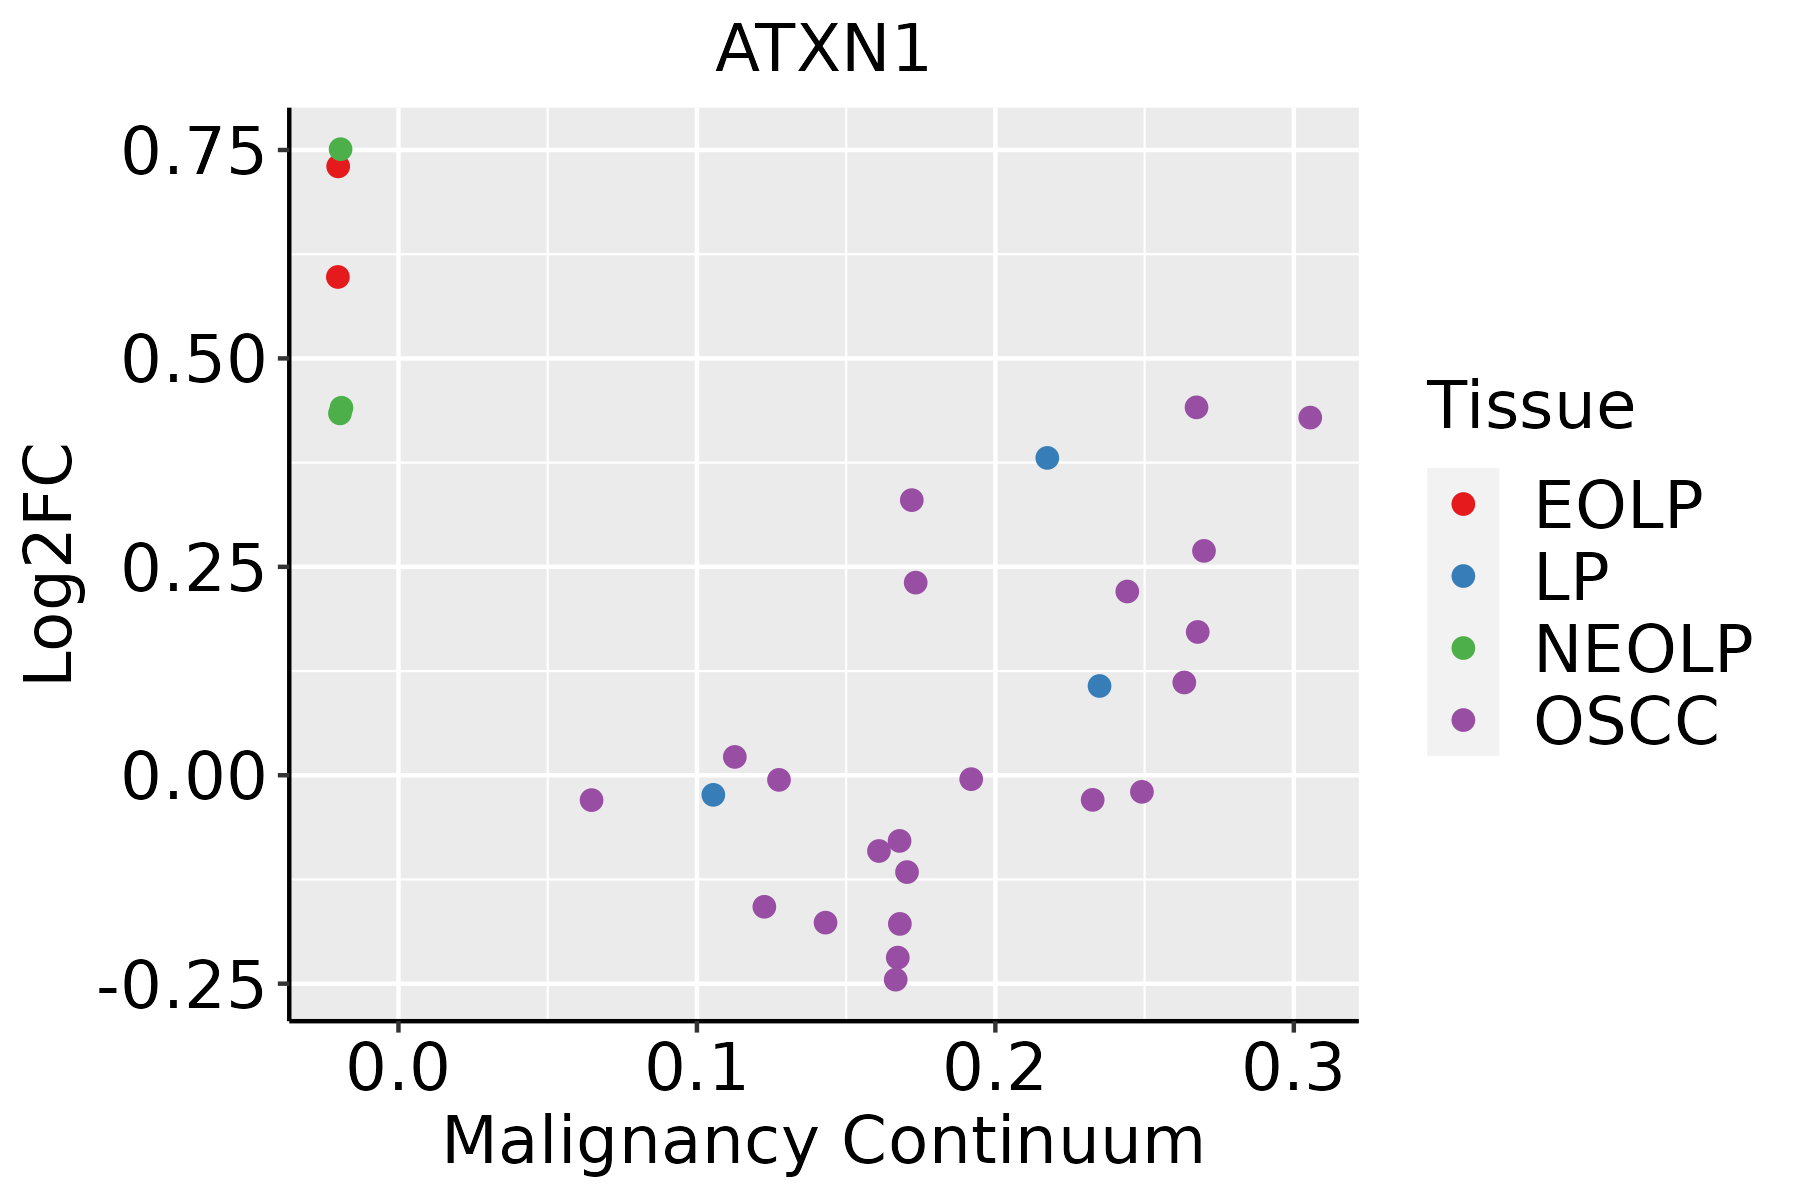 | EOLP: Erosive Oral lichen planus |
| LP: leukoplakia | ||
| NEOLP: Non-erosive oral lichen planus | ||
| OSCC: Oral squamous cell carcinoma | ||
| Prostate | 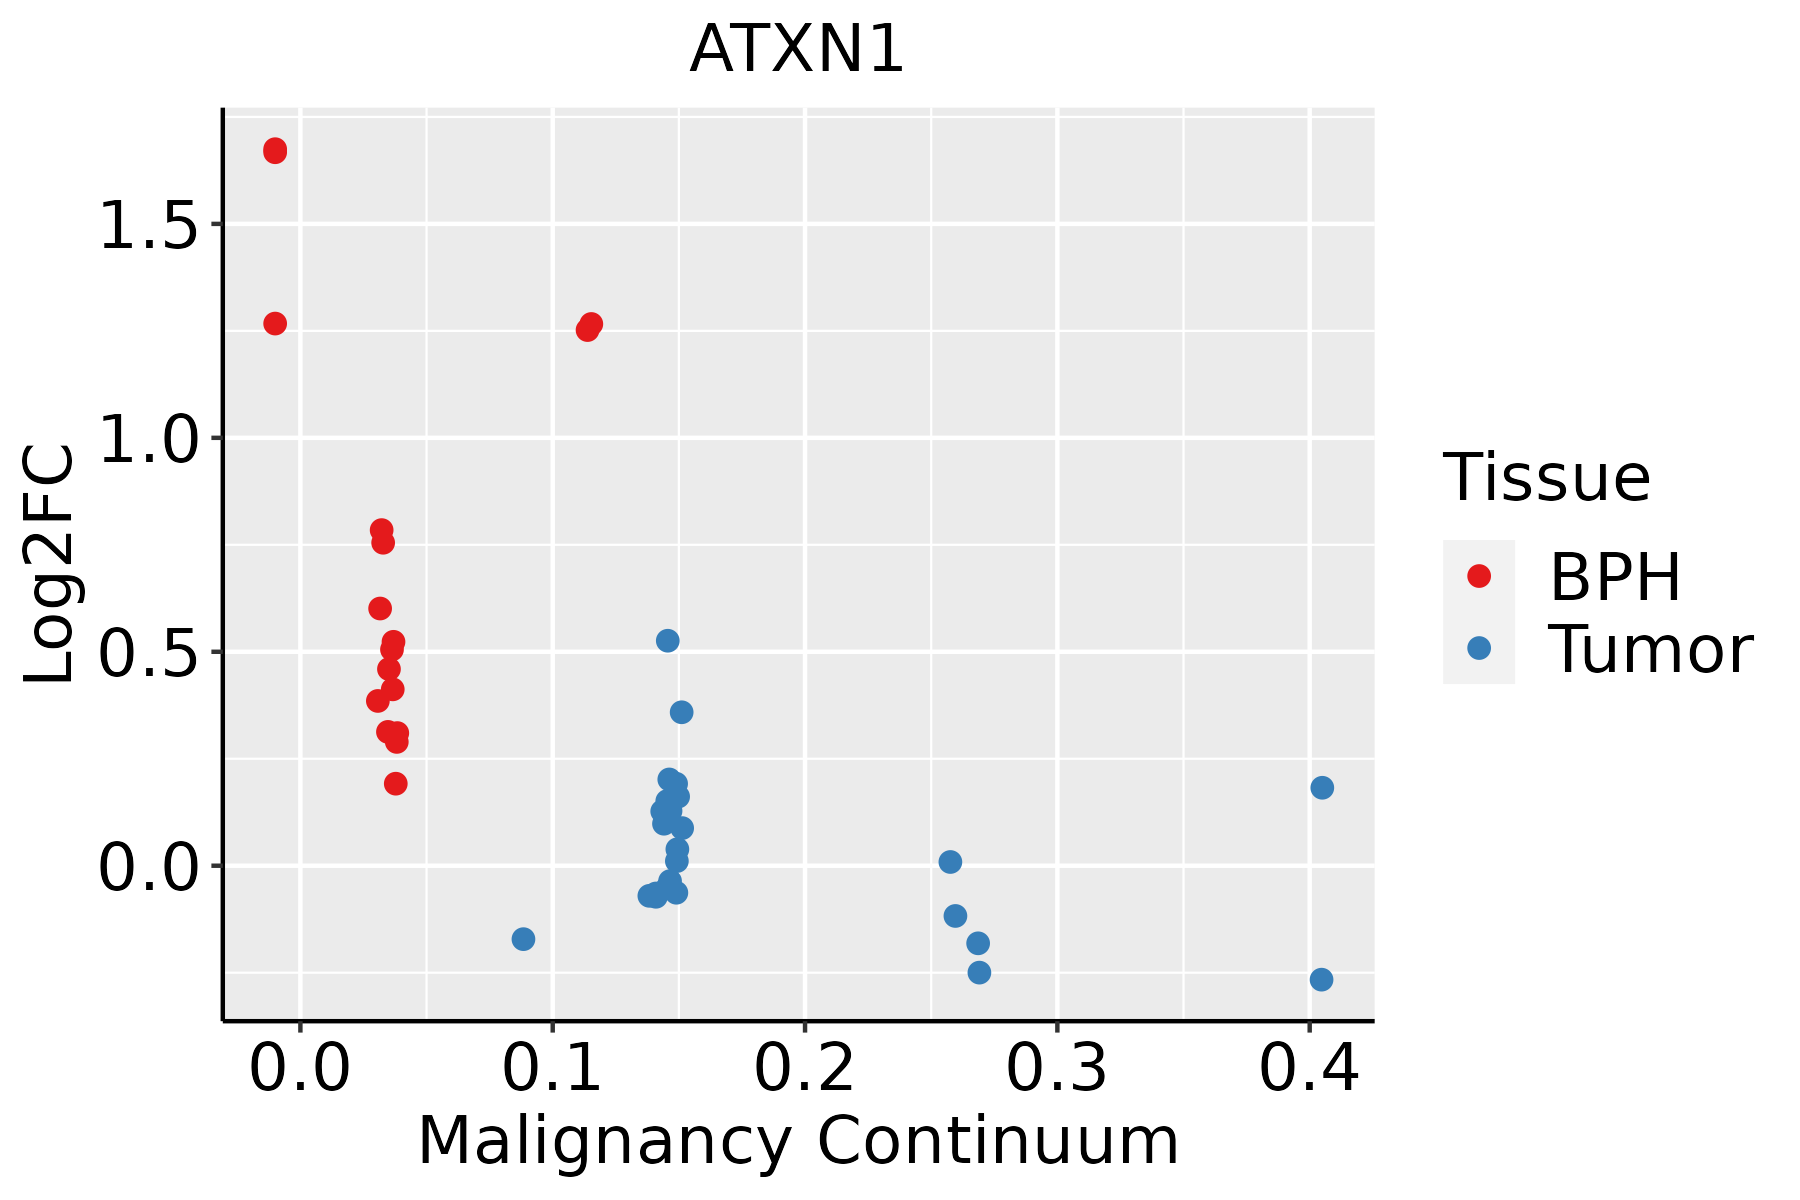 | BPH: Benign Prostatic Hyperplasia |
| Skin | 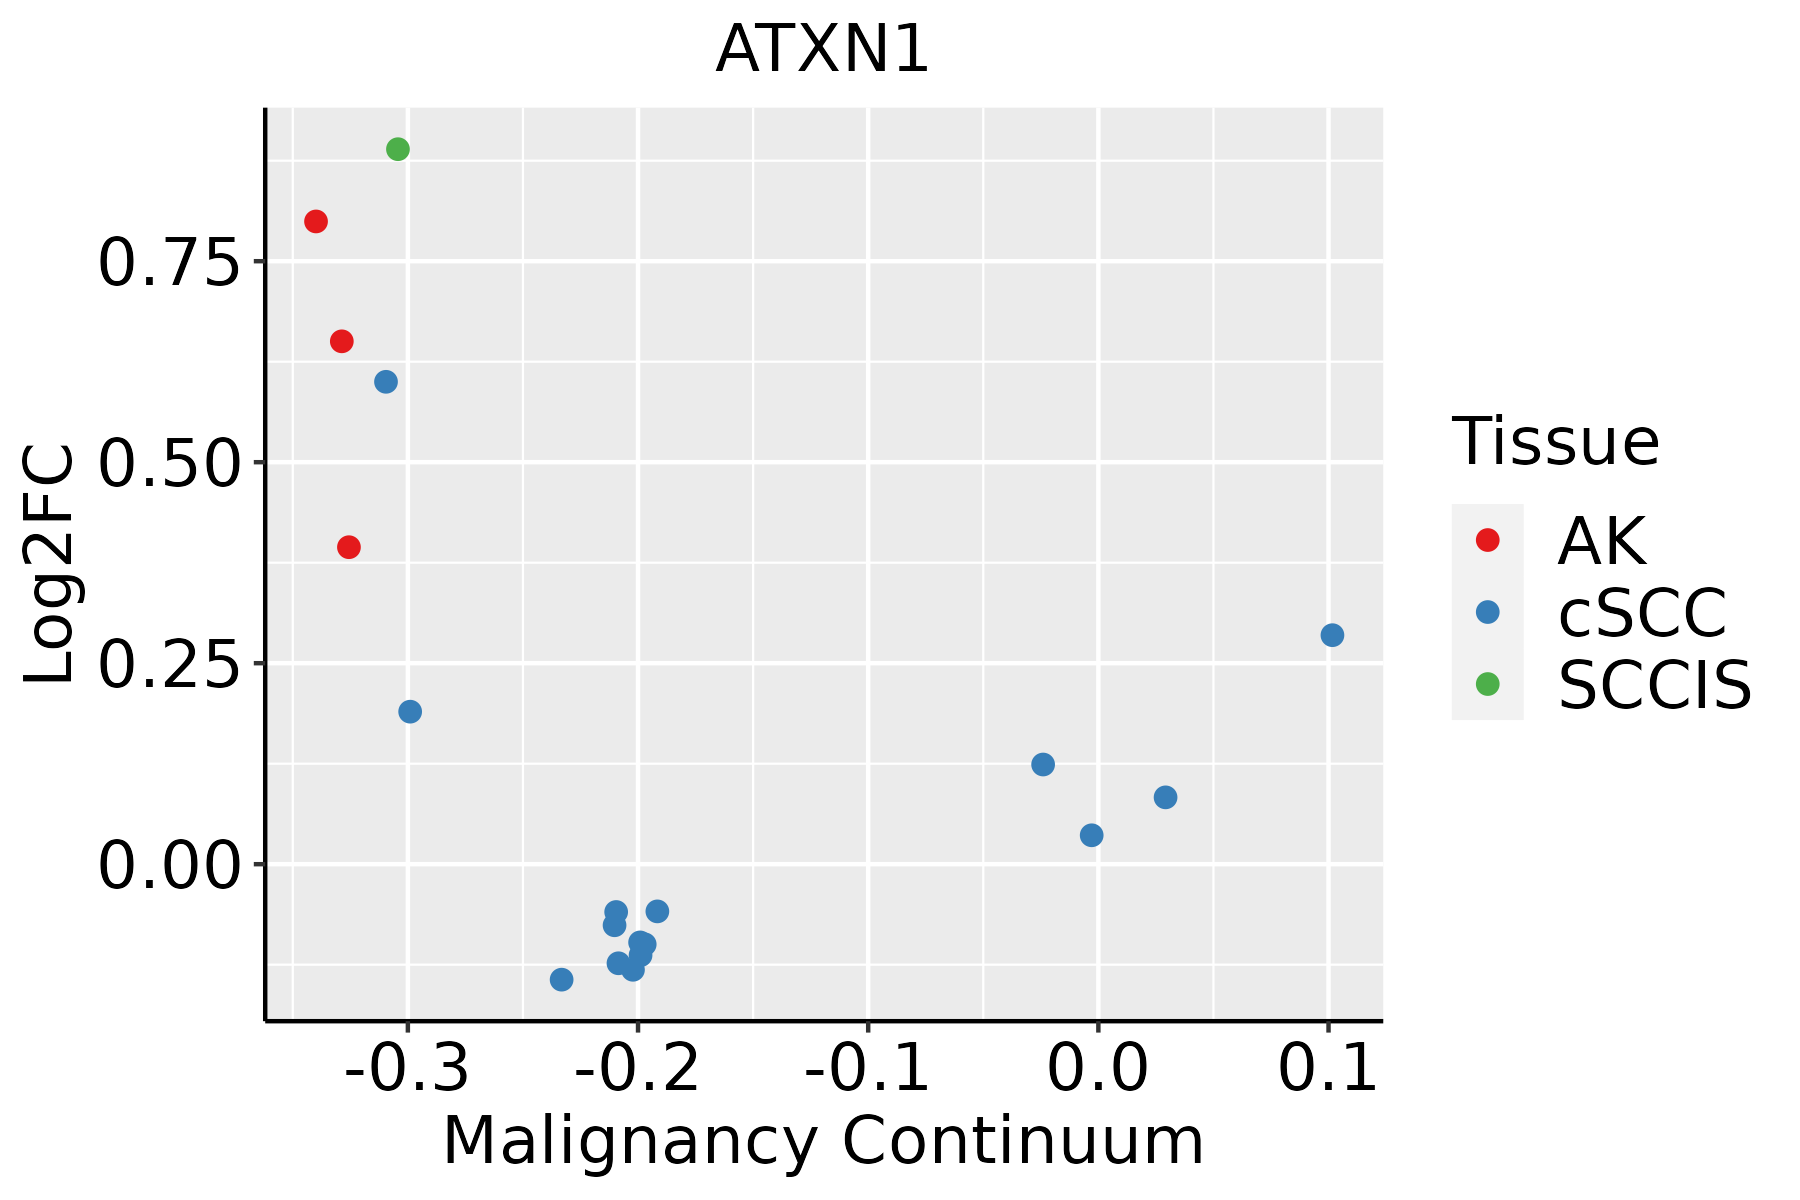 | AK: Actinic keratosis |
| cSCC: Cutaneous squamous cell carcinoma | ||
| SCCIS:squamous cell carcinoma in situ | ||
| Thyroid | 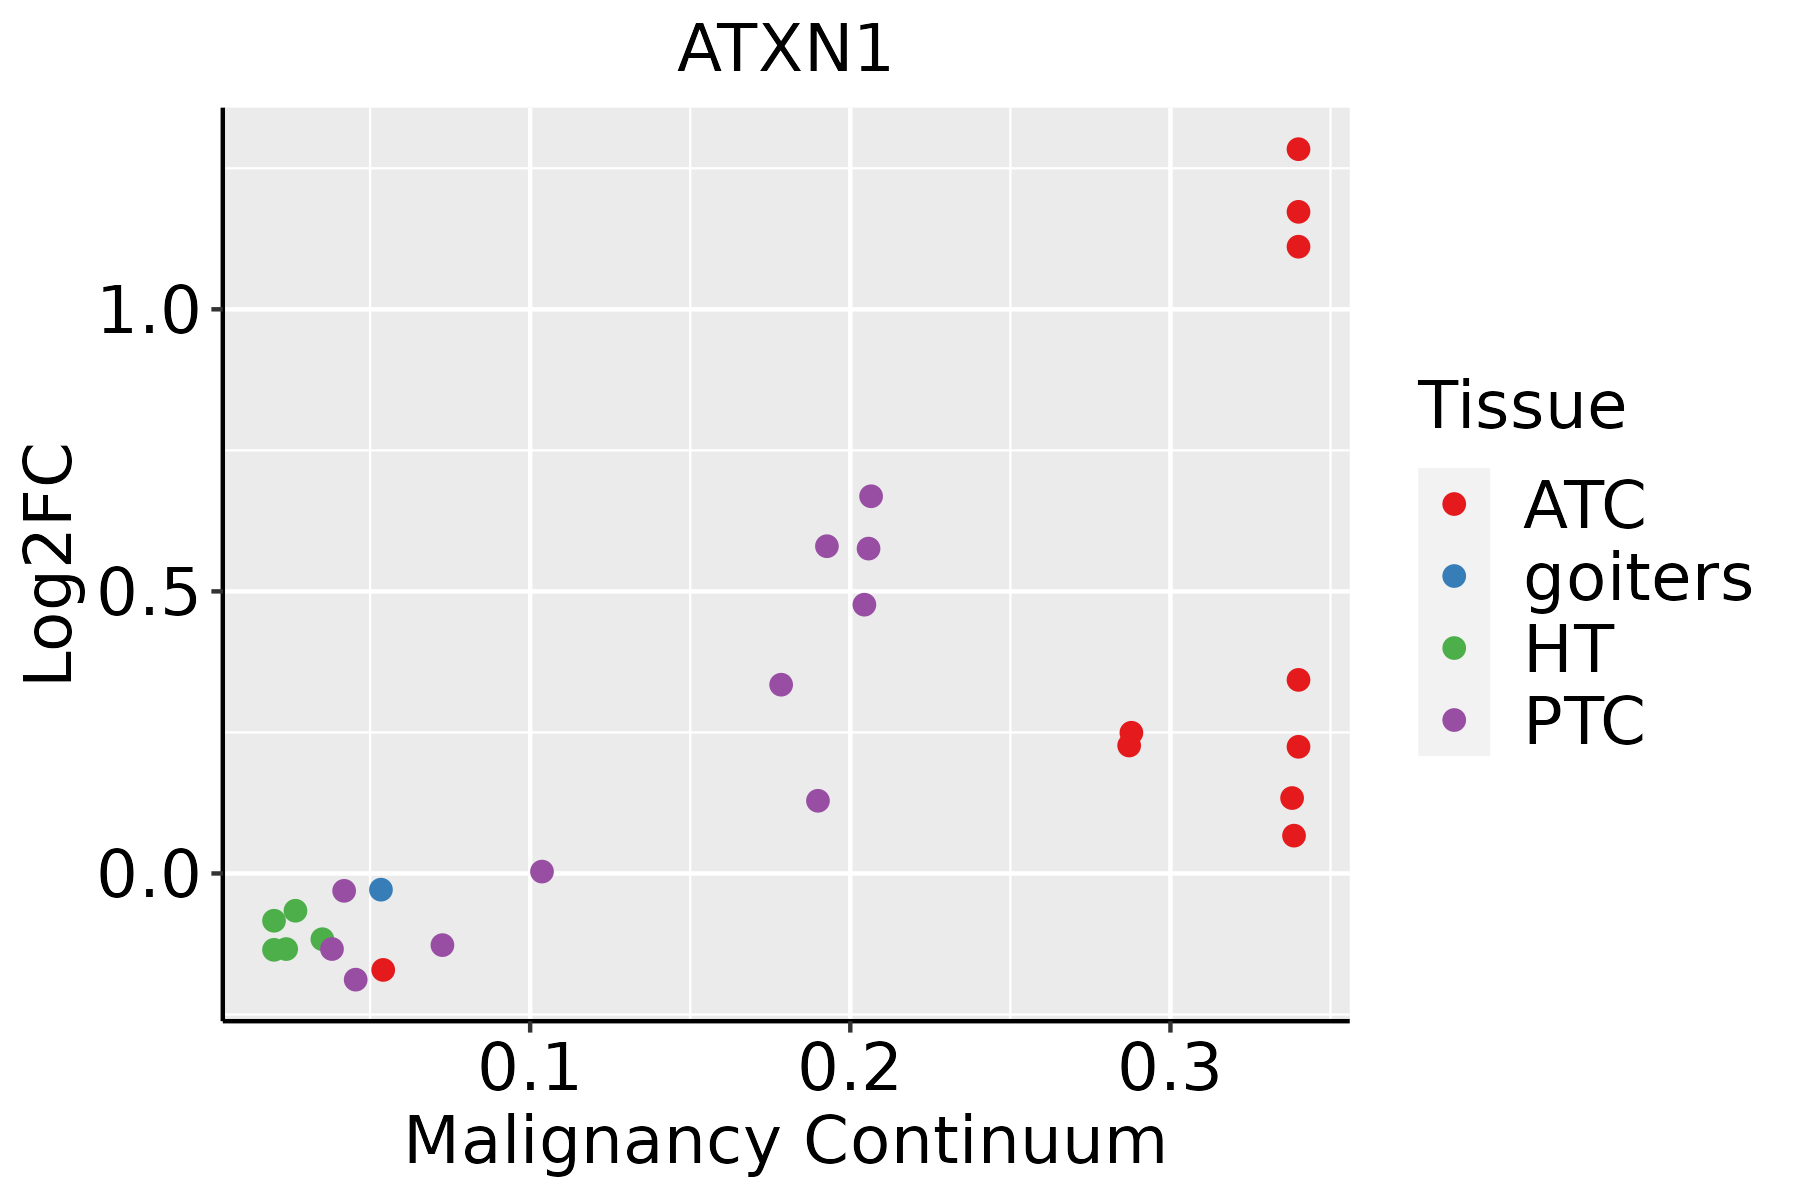 | ATC: Anaplastic thyroid cancer |
| HT: Hashimoto's thyroiditis | ||
| PTC: Papillary thyroid cancer |
| ∗log2FC in expression of this searched gene in stem-like cells from each diseased tissue sample relative to stem-like cells in normal samples in each tissue plotted against the malignancy continuum. Samples are colored based on if they are from different disease stage. |
Top |
Malignant transformation related pathway analysis |
| Find out the enriched GO biological processes and KEGG pathways involved in transition from healthy to precancer to cancer |
| Tissue | Disease Stage | Enriched GO biological Processes |
| Colorectum | AD |  |
| Colorectum | SER |  |
| Colorectum | MSS |  |
| Colorectum | MSI-H |  |
| Colorectum | FAP |  |
| ∗Top 15 enriched GO BP terms are showed in the bar plot of each disease state in each tissue. Each row represents a significant GO biological process which is colored according to the -log10(p.adjust). |
| Page: 1 2 3 4 5 6 7 8 9 |
| GO ID | Tissue | Disease Stage | Description | Gene Ratio | Bg Ratio | pvalue | p.adjust | Count |
| GO:00069139 | Cervix | CC | nucleocytoplasmic transport | 71/2311 | 301/18723 | 4.04e-08 | 2.54e-06 | 71 |
| GO:00511699 | Cervix | CC | nuclear transport | 71/2311 | 301/18723 | 4.04e-08 | 2.54e-06 | 71 |
| GO:00511689 | Cervix | CC | nuclear export | 38/2311 | 154/18723 | 1.86e-05 | 3.46e-04 | 38 |
| GO:0006913 | Colorectum | AD | nucleocytoplasmic transport | 102/3918 | 301/18723 | 1.00e-07 | 4.85e-06 | 102 |
| GO:0051169 | Colorectum | AD | nuclear transport | 102/3918 | 301/18723 | 1.00e-07 | 4.85e-06 | 102 |
| GO:0051168 | Colorectum | AD | nuclear export | 53/3918 | 154/18723 | 6.89e-05 | 1.11e-03 | 53 |
| GO:00069131 | Colorectum | SER | nucleocytoplasmic transport | 77/2897 | 301/18723 | 3.39e-06 | 1.32e-04 | 77 |
| GO:00511691 | Colorectum | SER | nuclear transport | 77/2897 | 301/18723 | 3.39e-06 | 1.32e-04 | 77 |
| GO:00511681 | Colorectum | SER | nuclear export | 42/2897 | 154/18723 | 1.19e-04 | 2.46e-03 | 42 |
| GO:00069132 | Colorectum | MSS | nucleocytoplasmic transport | 99/3467 | 301/18723 | 1.35e-09 | 1.03e-07 | 99 |
| GO:00511692 | Colorectum | MSS | nuclear transport | 99/3467 | 301/18723 | 1.35e-09 | 1.03e-07 | 99 |
| GO:00511682 | Colorectum | MSS | nuclear export | 51/3467 | 154/18723 | 1.01e-05 | 2.43e-04 | 51 |
| GO:00069133 | Colorectum | MSI-H | nucleocytoplasmic transport | 45/1319 | 301/18723 | 1.31e-06 | 8.75e-05 | 45 |
| GO:00511693 | Colorectum | MSI-H | nuclear transport | 45/1319 | 301/18723 | 1.31e-06 | 8.75e-05 | 45 |
| GO:00511683 | Colorectum | MSI-H | nuclear export | 24/1319 | 154/18723 | 1.95e-04 | 5.30e-03 | 24 |
| GO:00069134 | Colorectum | FAP | nucleocytoplasmic transport | 77/2622 | 301/18723 | 6.15e-08 | 4.54e-06 | 77 |
| GO:00511694 | Colorectum | FAP | nuclear transport | 77/2622 | 301/18723 | 6.15e-08 | 4.54e-06 | 77 |
| GO:00511684 | Colorectum | FAP | nuclear export | 37/2622 | 154/18723 | 5.81e-04 | 6.46e-03 | 37 |
| GO:00069135 | Colorectum | CRC | nucleocytoplasmic transport | 57/2078 | 301/18723 | 3.71e-05 | 9.18e-04 | 57 |
| GO:00511695 | Colorectum | CRC | nuclear transport | 57/2078 | 301/18723 | 3.71e-05 | 9.18e-04 | 57 |
| Page: 1 2 3 4 5 |
| Pathway ID | Tissue | Disease Stage | Description | Gene Ratio | Bg Ratio | pvalue | p.adjust | qvalue | Count |
| hsa0502218 | Cervix | CC | Pathways of neurodegeneration - multiple diseases | 128/1267 | 476/8465 | 2.87e-12 | 9.29e-11 | 5.50e-11 | 128 |
| hsa0501716 | Cervix | CC | Spinocerebellar ataxia | 35/1267 | 143/8465 | 1.77e-03 | 7.21e-03 | 4.26e-03 | 35 |
| hsa04330 | Cervix | CC | Notch signaling pathway | 17/1267 | 62/8465 | 7.99e-03 | 2.56e-02 | 1.51e-02 | 17 |
| hsa0502219 | Cervix | CC | Pathways of neurodegeneration - multiple diseases | 128/1267 | 476/8465 | 2.87e-12 | 9.29e-11 | 5.50e-11 | 128 |
| hsa0501717 | Cervix | CC | Spinocerebellar ataxia | 35/1267 | 143/8465 | 1.77e-03 | 7.21e-03 | 4.26e-03 | 35 |
| hsa043301 | Cervix | CC | Notch signaling pathway | 17/1267 | 62/8465 | 7.99e-03 | 2.56e-02 | 1.51e-02 | 17 |
| hsa05022 | Colorectum | AD | Pathways of neurodegeneration - multiple diseases | 201/2092 | 476/8465 | 4.54e-18 | 1.27e-16 | 8.09e-17 | 201 |
| hsa05017 | Colorectum | AD | Spinocerebellar ataxia | 60/2092 | 143/8465 | 3.78e-06 | 4.35e-05 | 2.78e-05 | 60 |
| hsa050221 | Colorectum | AD | Pathways of neurodegeneration - multiple diseases | 201/2092 | 476/8465 | 4.54e-18 | 1.27e-16 | 8.09e-17 | 201 |
| hsa050171 | Colorectum | AD | Spinocerebellar ataxia | 60/2092 | 143/8465 | 3.78e-06 | 4.35e-05 | 2.78e-05 | 60 |
| hsa050222 | Colorectum | SER | Pathways of neurodegeneration - multiple diseases | 168/1580 | 476/8465 | 6.23e-19 | 2.07e-17 | 1.50e-17 | 168 |
| hsa050172 | Colorectum | SER | Spinocerebellar ataxia | 46/1580 | 143/8465 | 6.78e-05 | 7.51e-04 | 5.45e-04 | 46 |
| hsa050223 | Colorectum | SER | Pathways of neurodegeneration - multiple diseases | 168/1580 | 476/8465 | 6.23e-19 | 2.07e-17 | 1.50e-17 | 168 |
| hsa050173 | Colorectum | SER | Spinocerebellar ataxia | 46/1580 | 143/8465 | 6.78e-05 | 7.51e-04 | 5.45e-04 | 46 |
| hsa050224 | Colorectum | MSS | Pathways of neurodegeneration - multiple diseases | 192/1875 | 476/8465 | 2.79e-20 | 1.04e-18 | 6.36e-19 | 192 |
| hsa050174 | Colorectum | MSS | Spinocerebellar ataxia | 60/1875 | 143/8465 | 7.14e-08 | 1.26e-06 | 7.71e-07 | 60 |
| hsa050225 | Colorectum | MSS | Pathways of neurodegeneration - multiple diseases | 192/1875 | 476/8465 | 2.79e-20 | 1.04e-18 | 6.36e-19 | 192 |
| hsa050175 | Colorectum | MSS | Spinocerebellar ataxia | 60/1875 | 143/8465 | 7.14e-08 | 1.26e-06 | 7.71e-07 | 60 |
| hsa050226 | Colorectum | MSI-H | Pathways of neurodegeneration - multiple diseases | 107/797 | 476/8465 | 1.24e-18 | 5.72e-17 | 4.80e-17 | 107 |
| hsa050176 | Colorectum | MSI-H | Spinocerebellar ataxia | 33/797 | 143/8465 | 8.28e-07 | 1.49e-05 | 1.25e-05 | 33 |
| Page: 1 2 3 4 5 |
Top |
Cell-cell communication analysis |
| Identification of potential cell-cell interactions between two cell types and their ligand-receptor pairs for different disease states |
| Ligand | Receptor | LRpair | Pathway | Tissue | Disease Stage |
| Page: 1 |
Top |
Single-cell gene regulatory network inference analysis |
| Find out the significant the regulons (TFs) and the target genes of each regulon across cell types for different disease states |
| TF | Cell Type | Tissue | Disease Stage | Target Gene | RSS | Regulon Activity |
| ∗The dot plots of a searched regulon are shown for all cell subpopulations in each disease state of each tissue based on the regulon specific score inferred using pySCENIC and by calculating the average expression. |
| Page: 1 |
Top |
Somatic mutation of malignant transformation related genes |
| Annotation of somatic variants for genes involved in malignant transformation |
| Hugo Symbol | Variant Class | Variant Classification | dbSNP RS | HGVSc | HGVSp | HGVSp Short | SWISSPROT | BIOTYPE | SIFT | PolyPhen | Tumor Sample Barcode | Tissue | Histology | Sex | Age | Stage | Therapy Types | Drugs | Outcome |
| ATXN1 | SNV | Missense_Mutation | novel | c.1103C>T | p.Ser368Leu | p.S368L | P54253 | protein_coding | deleterious(0.01) | benign(0.01) | TCGA-3C-AALI-01 | Breast | breast invasive carcinoma | Female | <65 | I/II | Unspecific | Poly E | Complete Response |
| ATXN1 | SNV | Missense_Mutation | c.1633N>A | p.Pro545Thr | p.P545T | P54253 | protein_coding | tolerated(0.13) | benign(0.115) | TCGA-A2-A25E-01 | Breast | breast invasive carcinoma | Female | <65 | III/IV | Chemotherapy | cytoxan | PD | |
| ATXN1 | SNV | Missense_Mutation | c.77N>G | p.Ser26Cys | p.S26C | P54253 | protein_coding | deleterious(0.02) | probably_damaging(0.956) | TCGA-A8-A07O-01 | Breast | breast invasive carcinoma | Female | <65 | I/II | Chemotherapy | CR | ||
| ATXN1 | SNV | Missense_Mutation | c.115N>T | p.Arg39Trp | p.R39W | P54253 | protein_coding | deleterious(0.01) | possibly_damaging(0.745) | TCGA-A8-A08S-01 | Breast | breast invasive carcinoma | Female | >=65 | I/II | Hormone Therapy | anastrozole | SD | |
| ATXN1 | SNV | Missense_Mutation | rs201023487 | c.995G>A | p.Arg332Gln | p.R332Q | P54253 | protein_coding | tolerated(0.19) | probably_damaging(0.978) | TCGA-AC-A23H-01 | Breast | breast invasive carcinoma | Female | >=65 | I/II | Unknown | Unknown | PD |
| ATXN1 | SNV | Missense_Mutation | rs140709024 | c.976N>A | p.Gly326Ser | p.G326S | P54253 | protein_coding | deleterious(0.01) | probably_damaging(0.999) | TCGA-AN-A0AK-01 | Breast | breast invasive carcinoma | Female | >=65 | I/II | Unknown | Unknown | SD |
| ATXN1 | SNV | Missense_Mutation | rs201516255 | c.1897N>A | p.Val633Ile | p.V633I | P54253 | protein_coding | deleterious(0.01) | benign(0.139) | TCGA-AO-A128-01 | Breast | breast invasive carcinoma | Female | <65 | I/II | Chemotherapy | doxorubicin | SD |
| ATXN1 | SNV | Missense_Mutation | c.320N>T | p.Ala107Val | p.A107V | P54253 | protein_coding | tolerated(0.09) | benign(0.023) | TCGA-BH-A0B3-01 | Breast | breast invasive carcinoma | Female | <65 | I/II | Chemotherapy | cyclophosphamide | SD | |
| ATXN1 | SNV | Missense_Mutation | c.837N>G | p.His279Gln | p.H279Q | P54253 | protein_coding | tolerated(0.24) | possibly_damaging(0.462) | TCGA-BH-A202-01 | Breast | breast invasive carcinoma | Female | <65 | I/II | Chemotherapy | carboplatin | CR | |
| ATXN1 | SNV | Missense_Mutation | c.1550N>T | p.Ala517Val | p.A517V | P54253 | protein_coding | tolerated(0.09) | benign(0.09) | TCGA-D8-A1XQ-01 | Breast | breast invasive carcinoma | Female | >=65 | I/II | Unknown | Unknown | SD |
| Page: 1 2 3 4 5 6 7 8 9 10 11 12 |
Top |
Related drugs of malignant transformation related genes |
| Identification of chemicals and drugs interact with genes involved in malignant transfromation |
| (DGIdb 4.0) |
| Entrez ID | Symbol | Category | Interaction Types | Drug Claim Name | Drug Name | PMIDs |
| Page: 1 |

Copyright 2023-Present -The University of Texas Health Science Center at Houston |