
|
|||||
|
 | |
| |
| |
| |
| |
| |
|
Gene: ATRX |
Gene summary for ATRX |
| Gene information | Species | Human | Gene symbol | ATRX | Gene ID | 546 |
| Gene name | ATRX chromatin remodeler | |
| Gene Alias | JMS | |
| Cytomap | Xq21.1 | |
| Gene Type | protein-coding | GO ID | GO:0000003 | UniProtAcc | A4LAA3 |
Top |
Malignant transformation analysis |
| Identification of the aberrant gene expression in precancerous and cancerous lesions by comparing the gene expression of stem-like cells in diseased tissues with normal stem cells |
| Entrez ID | Symbol | Replicates | Species | Organ | Tissue | Adj P-value | Log2FC | Malignancy |
| 546 | ATRX | CA_HPV_1 | Human | Cervix | CC | 1.12e-07 | -1.65e-01 | 0.0264 |
| 546 | ATRX | CCI_2 | Human | Cervix | CC | 3.51e-07 | 9.03e-01 | 0.5249 |
| 546 | ATRX | CCI_3 | Human | Cervix | CC | 1.77e-05 | 8.00e-01 | 0.516 |
| 546 | ATRX | L1 | Human | Cervix | CC | 9.82e-09 | -3.64e-01 | 0.0802 |
| 546 | ATRX | T3 | Human | Cervix | CC | 2.94e-02 | -2.29e-01 | 0.1389 |
| 546 | ATRX | HTA11_3410_2000001011 | Human | Colorectum | AD | 6.63e-32 | -7.91e-01 | 0.0155 |
| 546 | ATRX | HTA11_2487_2000001011 | Human | Colorectum | SER | 7.31e-11 | -6.61e-01 | -0.1808 |
| 546 | ATRX | HTA11_2951_2000001011 | Human | Colorectum | AD | 4.01e-02 | -6.90e-01 | 0.0216 |
| 546 | ATRX | HTA11_78_2000001011 | Human | Colorectum | AD | 8.46e-03 | -3.80e-01 | -0.1088 |
| 546 | ATRX | HTA11_3361_2000001011 | Human | Colorectum | AD | 1.83e-11 | -7.09e-01 | -0.1207 |
| 546 | ATRX | HTA11_83_2000001011 | Human | Colorectum | SER | 4.85e-08 | -5.91e-01 | -0.1526 |
| 546 | ATRX | HTA11_696_2000001011 | Human | Colorectum | AD | 3.21e-18 | -5.43e-01 | -0.1464 |
| 546 | ATRX | HTA11_866_2000001011 | Human | Colorectum | AD | 2.08e-12 | -4.01e-01 | -0.1001 |
| 546 | ATRX | HTA11_1391_2000001011 | Human | Colorectum | AD | 5.96e-06 | -4.72e-01 | -0.059 |
| 546 | ATRX | HTA11_5212_2000001011 | Human | Colorectum | AD | 3.11e-07 | -7.99e-01 | -0.2061 |
| 546 | ATRX | HTA11_5216_2000001011 | Human | Colorectum | SER | 1.96e-02 | -7.16e-01 | -0.1462 |
| 546 | ATRX | HTA11_546_2000001011 | Human | Colorectum | AD | 2.07e-09 | -6.11e-01 | -0.0842 |
| 546 | ATRX | HTA11_7862_2000001011 | Human | Colorectum | AD | 4.50e-10 | -7.91e-01 | -0.0179 |
| 546 | ATRX | HTA11_866_3004761011 | Human | Colorectum | AD | 1.91e-07 | -4.59e-01 | 0.096 |
| 546 | ATRX | HTA11_4255_2000001011 | Human | Colorectum | SER | 5.43e-04 | -6.13e-01 | 0.0446 |
| Page: 1 2 3 4 5 6 7 8 9 10 11 12 13 |
| Tissue | Expression Dynamics | Abbreviation |
| Cervix | 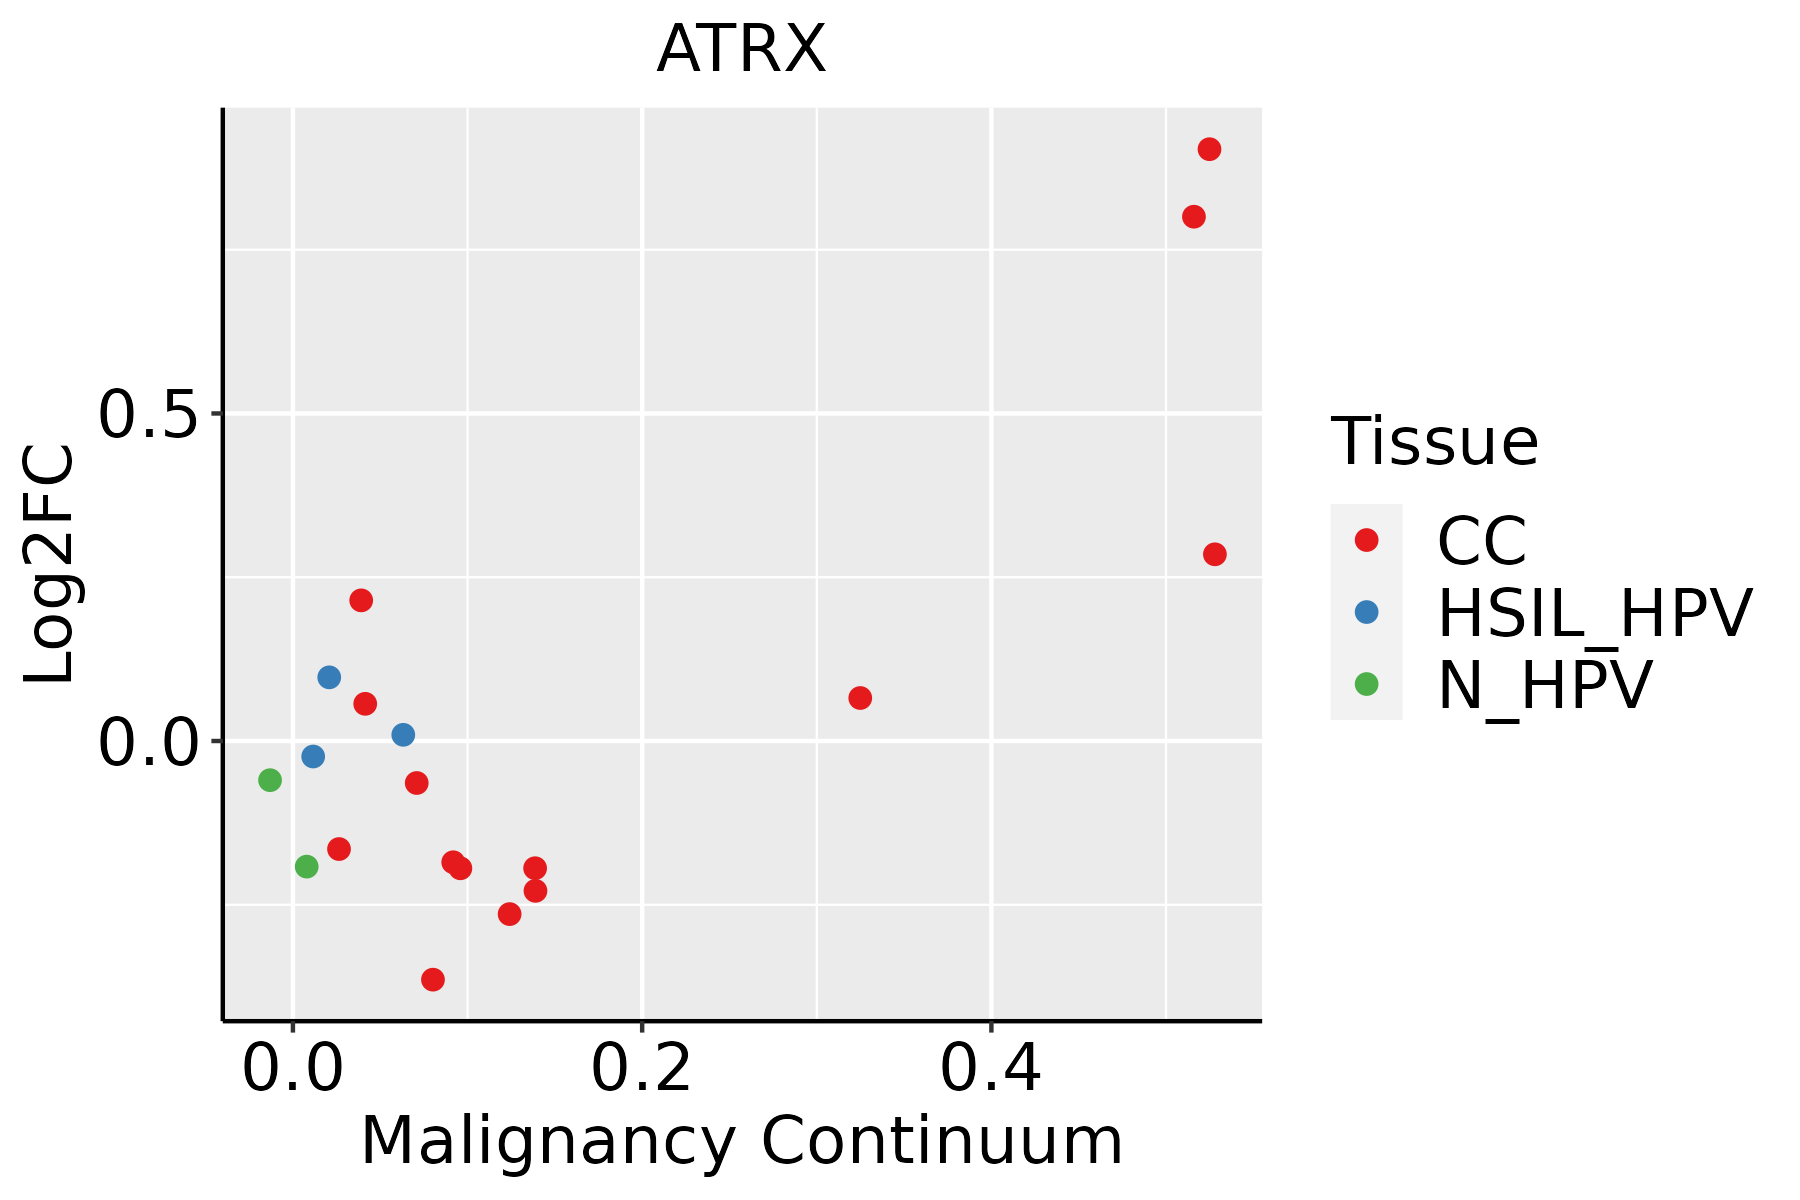 | CC: Cervix cancer |
| HSIL_HPV: HPV-infected high-grade squamous intraepithelial lesions | ||
| N_HPV: HPV-infected normal cervix | ||
| Colorectum (GSE201348) |  | FAP: Familial adenomatous polyposis |
| CRC: Colorectal cancer | ||
| Colorectum (HTA11) |  | AD: Adenomas |
| SER: Sessile serrated lesions | ||
| MSI-H: Microsatellite-high colorectal cancer | ||
| MSS: Microsatellite stable colorectal cancer | ||
| Esophagus | 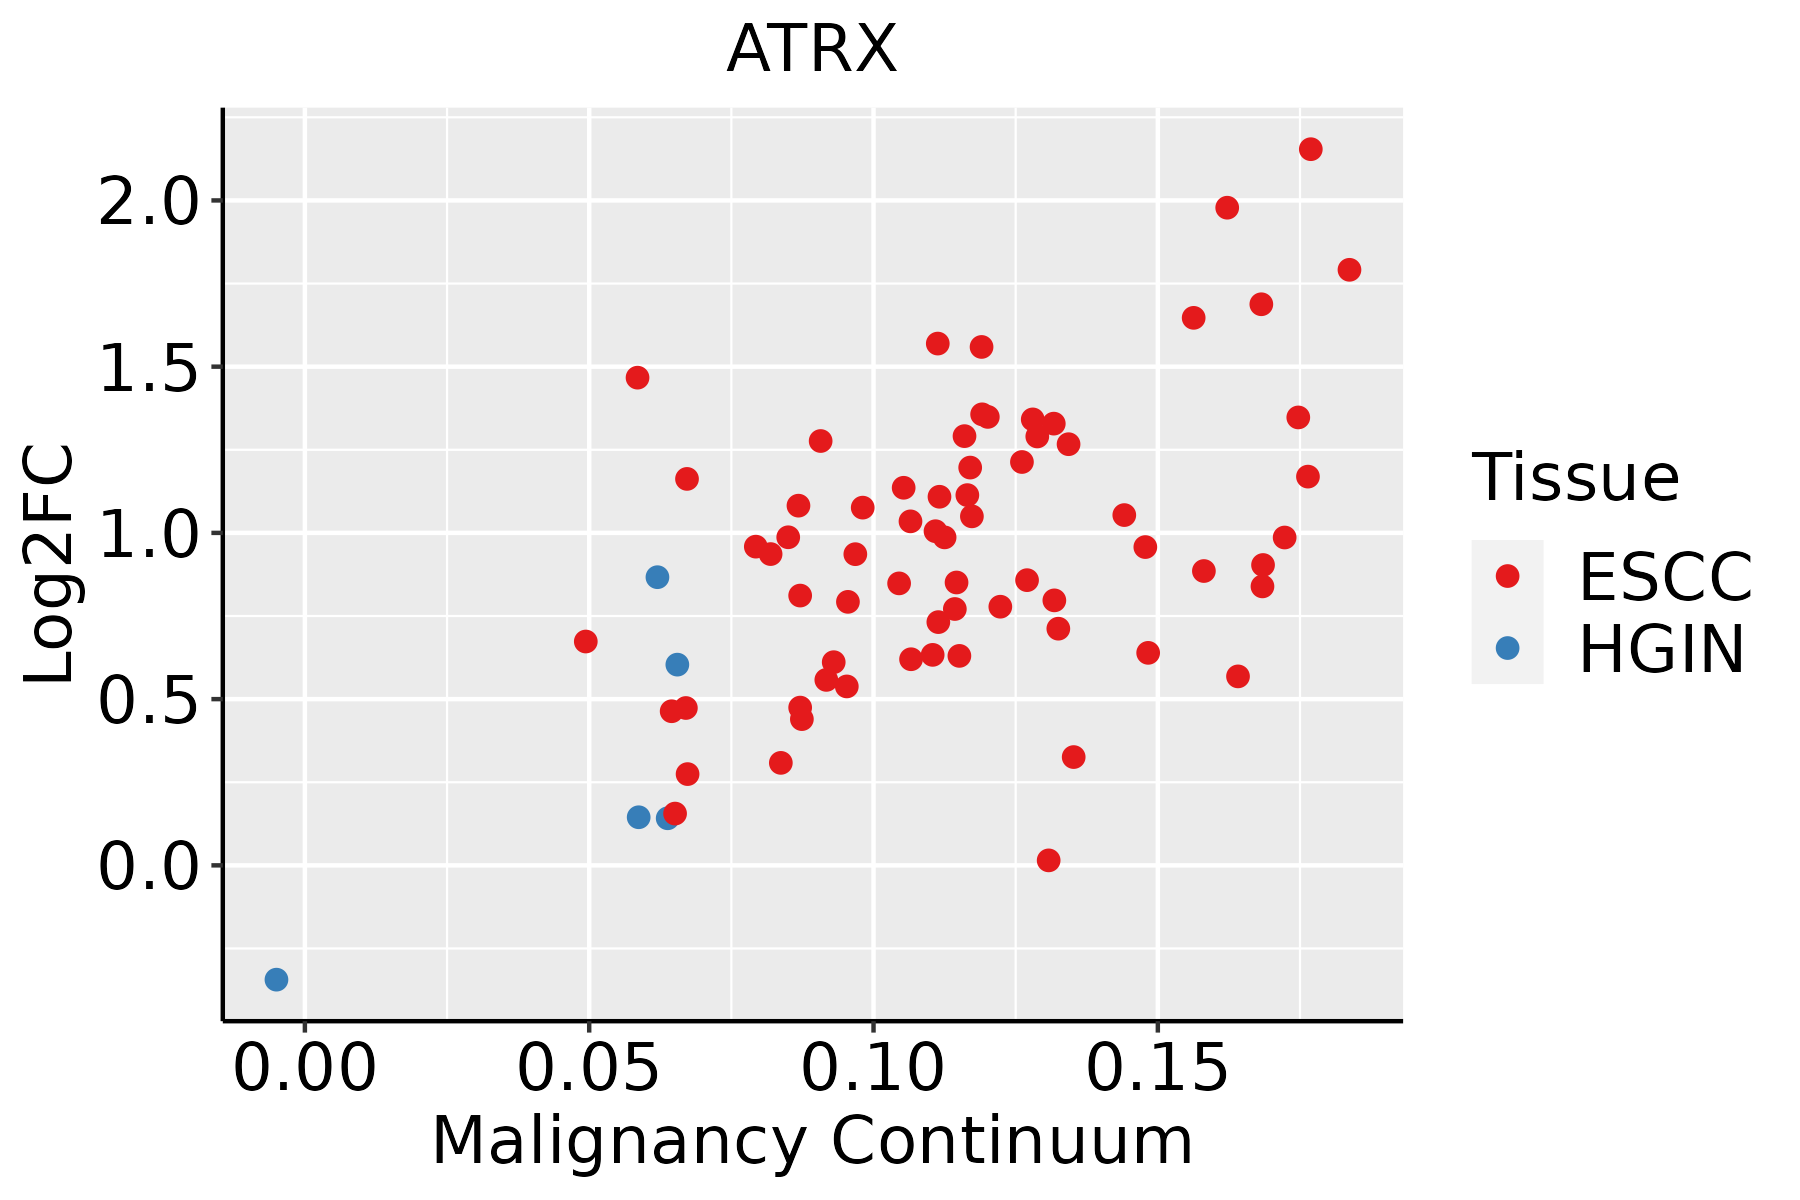 | ESCC: Esophageal squamous cell carcinoma |
| HGIN: High-grade intraepithelial neoplasias | ||
| LGIN: Low-grade intraepithelial neoplasias | ||
| Liver |  | HCC: Hepatocellular carcinoma |
| NAFLD: Non-alcoholic fatty liver disease | ||
| Lung | 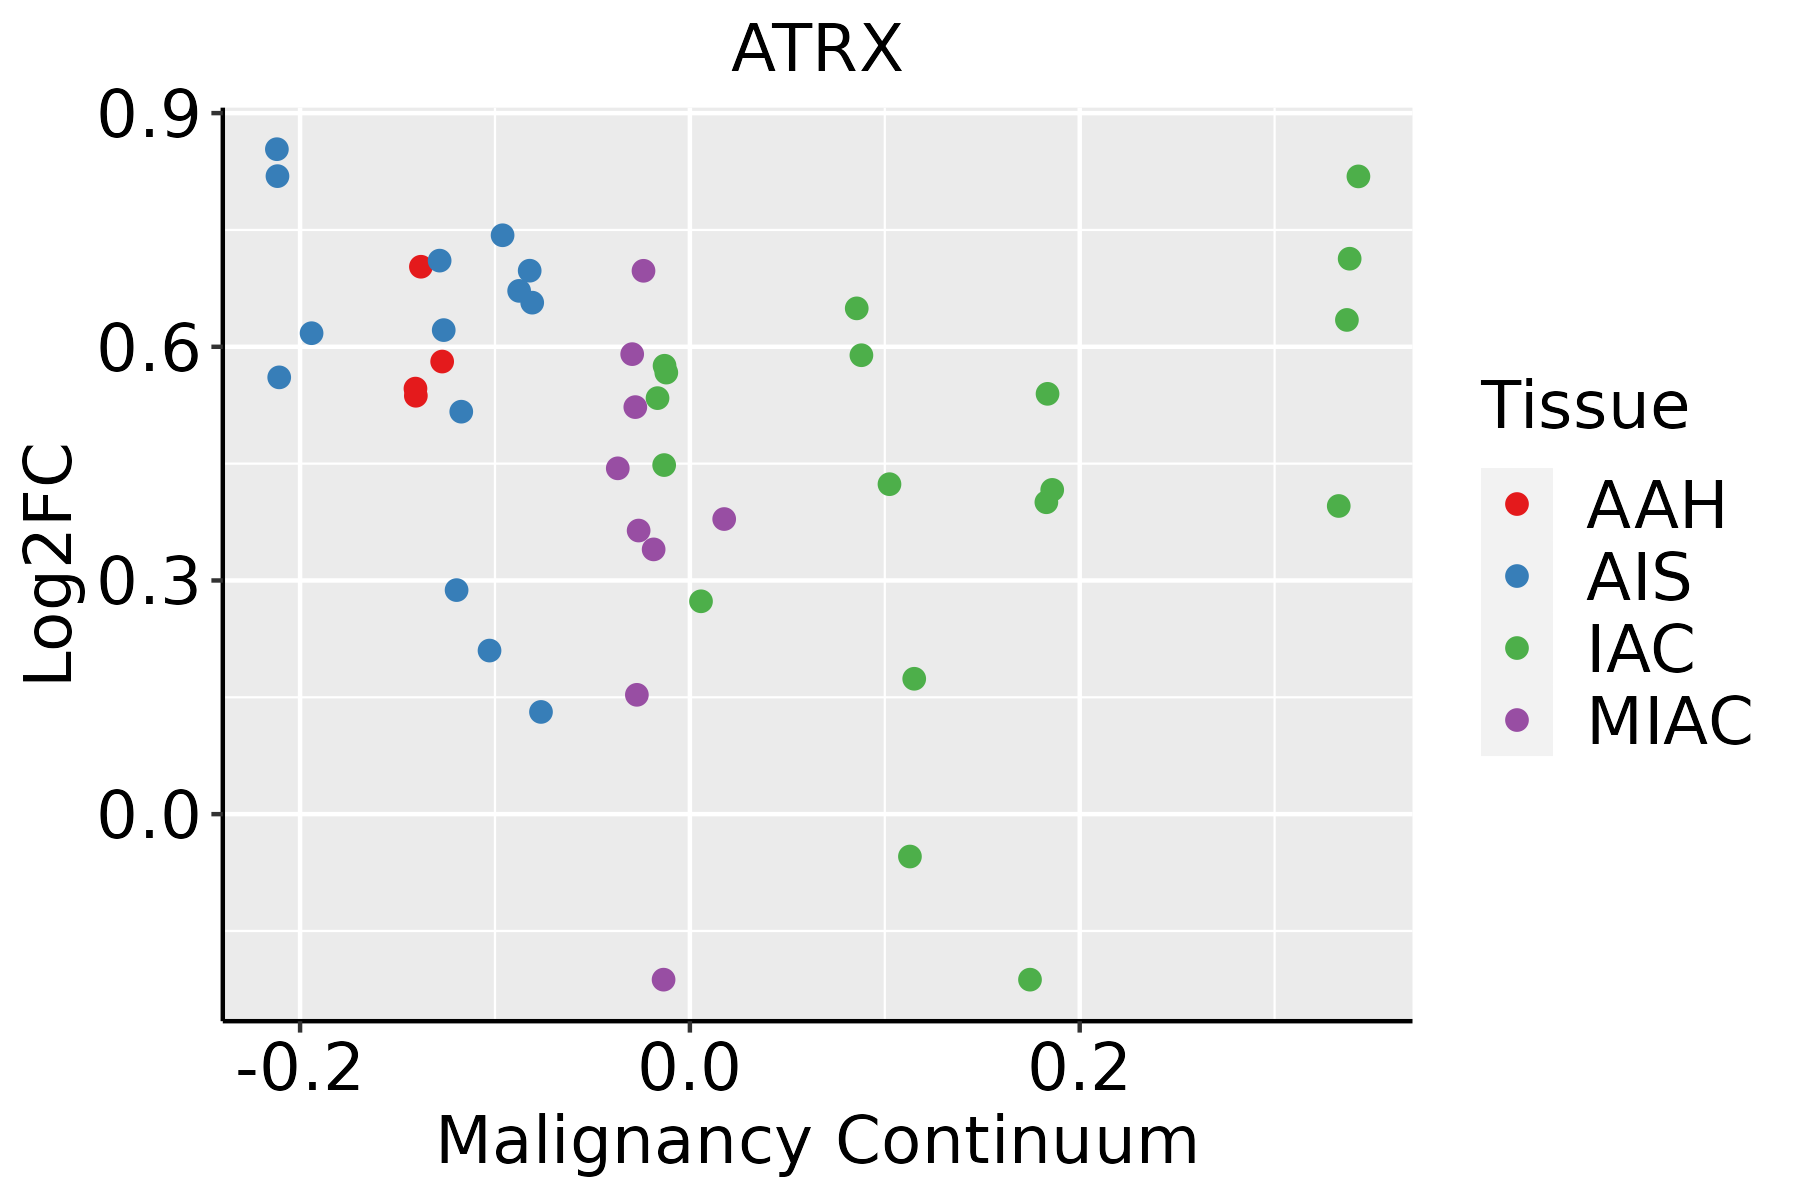 | AAH: Atypical adenomatous hyperplasia |
| AIS: Adenocarcinoma in situ | ||
| IAC: Invasive lung adenocarcinoma | ||
| MIA: Minimally invasive adenocarcinoma | ||
| Oral Cavity | 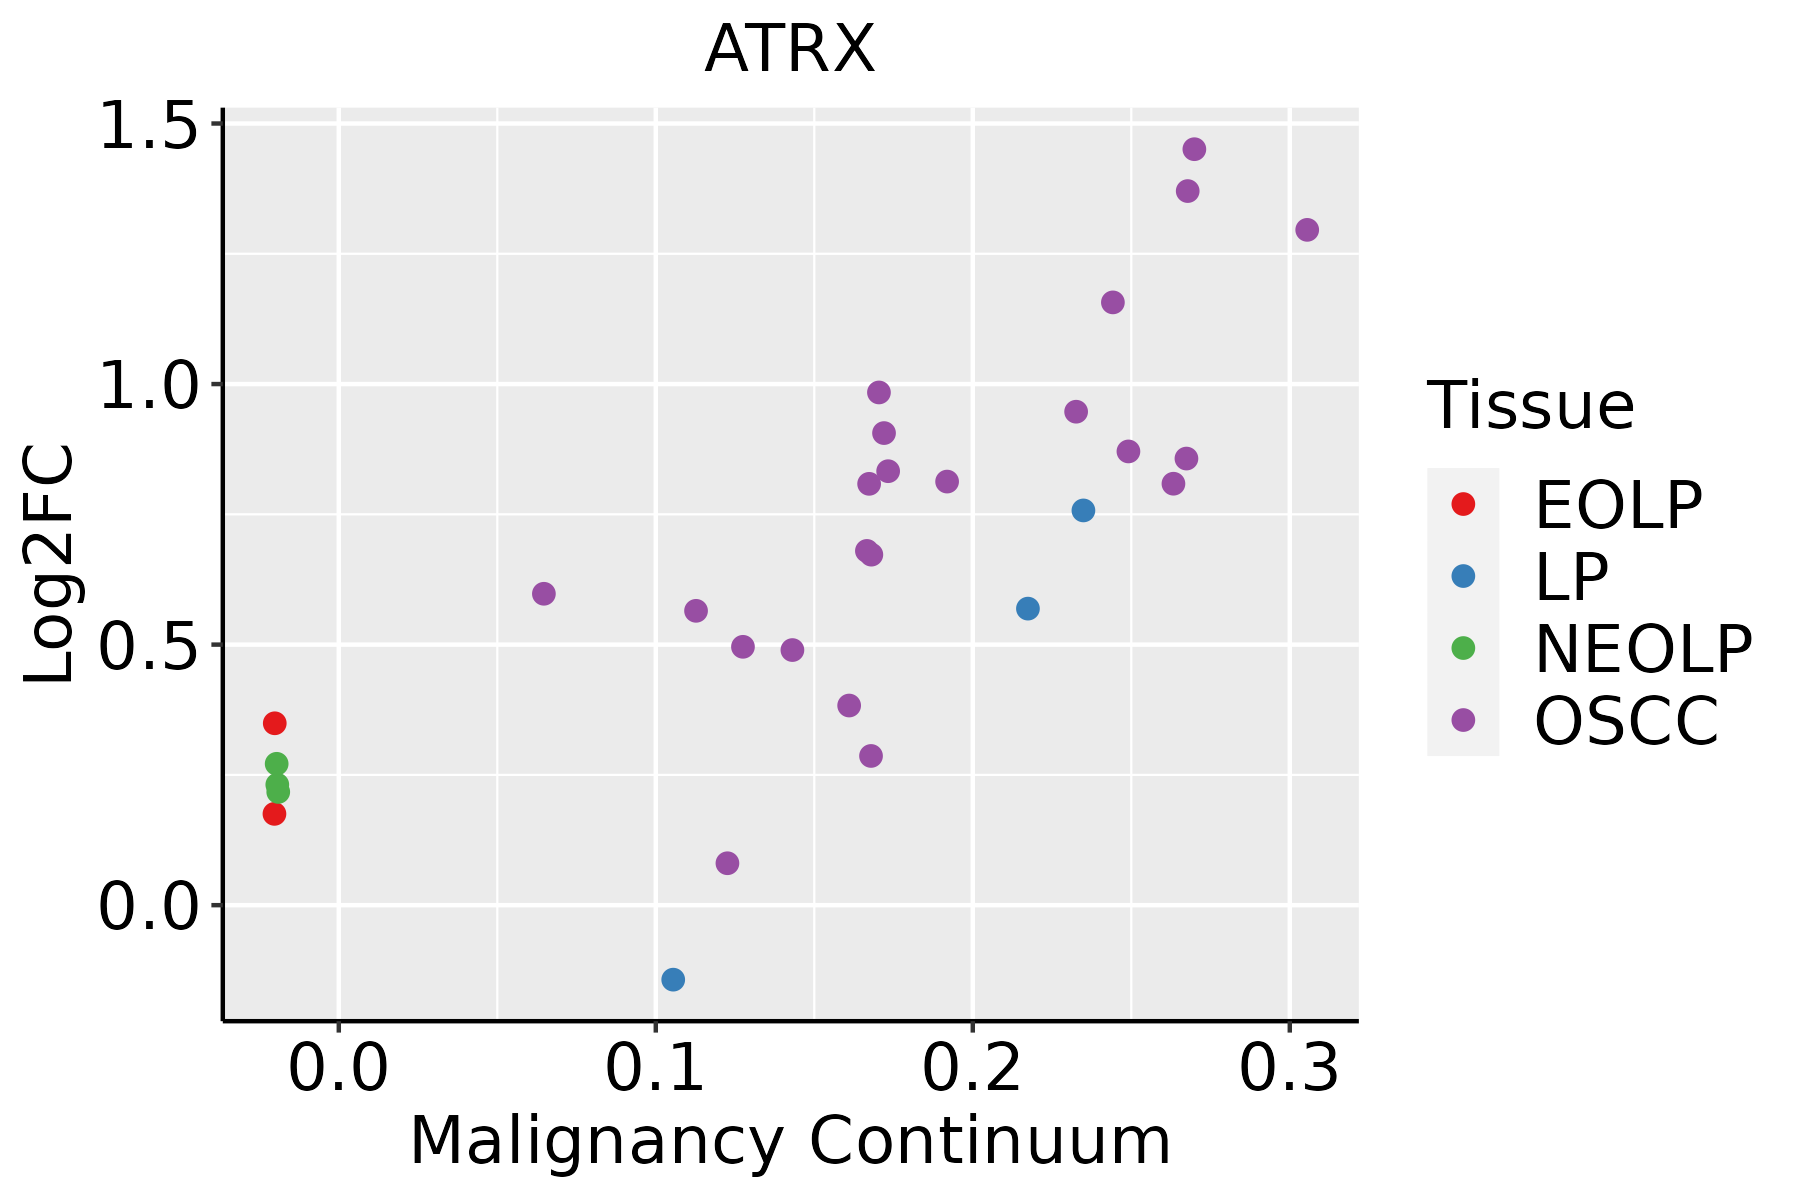 | EOLP: Erosive Oral lichen planus |
| LP: leukoplakia | ||
| NEOLP: Non-erosive oral lichen planus | ||
| OSCC: Oral squamous cell carcinoma | ||
| Prostate |  | BPH: Benign Prostatic Hyperplasia |
| Skin | 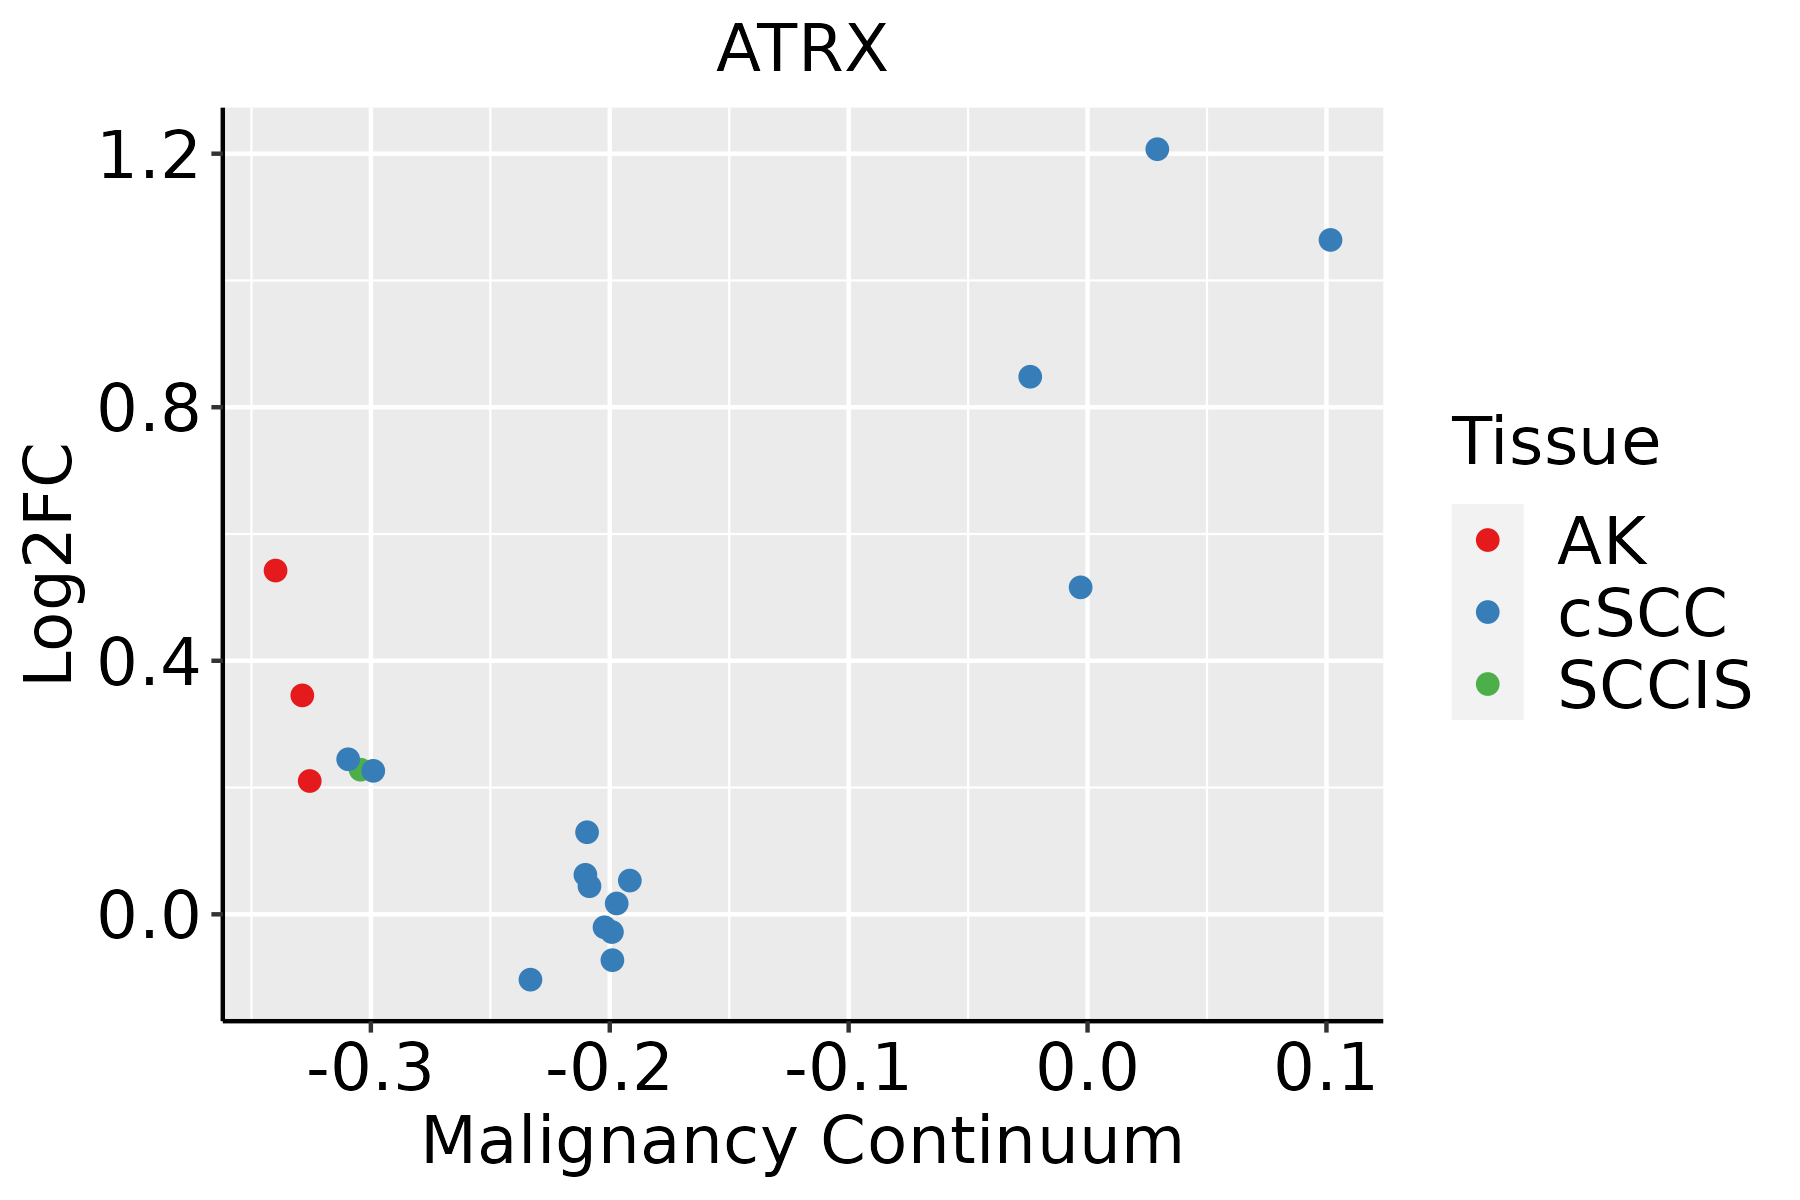 | AK: Actinic keratosis |
| cSCC: Cutaneous squamous cell carcinoma | ||
| SCCIS:squamous cell carcinoma in situ | ||
| Thyroid | 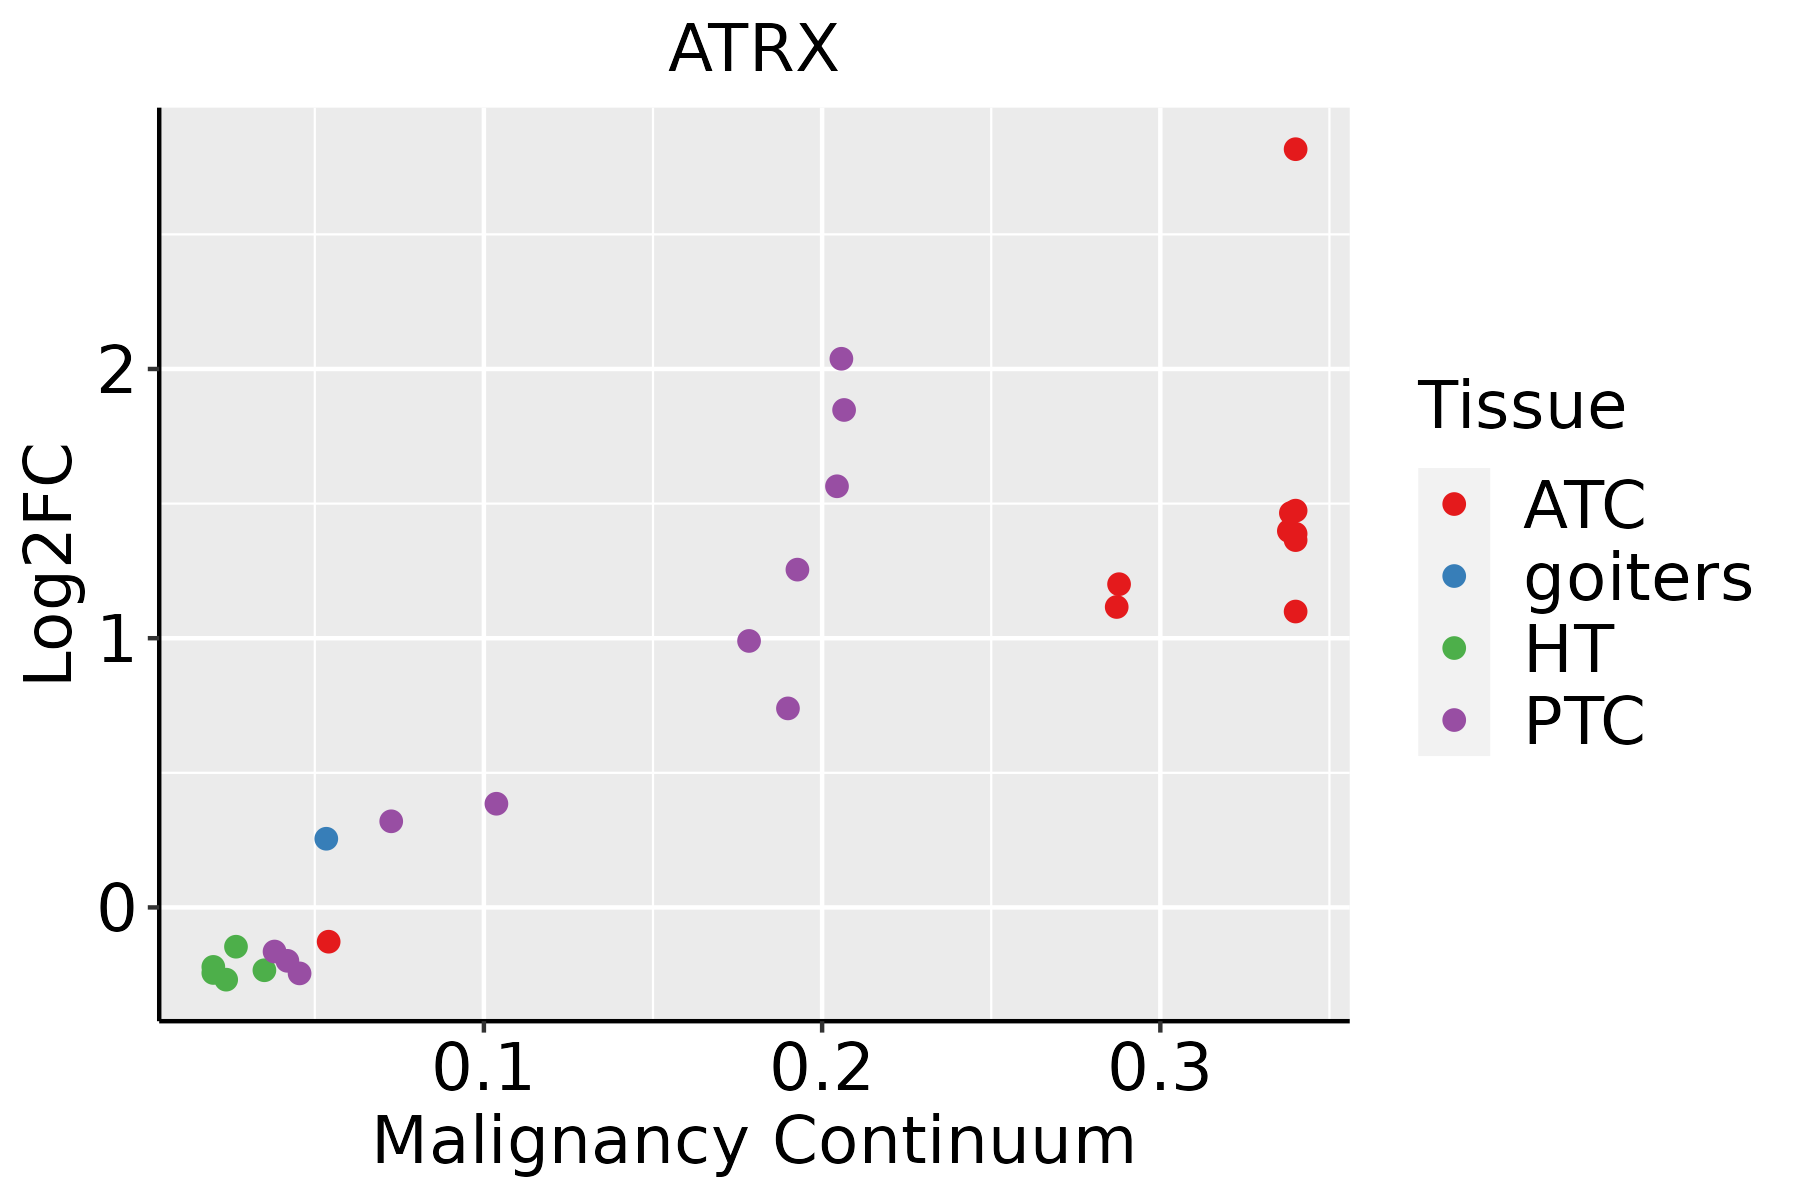 | ATC: Anaplastic thyroid cancer |
| HT: Hashimoto's thyroiditis | ||
| PTC: Papillary thyroid cancer |
| ∗log2FC in expression of this searched gene in stem-like cells from each diseased tissue sample relative to stem-like cells in normal samples in each tissue plotted against the malignancy continuum. Samples are colored based on if they are from different disease stage. |
Top |
Malignant transformation related pathway analysis |
| Find out the enriched GO biological processes and KEGG pathways involved in transition from healthy to precancer to cancer |
| Tissue | Disease Stage | Enriched GO biological Processes |
| Colorectum | AD |  |
| Colorectum | SER |  |
| Colorectum | MSS |  |
| Colorectum | MSI-H |  |
| Colorectum | FAP |  |
| ∗Top 15 enriched GO BP terms are showed in the bar plot of each disease state in each tissue. Each row represents a significant GO biological process which is colored according to the -log10(p.adjust). |
| Page: 1 2 3 4 5 6 7 8 9 |
| GO ID | Tissue | Disease Stage | Description | Gene Ratio | Bg Ratio | pvalue | p.adjust | Count |
| GO:00614588 | Cervix | CC | reproductive system development | 87/2311 | 427/18723 | 1.37e-06 | 4.55e-05 | 87 |
| GO:00486088 | Cervix | CC | reproductive structure development | 86/2311 | 424/18723 | 1.90e-06 | 5.97e-05 | 86 |
| GO:00457876 | Cervix | CC | positive regulation of cell cycle | 66/2311 | 313/18723 | 7.78e-06 | 1.81e-04 | 66 |
| GO:00063257 | Cervix | CC | chromatin organization | 78/2311 | 409/18723 | 5.40e-05 | 8.02e-04 | 78 |
| GO:00070646 | Cervix | CC | mitotic sister chromatid cohesion | 12/2311 | 28/18723 | 5.47e-05 | 8.06e-04 | 12 |
| GO:007233110 | Cervix | CC | signal transduction by p53 class mediator | 38/2311 | 163/18723 | 7.06e-05 | 9.85e-04 | 38 |
| GO:00106399 | Cervix | CC | negative regulation of organelle organization | 68/2311 | 348/18723 | 7.40e-05 | 1.03e-03 | 68 |
| GO:00900685 | Cervix | CC | positive regulation of cell cycle process | 50/2311 | 236/18723 | 8.25e-05 | 1.11e-03 | 50 |
| GO:00165705 | Cervix | CC | histone modification | 84/2311 | 463/18723 | 1.70e-04 | 2.01e-03 | 84 |
| GO:00340864 | Cervix | CC | maintenance of sister chromatid cohesion | 7/2311 | 12/18723 | 1.94e-04 | 2.24e-03 | 7 |
| GO:00340884 | Cervix | CC | maintenance of mitotic sister chromatid cohesion | 7/2311 | 12/18723 | 1.94e-04 | 2.24e-03 | 7 |
| GO:000206410 | Cervix | CC | epithelial cell development | 45/2311 | 220/18723 | 4.14e-04 | 4.21e-03 | 45 |
| GO:00349685 | Cervix | CC | histone lysine methylation | 27/2311 | 115/18723 | 6.61e-04 | 6.09e-03 | 27 |
| GO:00310565 | Cervix | CC | regulation of histone modification | 33/2311 | 152/18723 | 7.97e-04 | 7.00e-03 | 33 |
| GO:00510528 | Cervix | CC | regulation of DNA metabolic process | 65/2311 | 359/18723 | 9.25e-04 | 7.84e-03 | 65 |
| GO:00097915 | Cervix | CC | post-embryonic development | 20/2311 | 80/18723 | 1.40e-03 | 1.10e-02 | 20 |
| GO:00487365 | Cervix | CC | appendage development | 35/2311 | 172/18723 | 1.88e-03 | 1.39e-02 | 35 |
| GO:00601735 | Cervix | CC | limb development | 35/2311 | 172/18723 | 1.88e-03 | 1.39e-02 | 35 |
| GO:00165715 | Cervix | CC | histone methylation | 30/2311 | 141/18723 | 1.88e-03 | 1.39e-02 | 30 |
| GO:00457862 | Cervix | CC | negative regulation of cell cycle | 67/2311 | 385/18723 | 2.21e-03 | 1.59e-02 | 67 |
| Page: 1 2 3 4 5 6 7 8 9 10 11 12 13 14 15 16 17 18 19 20 21 22 23 24 25 26 27 28 29 30 31 32 33 34 35 36 37 38 39 40 41 42 43 44 45 46 |
| Pathway ID | Tissue | Disease Stage | Description | Gene Ratio | Bg Ratio | pvalue | p.adjust | qvalue | Count |
| hsa041106 | Cervix | CC | Cell cycle | 36/1267 | 157/8465 | 4.94e-03 | 1.67e-02 | 9.86e-03 | 36 |
| hsa0411013 | Cervix | CC | Cell cycle | 36/1267 | 157/8465 | 4.94e-03 | 1.67e-02 | 9.86e-03 | 36 |
| hsa04110 | Colorectum | FAP | Cell cycle | 37/1404 | 157/8465 | 1.44e-02 | 4.77e-02 | 2.90e-02 | 37 |
| hsa041101 | Colorectum | FAP | Cell cycle | 37/1404 | 157/8465 | 1.44e-02 | 4.77e-02 | 2.90e-02 | 37 |
| hsa041109 | Esophagus | HGIN | Cell cycle | 38/1383 | 157/8465 | 6.70e-03 | 4.37e-02 | 3.47e-02 | 38 |
| hsa0411016 | Esophagus | HGIN | Cell cycle | 38/1383 | 157/8465 | 6.70e-03 | 4.37e-02 | 3.47e-02 | 38 |
| hsa0411023 | Esophagus | ESCC | Cell cycle | 126/4205 | 157/8465 | 1.34e-15 | 5.60e-14 | 2.87e-14 | 126 |
| hsa0411033 | Esophagus | ESCC | Cell cycle | 126/4205 | 157/8465 | 1.34e-15 | 5.60e-14 | 2.87e-14 | 126 |
| hsa041104 | Liver | Cirrhotic | Cell cycle | 61/2530 | 157/8465 | 9.53e-03 | 3.21e-02 | 1.98e-02 | 61 |
| hsa0411011 | Liver | Cirrhotic | Cell cycle | 61/2530 | 157/8465 | 9.53e-03 | 3.21e-02 | 1.98e-02 | 61 |
| hsa041102 | Liver | HCC | Cell cycle | 106/4020 | 157/8465 | 2.54e-07 | 3.04e-06 | 1.69e-06 | 106 |
| hsa041103 | Liver | HCC | Cell cycle | 106/4020 | 157/8465 | 2.54e-07 | 3.04e-06 | 1.69e-06 | 106 |
| hsa041108 | Oral cavity | OSCC | Cell cycle | 118/3704 | 157/8465 | 7.15e-16 | 2.66e-14 | 1.35e-14 | 118 |
| hsa0411015 | Oral cavity | OSCC | Cell cycle | 118/3704 | 157/8465 | 7.15e-16 | 2.66e-14 | 1.35e-14 | 118 |
| hsa0411041 | Oral cavity | EOLP | Cell cycle | 42/1218 | 157/8465 | 3.20e-05 | 1.61e-04 | 9.52e-05 | 42 |
| hsa0411051 | Oral cavity | EOLP | Cell cycle | 42/1218 | 157/8465 | 3.20e-05 | 1.61e-04 | 9.52e-05 | 42 |
| hsa0411061 | Oral cavity | NEOLP | Cell cycle | 37/1112 | 157/8465 | 2.29e-04 | 1.58e-03 | 9.95e-04 | 37 |
| hsa0411071 | Oral cavity | NEOLP | Cell cycle | 37/1112 | 157/8465 | 2.29e-04 | 1.58e-03 | 9.95e-04 | 37 |
| hsa041107 | Prostate | BPH | Cell cycle | 49/1718 | 157/8465 | 7.39e-04 | 3.59e-03 | 2.22e-03 | 49 |
| hsa0411014 | Prostate | BPH | Cell cycle | 49/1718 | 157/8465 | 7.39e-04 | 3.59e-03 | 2.22e-03 | 49 |
| Page: 1 2 |
Top |
Cell-cell communication analysis |
| Identification of potential cell-cell interactions between two cell types and their ligand-receptor pairs for different disease states |
| Ligand | Receptor | LRpair | Pathway | Tissue | Disease Stage |
| Page: 1 |
Top |
Single-cell gene regulatory network inference analysis |
| Find out the significant the regulons (TFs) and the target genes of each regulon across cell types for different disease states |
| TF | Cell Type | Tissue | Disease Stage | Target Gene | RSS | Regulon Activity |
| ∗The dot plots of a searched regulon are shown for all cell subpopulations in each disease state of each tissue based on the regulon specific score inferred using pySCENIC and by calculating the average expression. |
| Page: 1 |
Top |
Somatic mutation of malignant transformation related genes |
| Annotation of somatic variants for genes involved in malignant transformation |
| Hugo Symbol | Variant Class | Variant Classification | dbSNP RS | HGVSc | HGVSp | HGVSp Short | SWISSPROT | BIOTYPE | SIFT | PolyPhen | Tumor Sample Barcode | Tissue | Histology | Sex | Age | Stage | Therapy Types | Drugs | Outcome |
| ATRX | SNV | Missense_Mutation | novel | c.200N>T | p.Ser67Phe | p.S67F | P46100 | protein_coding | deleterious(0) | benign(0) | TCGA-5L-AAT1-01 | Breast | breast invasive carcinoma | Female | <65 | III/IV | Hormone Therapy | letrozol | SD |
| ATRX | SNV | Missense_Mutation | c.6083N>C | p.Arg2028Pro | p.R2028P | P46100 | protein_coding | deleterious(0) | probably_damaging(0.961) | TCGA-A8-A07L-01 | Breast | breast invasive carcinoma | Female | <65 | III/IV | Chemotherapy | CR | ||
| ATRX | SNV | Missense_Mutation | c.2686N>C | p.Asp896His | p.D896H | P46100 | protein_coding | tolerated_low_confidence(0.2) | benign(0.347) | TCGA-A8-A08L-01 | Breast | breast invasive carcinoma | Female | >=65 | III/IV | Unknown | Unknown | SD | |
| ATRX | SNV | Missense_Mutation | c.3739N>C | p.Asp1247His | p.D1247H | P46100 | protein_coding | deleterious(0) | possibly_damaging(0.533) | TCGA-AC-A23H-01 | Breast | breast invasive carcinoma | Female | >=65 | I/II | Unknown | Unknown | PD | |
| ATRX | SNV | Missense_Mutation | novel | c.6649G>A | p.Asp2217Asn | p.D2217N | P46100 | protein_coding | tolerated(0.06) | possibly_damaging(0.791) | TCGA-AC-A62Y-01 | Breast | breast invasive carcinoma | Female | >=65 | I/II | Unknown | Unknown | SD |
| ATRX | SNV | Missense_Mutation | c.3392G>T | p.Arg1131Ile | p.R1131I | P46100 | protein_coding | deleterious_low_confidence(0.02) | benign(0.259) | TCGA-AN-A046-01 | Breast | breast invasive carcinoma | Female | >=65 | I/II | Unknown | Unknown | SD | |
| ATRX | SNV | Missense_Mutation | novel | c.3161C>T | p.Ser1054Phe | p.S1054F | P46100 | protein_coding | tolerated_low_confidence(0.27) | benign(0.003) | TCGA-AN-A046-01 | Breast | breast invasive carcinoma | Female | >=65 | I/II | Unknown | Unknown | SD |
| ATRX | SNV | Missense_Mutation | rs138256318 | c.2898G>T | p.Glu966Asp | p.E966D | P46100 | protein_coding | tolerated_low_confidence(0.25) | benign(0) | TCGA-AN-A046-01 | Breast | breast invasive carcinoma | Female | >=65 | I/II | Unknown | Unknown | SD |
| ATRX | SNV | Missense_Mutation | novel | c.1805G>A | p.Gly602Asp | p.G602D | P46100 | protein_coding | tolerated_low_confidence(0.38) | possibly_damaging(0.69) | TCGA-AN-A046-01 | Breast | breast invasive carcinoma | Female | >=65 | I/II | Unknown | Unknown | SD |
| ATRX | SNV | Missense_Mutation | novel | c.1234G>T | p.Asp412Tyr | p.D412Y | P46100 | protein_coding | tolerated(0.07) | benign(0.34) | TCGA-AN-A046-01 | Breast | breast invasive carcinoma | Female | >=65 | I/II | Unknown | Unknown | SD |
| Page: 1 2 3 4 5 6 7 8 9 10 11 12 13 14 15 16 17 18 19 20 21 22 23 24 25 26 27 28 29 30 31 32 33 34 35 36 37 |
Top |
Related drugs of malignant transformation related genes |
| Identification of chemicals and drugs interact with genes involved in malignant transfromation |
| (DGIdb 4.0) |
| Entrez ID | Symbol | Category | Interaction Types | Drug Claim Name | Drug Name | PMIDs |
| 546 | ATRX | ENZYME, CLINICALLY ACTIONABLE, DNA REPAIR | Gemcitabine | GEMCITABINE | 26853339 | |
| 546 | ATRX | ENZYME, CLINICALLY ACTIONABLE, DNA REPAIR | Radiotherapy | 26853339 | ||
| 546 | ATRX | ENZYME, CLINICALLY ACTIONABLE, DNA REPAIR | AZ20 | 25593184 | ||
| 546 | ATRX | ENZYME, CLINICALLY ACTIONABLE, DNA REPAIR | PROCARBAZINE | PROCARBAZINE | 23904111 | |
| 546 | ATRX | ENZYME, CLINICALLY ACTIONABLE, DNA REPAIR | Irinotecan | IRINOTECAN | 26936505 | |
| 546 | ATRX | ENZYME, CLINICALLY ACTIONABLE, DNA REPAIR | Topotecan | TOPOTECAN | 26936505 | |
| 546 | ATRX | ENZYME, CLINICALLY ACTIONABLE, DNA REPAIR | Doxorubicin | DOXORUBICIN | 26936505 | |
| 546 | ATRX | ENZYME, CLINICALLY ACTIONABLE, DNA REPAIR | E7449 | 2X-121 | 26513298 | |
| 546 | ATRX | ENZYME, CLINICALLY ACTIONABLE, DNA REPAIR | LOMUSTINE | LOMUSTINE | 23904111 | |
| 546 | ATRX | ENZYME, CLINICALLY ACTIONABLE, DNA REPAIR | VE-821 | 25593184 |
| Page: 1 2 |

Copyright 2023-Present -The University of Texas Health Science Center at Houston |