
|
|||||
|
 | |
| |
| |
| |
| |
| |
|
Gene: ATRN |
Gene summary for ATRN |
| Gene information | Species | Human | Gene symbol | ATRN | Gene ID | 8455 |
| Gene name | attractin | |
| Gene Alias | DPPT-L | |
| Cytomap | 20p13 | |
| Gene Type | protein-coding | GO ID | GO:0000902 | UniProtAcc | B4DZ36 |
Top |
Malignant transformation analysis |
| Identification of the aberrant gene expression in precancerous and cancerous lesions by comparing the gene expression of stem-like cells in diseased tissues with normal stem cells |
| Entrez ID | Symbol | Replicates | Species | Organ | Tissue | Adj P-value | Log2FC | Malignancy |
| 8455 | ATRN | LZE4T | Human | Esophagus | ESCC | 1.65e-12 | 6.05e-01 | 0.0811 |
| 8455 | ATRN | LZE5T | Human | Esophagus | ESCC | 1.41e-02 | 2.53e-01 | 0.0514 |
| 8455 | ATRN | LZE7T | Human | Esophagus | ESCC | 5.89e-04 | 1.94e-01 | 0.0667 |
| 8455 | ATRN | LZE20T | Human | Esophagus | ESCC | 2.19e-04 | 1.32e-01 | 0.0662 |
| 8455 | ATRN | LZE22T | Human | Esophagus | ESCC | 2.47e-03 | 1.68e-01 | 0.068 |
| 8455 | ATRN | LZE24T | Human | Esophagus | ESCC | 1.53e-05 | 1.09e-01 | 0.0596 |
| 8455 | ATRN | P1T-E | Human | Esophagus | ESCC | 3.03e-03 | 1.49e-01 | 0.0875 |
| 8455 | ATRN | P2T-E | Human | Esophagus | ESCC | 2.70e-18 | 2.88e-01 | 0.1177 |
| 8455 | ATRN | P4T-E | Human | Esophagus | ESCC | 2.42e-11 | 1.81e-01 | 0.1323 |
| 8455 | ATRN | P5T-E | Human | Esophagus | ESCC | 2.13e-02 | 2.54e-02 | 0.1327 |
| 8455 | ATRN | P8T-E | Human | Esophagus | ESCC | 2.84e-13 | 2.88e-01 | 0.0889 |
| 8455 | ATRN | P9T-E | Human | Esophagus | ESCC | 8.25e-08 | 1.08e-01 | 0.1131 |
| 8455 | ATRN | P10T-E | Human | Esophagus | ESCC | 2.92e-21 | 2.66e-01 | 0.116 |
| 8455 | ATRN | P11T-E | Human | Esophagus | ESCC | 2.66e-11 | 6.08e-01 | 0.1426 |
| 8455 | ATRN | P12T-E | Human | Esophagus | ESCC | 9.09e-22 | 4.11e-01 | 0.1122 |
| 8455 | ATRN | P15T-E | Human | Esophagus | ESCC | 1.39e-13 | 2.61e-01 | 0.1149 |
| 8455 | ATRN | P16T-E | Human | Esophagus | ESCC | 6.64e-22 | 3.65e-01 | 0.1153 |
| 8455 | ATRN | P19T-E | Human | Esophagus | ESCC | 4.96e-04 | 2.59e-01 | 0.1662 |
| 8455 | ATRN | P20T-E | Human | Esophagus | ESCC | 9.05e-11 | 1.96e-01 | 0.1124 |
| 8455 | ATRN | P21T-E | Human | Esophagus | ESCC | 8.33e-19 | 3.52e-01 | 0.1617 |
| Page: 1 2 3 4 5 |
| Tissue | Expression Dynamics | Abbreviation |
| Esophagus |  | ESCC: Esophageal squamous cell carcinoma |
| HGIN: High-grade intraepithelial neoplasias | ||
| LGIN: Low-grade intraepithelial neoplasias | ||
| Liver | 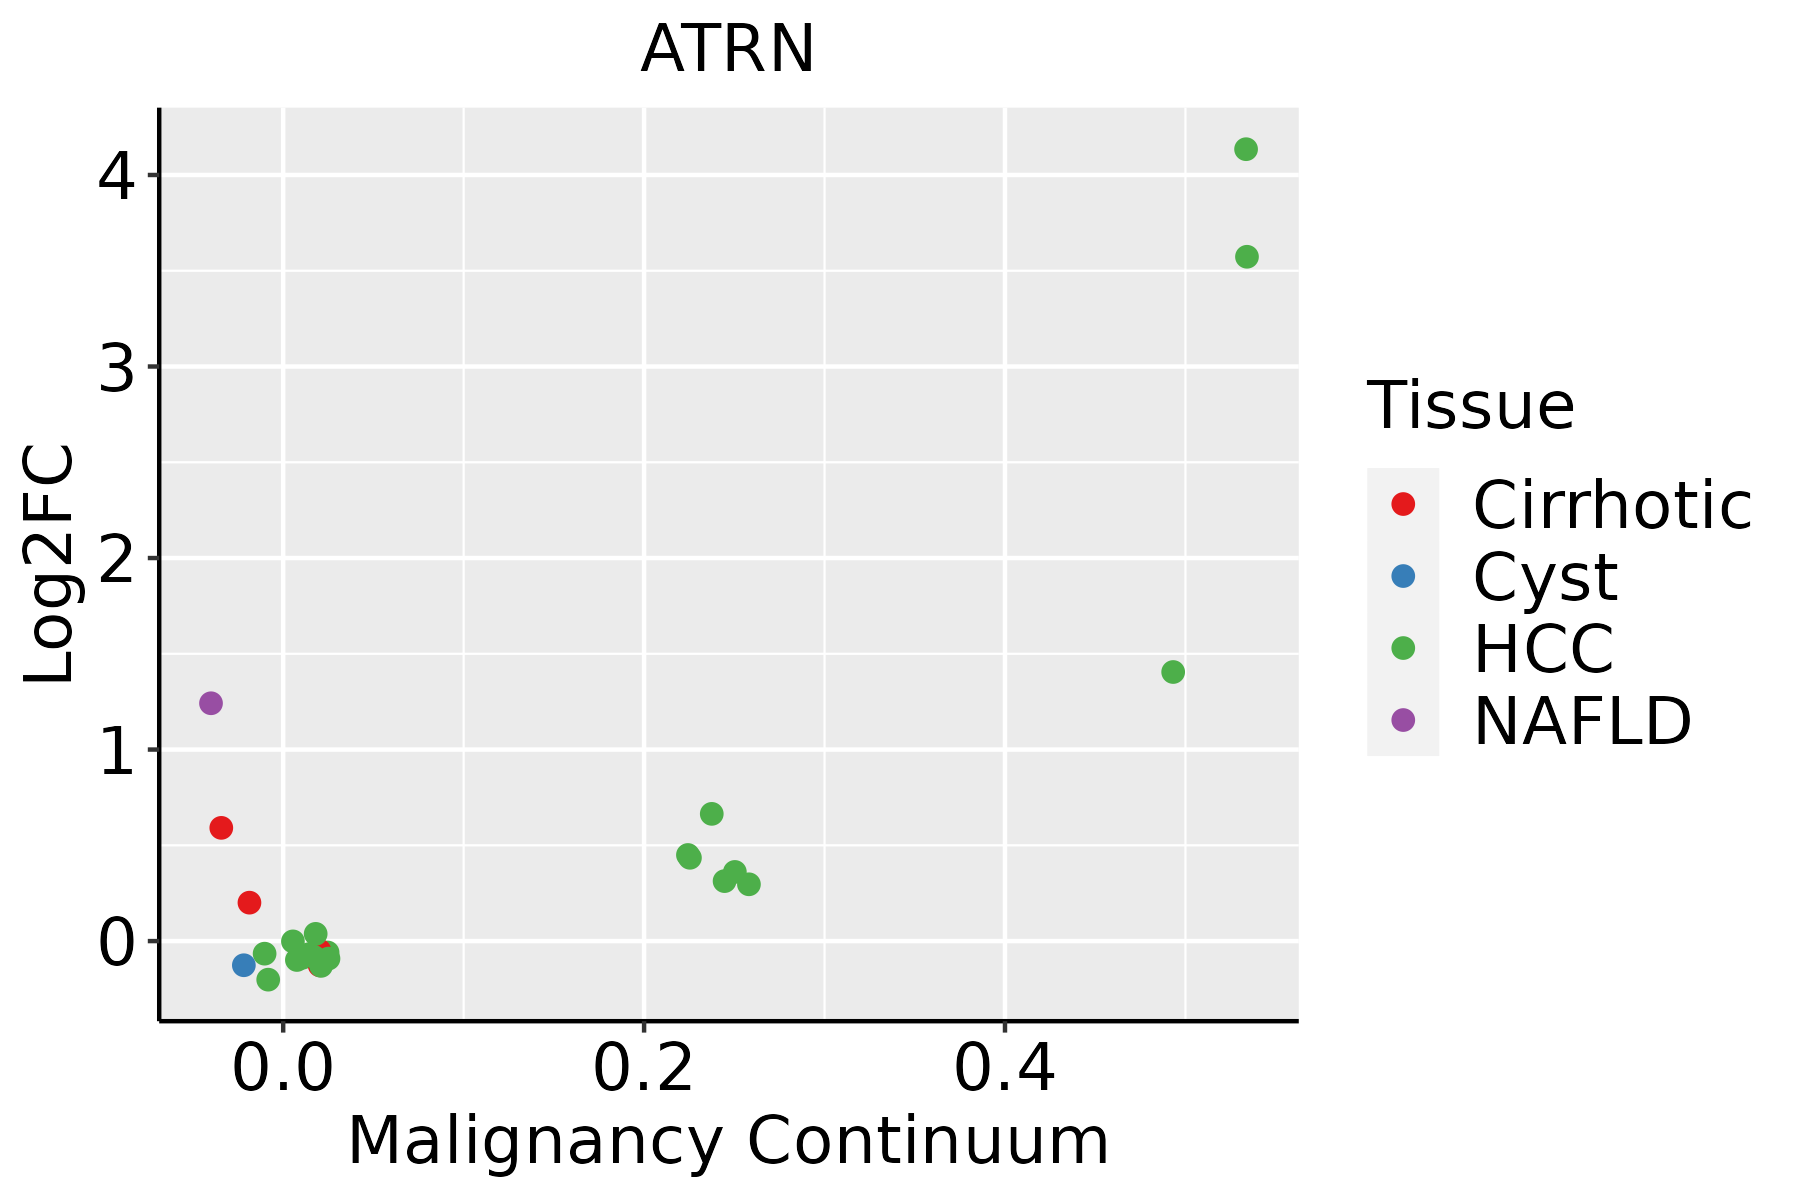 | HCC: Hepatocellular carcinoma |
| NAFLD: Non-alcoholic fatty liver disease | ||
| Lung | 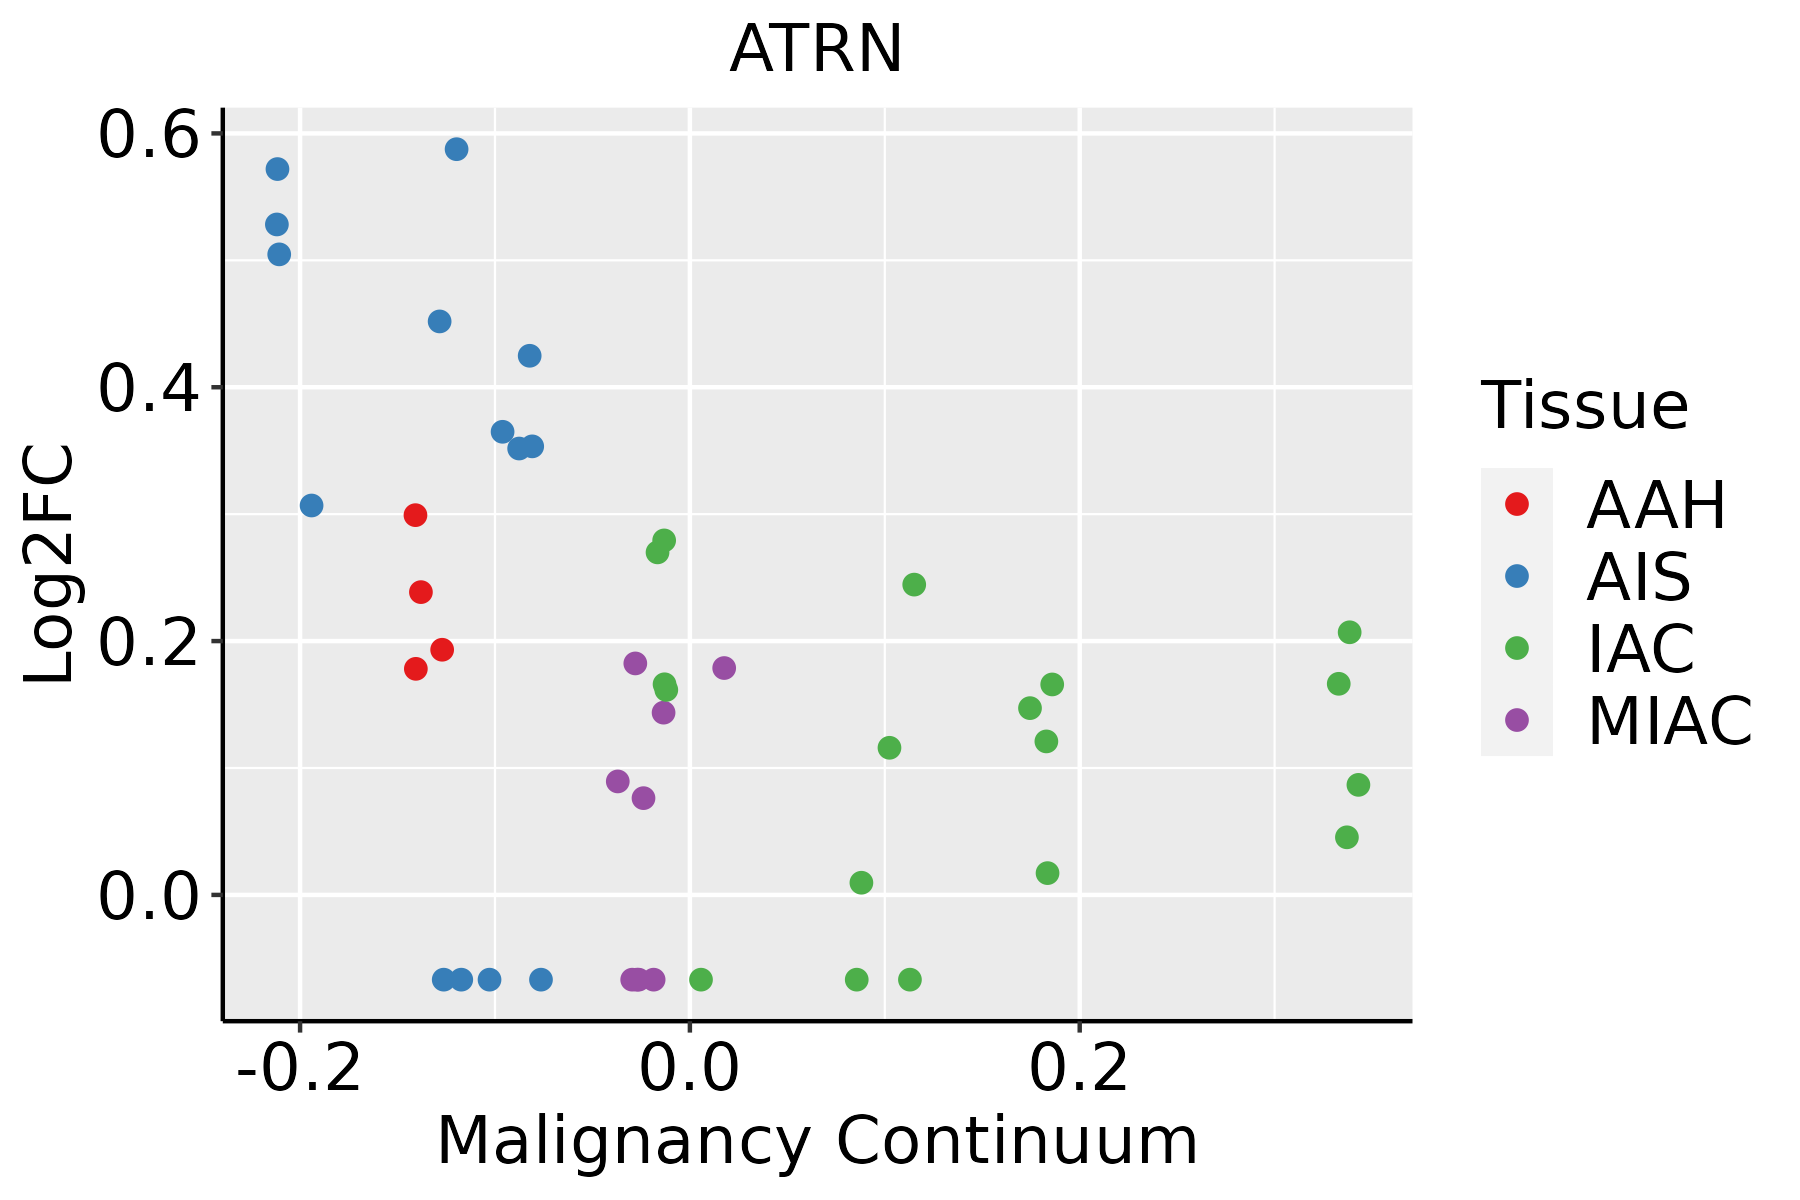 | AAH: Atypical adenomatous hyperplasia |
| AIS: Adenocarcinoma in situ | ||
| IAC: Invasive lung adenocarcinoma | ||
| MIA: Minimally invasive adenocarcinoma | ||
| Oral Cavity |  | EOLP: Erosive Oral lichen planus |
| LP: leukoplakia | ||
| NEOLP: Non-erosive oral lichen planus | ||
| OSCC: Oral squamous cell carcinoma |
| ∗log2FC in expression of this searched gene in stem-like cells from each diseased tissue sample relative to stem-like cells in normal samples in each tissue plotted against the malignancy continuum. Samples are colored based on if they are from different disease stage. |
Top |
Malignant transformation related pathway analysis |
| Find out the enriched GO biological processes and KEGG pathways involved in transition from healthy to precancer to cancer |
| Tissue | Disease Stage | Enriched GO biological Processes |
| Colorectum | AD |  |
| Colorectum | SER |  |
| Colorectum | MSS |  |
| Colorectum | MSI-H |  |
| Colorectum | FAP |  |
| ∗Top 15 enriched GO BP terms are showed in the bar plot of each disease state in each tissue. Each row represents a significant GO biological process which is colored according to the -log10(p.adjust). |
| Page: 1 2 3 4 5 6 7 8 9 |
| GO ID | Tissue | Disease Stage | Description | Gene Ratio | Bg Ratio | pvalue | p.adjust | Count |
| GO:0006979111 | Esophagus | ESCC | response to oxidative stress | 303/8552 | 446/18723 | 7.15e-22 | 1.30e-19 | 303 |
| GO:003158919 | Esophagus | ESCC | cell-substrate adhesion | 221/8552 | 363/18723 | 3.06e-09 | 6.62e-08 | 221 |
| GO:00425524 | Esophagus | ESCC | myelination | 85/8552 | 134/18723 | 2.51e-05 | 2.13e-04 | 85 |
| GO:00072724 | Esophagus | ESCC | ensheathment of neurons | 86/8552 | 136/18723 | 2.68e-05 | 2.24e-04 | 86 |
| GO:00083664 | Esophagus | ESCC | axon ensheathment | 86/8552 | 136/18723 | 2.68e-05 | 2.24e-04 | 86 |
| GO:00352647 | Esophagus | ESCC | multicellular organism growth | 80/8552 | 132/18723 | 3.84e-04 | 2.22e-03 | 80 |
| GO:003444620 | Esophagus | ESCC | substrate adhesion-dependent cell spreading | 65/8552 | 108/18723 | 1.67e-03 | 7.72e-03 | 65 |
| GO:00434731 | Esophagus | ESCC | pigmentation | 59/8552 | 98/18723 | 2.64e-03 | 1.12e-02 | 59 |
| GO:00069797 | Liver | NAFLD | response to oxidative stress | 78/1882 | 446/18723 | 7.85e-07 | 4.29e-05 | 78 |
| GO:00315896 | Liver | NAFLD | cell-substrate adhesion | 65/1882 | 363/18723 | 2.84e-06 | 1.18e-04 | 65 |
| GO:00344467 | Liver | NAFLD | substrate adhesion-dependent cell spreading | 25/1882 | 108/18723 | 5.41e-05 | 1.23e-03 | 25 |
| GO:00352643 | Liver | NAFLD | multicellular organism growth | 27/1882 | 132/18723 | 2.57e-04 | 4.19e-03 | 27 |
| GO:00486384 | Liver | NAFLD | regulation of developmental growth | 48/1882 | 330/18723 | 5.74e-03 | 4.37e-02 | 48 |
| GO:000697912 | Liver | Cirrhotic | response to oxidative stress | 196/4634 | 446/18723 | 2.80e-19 | 5.86e-17 | 196 |
| GO:003158912 | Liver | Cirrhotic | cell-substrate adhesion | 128/4634 | 363/18723 | 4.10e-06 | 6.90e-05 | 128 |
| GO:003444612 | Liver | Cirrhotic | substrate adhesion-dependent cell spreading | 47/4634 | 108/18723 | 1.48e-05 | 2.05e-04 | 47 |
| GO:003526411 | Liver | Cirrhotic | multicellular organism growth | 47/4634 | 132/18723 | 3.40e-03 | 1.89e-02 | 47 |
| GO:0042552 | Liver | Cirrhotic | myelination | 46/4634 | 134/18723 | 8.04e-03 | 3.77e-02 | 46 |
| GO:0007272 | Liver | Cirrhotic | ensheathment of neurons | 46/4634 | 136/18723 | 1.08e-02 | 4.75e-02 | 46 |
| GO:0008366 | Liver | Cirrhotic | axon ensheathment | 46/4634 | 136/18723 | 1.08e-02 | 4.75e-02 | 46 |
| Page: 1 2 3 |
| Pathway ID | Tissue | Disease Stage | Description | Gene Ratio | Bg Ratio | pvalue | p.adjust | qvalue | Count |
| Page: 1 |
Top |
Cell-cell communication analysis |
| Identification of potential cell-cell interactions between two cell types and their ligand-receptor pairs for different disease states |
| Ligand | Receptor | LRpair | Pathway | Tissue | Disease Stage |
| Page: 1 |
Top |
Single-cell gene regulatory network inference analysis |
| Find out the significant the regulons (TFs) and the target genes of each regulon across cell types for different disease states |
| TF | Cell Type | Tissue | Disease Stage | Target Gene | RSS | Regulon Activity |
| ∗The dot plots of a searched regulon are shown for all cell subpopulations in each disease state of each tissue based on the regulon specific score inferred using pySCENIC and by calculating the average expression. |
| Page: 1 |
Top |
Somatic mutation of malignant transformation related genes |
| Annotation of somatic variants for genes involved in malignant transformation |
| Hugo Symbol | Variant Class | Variant Classification | dbSNP RS | HGVSc | HGVSp | HGVSp Short | SWISSPROT | BIOTYPE | SIFT | PolyPhen | Tumor Sample Barcode | Tissue | Histology | Sex | Age | Stage | Therapy Types | Drugs | Outcome |
| ATRN | SNV | Missense_Mutation | c.1154N>T | p.Ser385Phe | p.S385F | O75882 | protein_coding | deleterious(0.01) | benign(0.243) | TCGA-A2-A0YK-01 | Breast | breast invasive carcinoma | Female | <65 | I/II | Chemotherapy | cytoxan | SD | |
| ATRN | SNV | Missense_Mutation | c.1576N>G | p.Asn526Asp | p.N526D | O75882 | protein_coding | deleterious(0.04) | possibly_damaging(0.867) | TCGA-A8-A09Z-01 | Breast | breast invasive carcinoma | Female | >=65 | I/II | Unknown | Unknown | SD | |
| ATRN | SNV | Missense_Mutation | c.4015G>C | p.Glu1339Gln | p.E1339Q | O75882 | protein_coding | tolerated(0.19) | benign(0.009) | TCGA-AC-A23H-01 | Breast | breast invasive carcinoma | Female | >=65 | I/II | Unknown | Unknown | PD | |
| ATRN | SNV | Missense_Mutation | c.2503N>C | p.Val835Leu | p.V835L | O75882 | protein_coding | tolerated(0.08) | possibly_damaging(0.893) | TCGA-BH-A0EI-01 | Breast | breast invasive carcinoma | Female | <65 | I/II | Unknown | Unknown | SD | |
| ATRN | SNV | Missense_Mutation | c.1343C>G | p.Ser448Cys | p.S448C | O75882 | protein_coding | deleterious(0) | probably_damaging(0.984) | TCGA-BH-A18P-01 | Breast | breast invasive carcinoma | Female | <65 | I/II | Unknown | Unknown | PD | |
| ATRN | SNV | Missense_Mutation | novel | c.1904N>C | p.Leu635Pro | p.L635P | O75882 | protein_coding | deleterious(0.02) | benign(0.014) | TCGA-C8-A1HJ-01 | Breast | breast invasive carcinoma | Female | <65 | I/II | Unknown | Unknown | SD |
| ATRN | SNV | Missense_Mutation | rs752583734 | c.739N>A | p.Phe247Ile | p.F247I | O75882 | protein_coding | tolerated(1) | benign(0) | TCGA-E2-A14N-01 | Breast | breast invasive carcinoma | Female | <65 | I/II | Chemotherapy | cyclophosphamide | SD |
| ATRN | SNV | Missense_Mutation | c.1609N>C | p.Tyr537His | p.Y537H | O75882 | protein_coding | deleterious(0.01) | probably_damaging(0.992) | TCGA-E9-A22E-01 | Breast | breast invasive carcinoma | Female | <65 | III/IV | Chemotherapy | cyclophosphane | SD | |
| ATRN | SNV | Missense_Mutation | c.3484N>C | p.Asp1162His | p.D1162H | O75882 | protein_coding | deleterious(0) | probably_damaging(0.977) | TCGA-C5-A1BL-01 | Cervix | cervical & endocervical cancer | Female | <65 | I/II | Unknown | Unknown | SD | |
| ATRN | SNV | Missense_Mutation | rs760560964 | c.956N>T | p.Ser319Leu | p.S319L | O75882 | protein_coding | deleterious(0) | benign(0.15) | TCGA-ZJ-AAXB-01 | Cervix | cervical & endocervical cancer | Female | <65 | I/II | Unknown | Unknown | SD |
| Page: 1 2 3 4 5 6 7 8 9 10 11 12 13 |
Top |
Related drugs of malignant transformation related genes |
| Identification of chemicals and drugs interact with genes involved in malignant transfromation |
| (DGIdb 4.0) |
| Entrez ID | Symbol | Category | Interaction Types | Drug Claim Name | Drug Name | PMIDs |
| Page: 1 |

Copyright 2023-Present -The University of Texas Health Science Center at Houston |