| Tissue | Expression Dynamics | Abbreviation |
| Cervix | 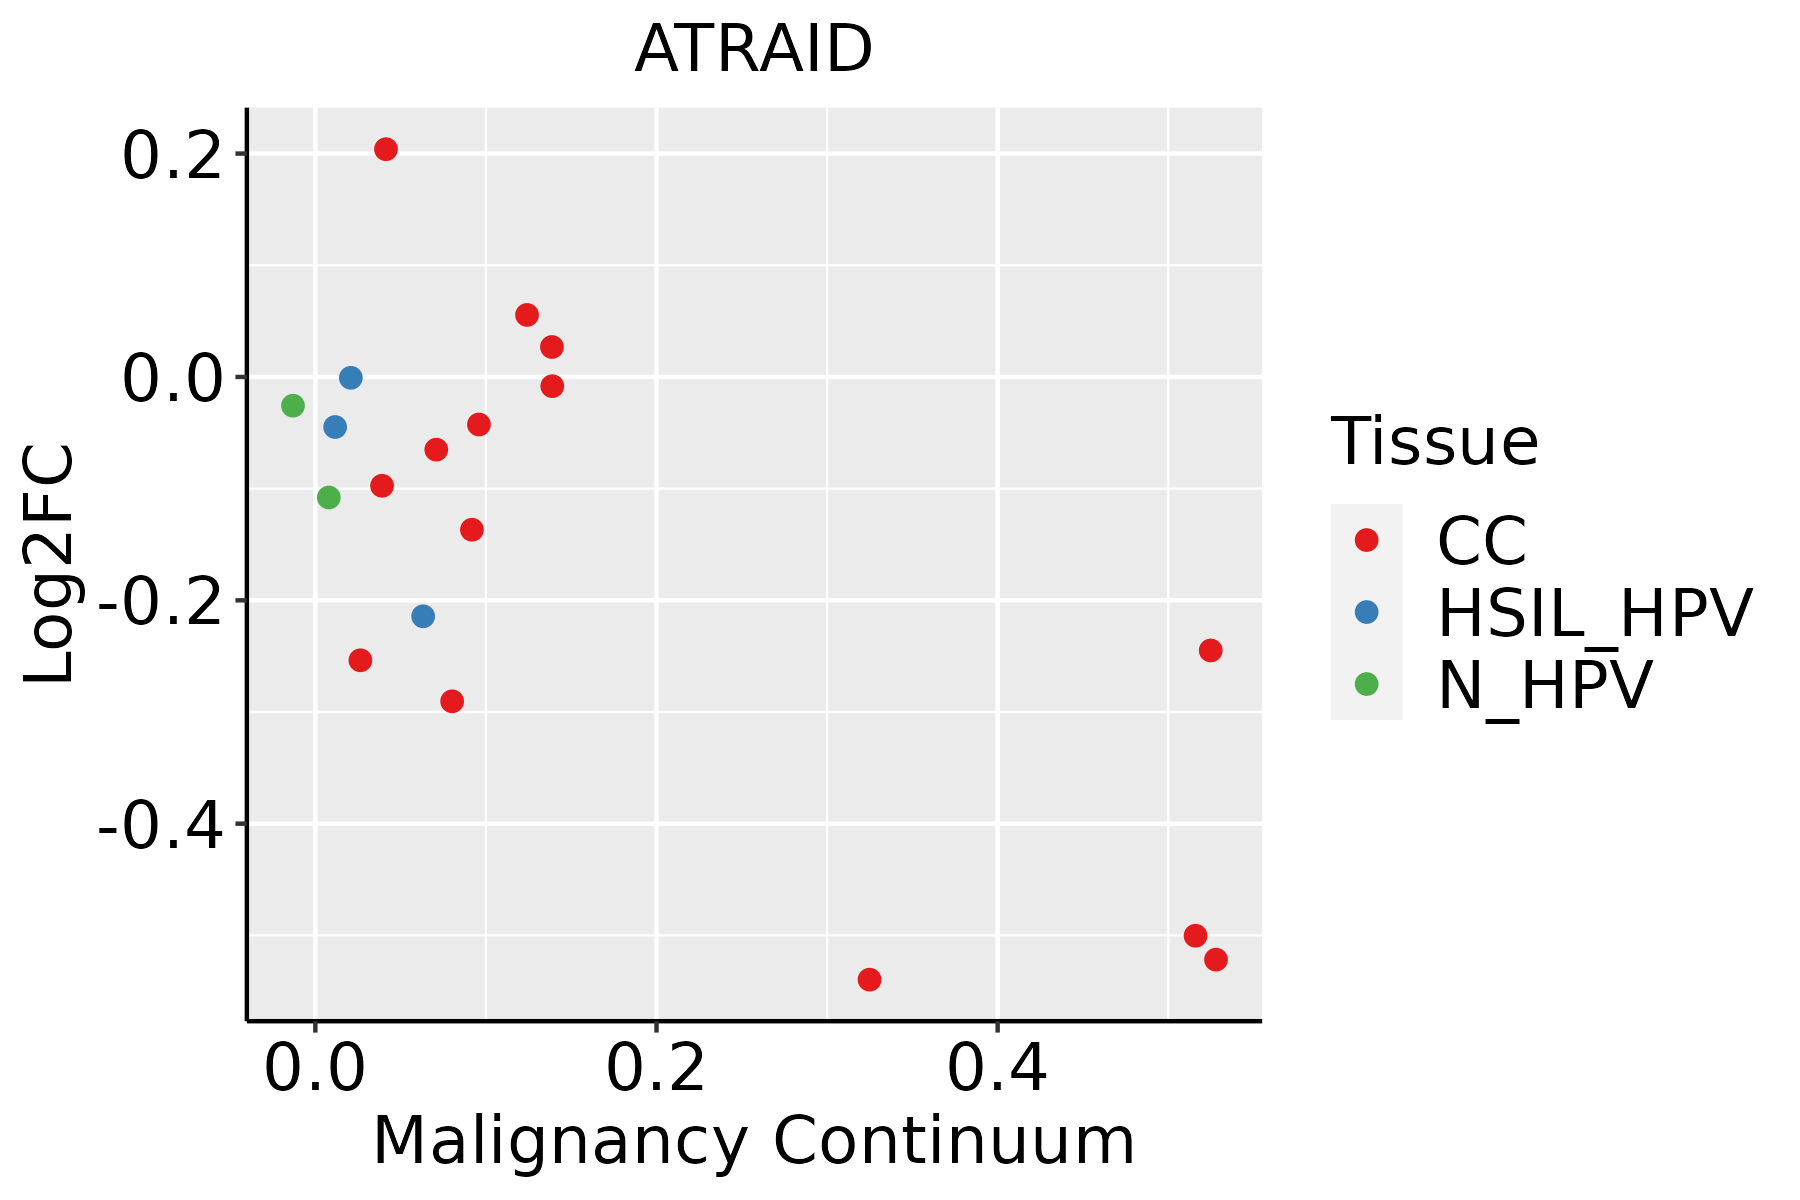 | CC: Cervix cancer |
| HSIL_HPV: HPV-infected high-grade squamous intraepithelial lesions |
| N_HPV: HPV-infected normal cervix |
| Colorectum (GSE201348) |  | FAP: Familial adenomatous polyposis |
| CRC: Colorectal cancer |
| Colorectum (HTA11) |  | AD: Adenomas |
| SER: Sessile serrated lesions |
| MSI-H: Microsatellite-high colorectal cancer |
| MSS: Microsatellite stable colorectal cancer |
| Endometrium |  | AEH: Atypical endometrial hyperplasia |
| EEC: Endometrioid Cancer |
| Esophagus | 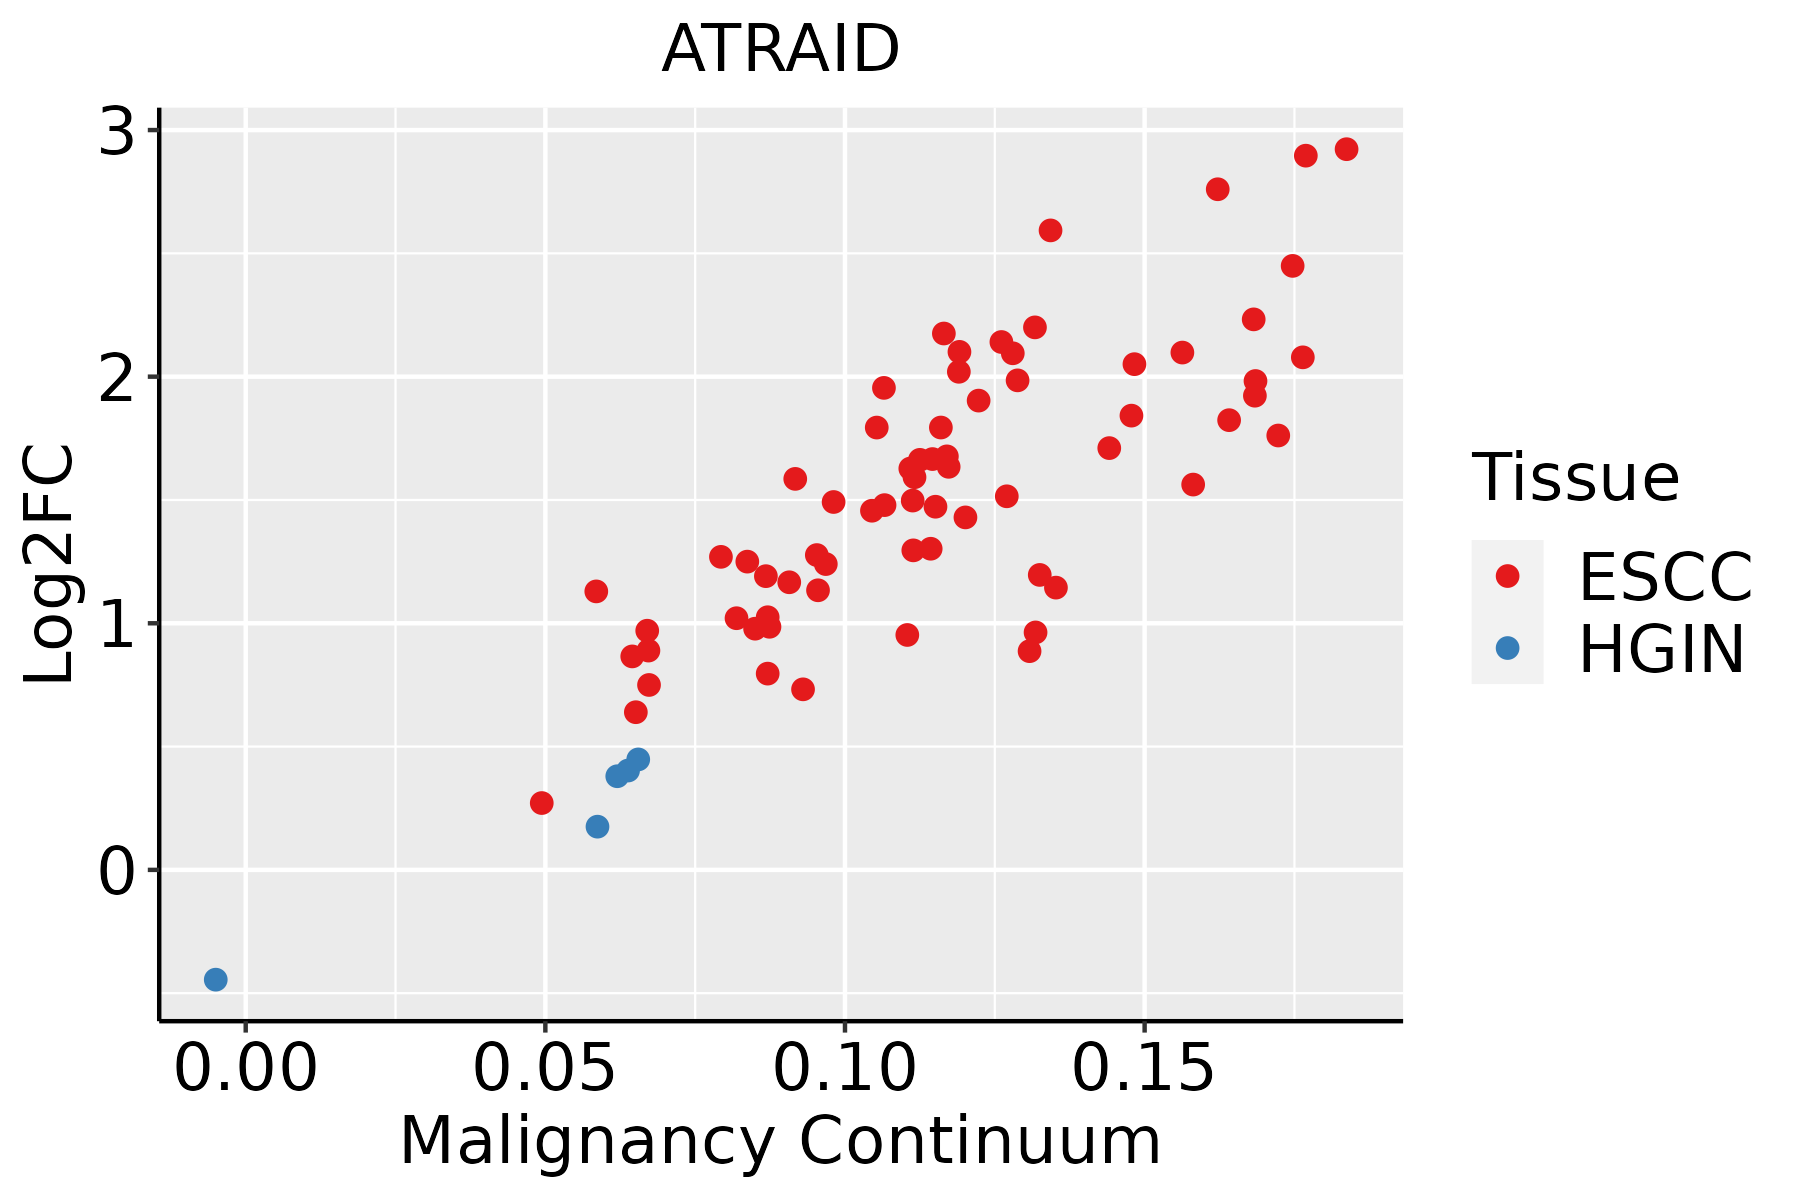 | ESCC: Esophageal squamous cell carcinoma |
| HGIN: High-grade intraepithelial neoplasias |
| LGIN: Low-grade intraepithelial neoplasias |
| Liver | 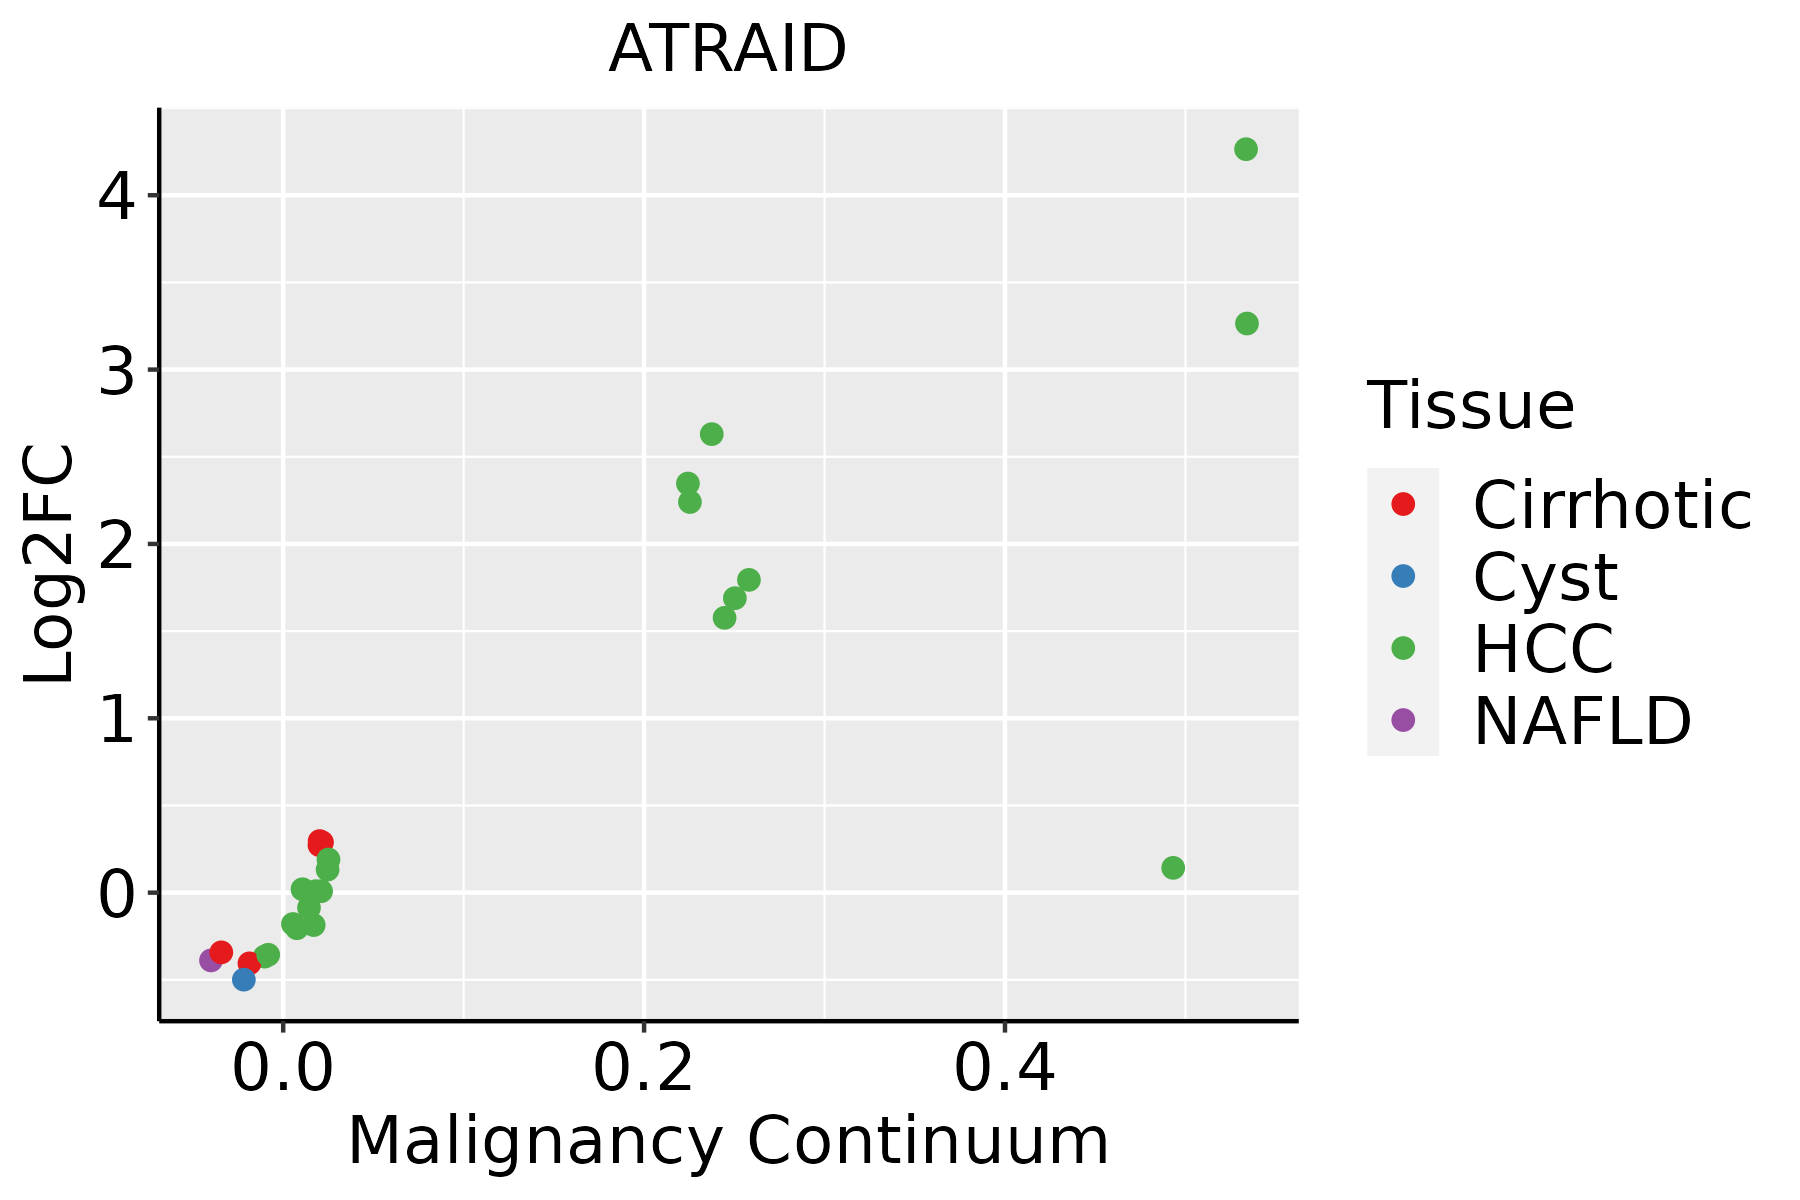 | HCC: Hepatocellular carcinoma |
| NAFLD: Non-alcoholic fatty liver disease |
| Oral Cavity |  | EOLP: Erosive Oral lichen planus |
| LP: leukoplakia |
| NEOLP: Non-erosive oral lichen planus |
| OSCC: Oral squamous cell carcinoma |
| Prostate | 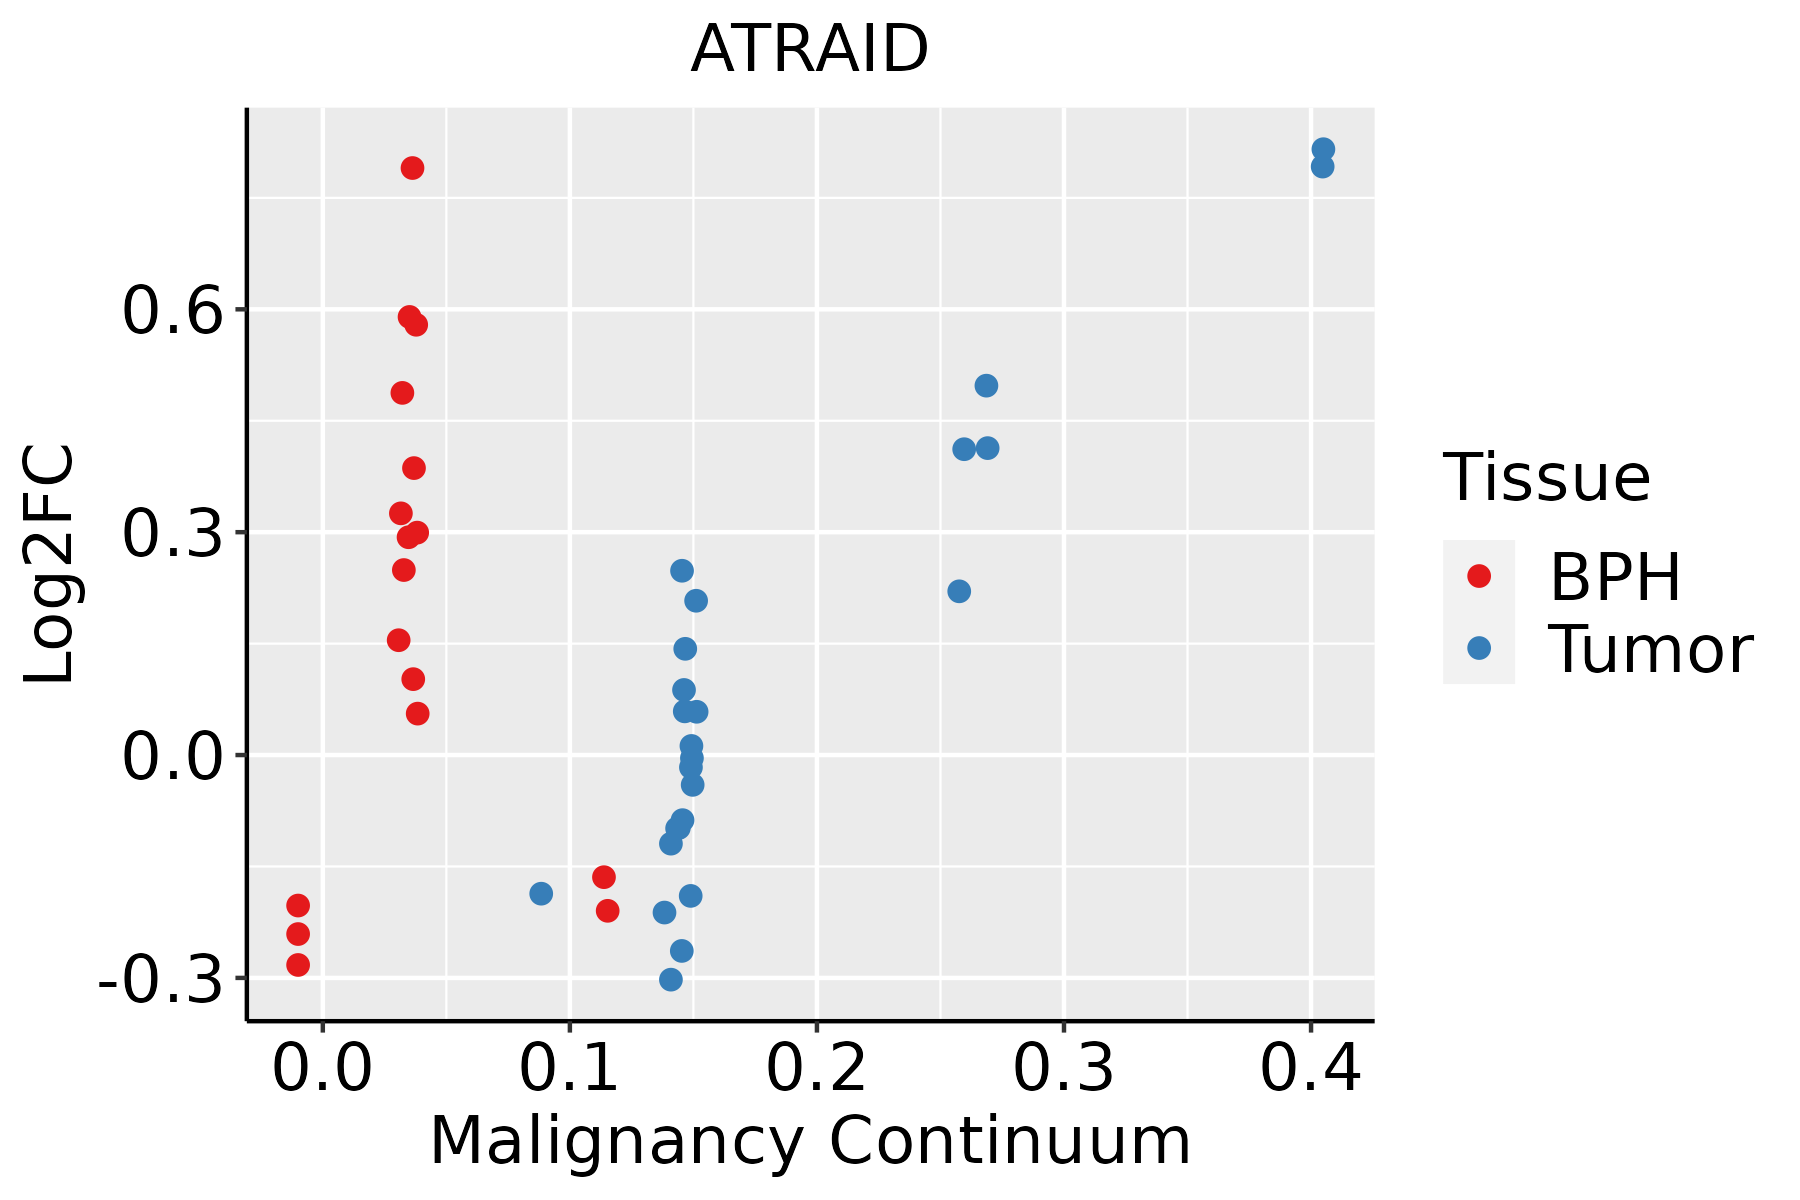 | BPH: Benign Prostatic Hyperplasia |
| Skin |  | AK: Actinic keratosis |
| cSCC: Cutaneous squamous cell carcinoma |
| SCCIS:squamous cell carcinoma in situ |
| Thyroid |  | ATC: Anaplastic thyroid cancer |
| HT: Hashimoto's thyroiditis |
| PTC: Papillary thyroid cancer |
| GO ID | Tissue | Disease Stage | Description | Gene Ratio | Bg Ratio | pvalue | p.adjust | Count |
| GO:004217610 | Cervix | CC | regulation of protein catabolic process | 104/2311 | 391/18723 | 9.39e-15 | 9.36e-12 | 104 |
| GO:190336210 | Cervix | CC | regulation of cellular protein catabolic process | 72/2311 | 255/18723 | 5.98e-12 | 2.10e-09 | 72 |
| GO:003133010 | Cervix | CC | negative regulation of cellular catabolic process | 63/2311 | 262/18723 | 1.10e-07 | 5.68e-06 | 63 |
| GO:000989510 | Cervix | CC | negative regulation of catabolic process | 69/2311 | 320/18723 | 2.15e-06 | 6.55e-05 | 69 |
| GO:19033639 | Cervix | CC | negative regulation of cellular protein catabolic process | 24/2311 | 75/18723 | 6.43e-06 | 1.55e-04 | 24 |
| GO:004217710 | Cervix | CC | negative regulation of protein catabolic process | 30/2311 | 121/18723 | 1.23e-04 | 1.53e-03 | 30 |
| GO:00016497 | Cervix | CC | osteoblast differentiation | 47/2311 | 229/18723 | 2.88e-04 | 3.11e-03 | 47 |
| GO:0045667 | Cervix | CC | regulation of osteoblast differentiation | 29/2311 | 132/18723 | 1.32e-03 | 1.05e-02 | 29 |
| GO:00015037 | Cervix | CC | ossification | 71/2311 | 408/18723 | 1.67e-03 | 1.28e-02 | 71 |
| GO:0033688 | Cervix | CC | regulation of osteoblast proliferation | 9/2311 | 27/18723 | 3.82e-03 | 2.41e-02 | 9 |
| GO:0033687 | Cervix | CC | osteoblast proliferation | 10/2311 | 32/18723 | 3.96e-03 | 2.48e-02 | 10 |
| GO:00302781 | Cervix | CC | regulation of ossification | 24/2311 | 115/18723 | 6.51e-03 | 3.61e-02 | 24 |
| GO:0030501 | Cervix | CC | positive regulation of bone mineralization | 11/2311 | 40/18723 | 7.54e-03 | 4.02e-02 | 11 |
| GO:0031214 | Cervix | CC | biomineral tissue development | 32/2311 | 169/18723 | 8.73e-03 | 4.48e-02 | 32 |
| GO:0045669 | Cervix | CC | positive regulation of osteoblast differentiation | 16/2311 | 69/18723 | 8.75e-03 | 4.48e-02 | 16 |
| GO:0030282 | Cervix | CC | bone mineralization | 24/2311 | 119/18723 | 1.00e-02 | 4.89e-02 | 24 |
| GO:0110148 | Cervix | CC | biomineralization | 32/2311 | 171/18723 | 1.04e-02 | 4.97e-02 | 32 |
| GO:0042176 | Colorectum | AD | regulation of protein catabolic process | 160/3918 | 391/18723 | 1.06e-19 | 7.34e-17 | 160 |
| GO:1903362 | Colorectum | AD | regulation of cellular protein catabolic process | 109/3918 | 255/18723 | 2.14e-15 | 6.08e-13 | 109 |
| GO:0009895 | Colorectum | AD | negative regulation of catabolic process | 124/3918 | 320/18723 | 1.66e-13 | 3.35e-11 | 124 |
| Hugo Symbol | Variant Class | Variant Classification | dbSNP RS | HGVSc | HGVSp | HGVSp Short | SWISSPROT | BIOTYPE | SIFT | PolyPhen | Tumor Sample Barcode | Tissue | Histology | Sex | Age | Stage | Therapy Types | Drugs | Outcome |
| ATRAID | SNV | Missense_Mutation | | c.371N>G | p.Lys124Arg | p.K124R | Q6UW56 | protein_coding | tolerated(0.22) | benign(0.005) | TCGA-AO-A128-01 | Breast | breast invasive carcinoma | Female | <65 | I/II | Chemotherapy | doxorubicin | SD |
| ATRAID | SNV | Missense_Mutation | | c.369N>C | p.Gln123His | p.Q123H | Q6UW56 | protein_coding | deleterious(0.02) | possibly_damaging(0.655) | TCGA-B6-A0I2-01 | Breast | breast invasive carcinoma | Female | <65 | I/II | Unknown | Unknown | SD |
| ATRAID | SNV | Missense_Mutation | novel | c.71G>A | p.Arg24His | p.R24H | Q6UW56 | protein_coding | tolerated_low_confidence(0.07) | benign(0.381) | TCGA-E2-A9RU-01 | Breast | breast invasive carcinoma | Female | >=65 | III/IV | Hormone Therapy | arimidex | SD |
| ATRAID | deletion | In_Frame_Del | novel | c.787_804delNNNNNNNNNNNNNNNNNN | p.Gly263_Ser268del | p.G263_S268del | Q6UW56 | protein_coding | | | TCGA-C8-A12L-01 | Breast | breast invasive carcinoma | Female | >=65 | I/II | Unknown | Unknown | SD |
| ATRAID | SNV | Missense_Mutation | novel | c.328A>G | p.Thr110Ala | p.T110A | Q6UW56 | protein_coding | tolerated(0.12) | benign(0.013) | TCGA-2W-A8YY-01 | Cervix | cervical & endocervical cancer | Female | <65 | I/II | Chemotherapy | cisplatin | CR |
| ATRAID | SNV | Missense_Mutation | | c.145N>A | p.Gly49Arg | p.G49R | Q6UW56 | protein_coding | tolerated_low_confidence(0.59) | benign(0.001) | TCGA-JW-A5VL-01 | Cervix | cervical & endocervical cancer | Female | <65 | I/II | Unknown | Unknown | SD |
| ATRAID | SNV | Missense_Mutation | | c.637N>G | p.Asn213Asp | p.N213D | Q6UW56 | protein_coding | tolerated(0.1) | benign(0.046) | TCGA-Q1-A73P-01 | Cervix | cervical & endocervical cancer | Female | <65 | I/II | Unknown | Unknown | SD |
| ATRAID | SNV | Missense_Mutation | novel | c.6N>T | p.Lys2Asn | p.K2N | Q6UW56 | protein_coding | deleterious_low_confidence(0) | benign(0.039) | TCGA-VS-A958-01 | Cervix | cervical & endocervical cancer | Female | <65 | I/II | Chemotherapy | cisplatin | CR |
| ATRAID | SNV | Missense_Mutation | | c.584N>G | p.Ile195Ser | p.I195S | Q6UW56 | protein_coding | deleterious(0) | possibly_damaging(0.448) | TCGA-CA-6718-01 | Colorectum | colon adenocarcinoma | Male | <65 | I/II | Unknown | Unknown | PD |
| ATRAID | SNV | Missense_Mutation | rs375386400 | c.746N>A | p.Arg249His | p.R249H | Q6UW56 | protein_coding | deleterious(0) | probably_damaging(0.998) | TCGA-F4-6570-01 | Colorectum | colon adenocarcinoma | Female | >=65 | I/II | Unknown | Unknown | SD |


