
|
|||||
|
 | |
| |
| |
| |
| |
| |
|
Gene: ATP9B |
Gene summary for ATP9B |
| Gene information | Species | Human | Gene symbol | ATP9B | Gene ID | 374868 |
| Gene name | ATPase phospholipid transporting 9B (putative) | |
| Gene Alias | ATPASEP | |
| Cytomap | 18q23 | |
| Gene Type | protein-coding | GO ID | GO:0006810 | UniProtAcc | O43861 |
Top |
Malignant transformation analysis |
| Identification of the aberrant gene expression in precancerous and cancerous lesions by comparing the gene expression of stem-like cells in diseased tissues with normal stem cells |
| Entrez ID | Symbol | Replicates | Species | Organ | Tissue | Adj P-value | Log2FC | Malignancy |
| 374868 | ATP9B | CCI_1 | Human | Cervix | CC | 1.63e-06 | 6.40e-01 | 0.528 |
| 374868 | ATP9B | CCI_3 | Human | Cervix | CC | 1.02e-14 | 9.52e-01 | 0.516 |
| 374868 | ATP9B | AEH-subject1 | Human | Endometrium | AEH | 3.77e-04 | 2.25e-01 | -0.3059 |
| 374868 | ATP9B | AEH-subject3 | Human | Endometrium | AEH | 2.92e-03 | 1.87e-01 | -0.2576 |
| 374868 | ATP9B | AEH-subject4 | Human | Endometrium | AEH | 7.62e-04 | 3.28e-01 | -0.2657 |
| 374868 | ATP9B | AEH-subject5 | Human | Endometrium | AEH | 4.81e-06 | 2.79e-01 | -0.2953 |
| 374868 | ATP9B | EEC-subject2 | Human | Endometrium | EEC | 4.17e-04 | 2.39e-01 | -0.2607 |
| 374868 | ATP9B | GSM6177620_NYU_UCEC1_lib1_lib1 | Human | Endometrium | EEC | 2.53e-04 | -1.19e-01 | -0.1869 |
| 374868 | ATP9B | GSM6177620_NYU_UCEC1_lib2_lib2 | Human | Endometrium | EEC | 9.43e-03 | -1.18e-01 | -0.1875 |
| 374868 | ATP9B | GSM6177620_NYU_UCEC1_lib3_lib3 | Human | Endometrium | EEC | 7.57e-05 | -1.34e-01 | -0.1883 |
| 374868 | ATP9B | GSM6177621_NYU_UCEC2_lib1_lib1 | Human | Endometrium | EEC | 7.89e-06 | -2.62e-02 | -0.1934 |
| 374868 | ATP9B | GSM6177622_NYU_UCEC3_lib1_lib1 | Human | Endometrium | EEC | 2.46e-10 | -7.97e-03 | -0.1917 |
| 374868 | ATP9B | GSM6177622_NYU_UCEC3_lib2_lib2 | Human | Endometrium | EEC | 1.47e-05 | -4.78e-02 | -0.1916 |
| 374868 | ATP9B | RNA-P10T2-P10T2-4 | Human | Lung | AAH | 4.42e-02 | 6.41e-01 | -0.138 |
| 374868 | ATP9B | RNA-P17T-P17T-4 | Human | Lung | IAC | 3.67e-03 | 5.56e-01 | 0.343 |
| 374868 | ATP9B | RNA-P25T1-P25T1-1 | Human | Lung | AIS | 2.09e-12 | 5.70e-01 | -0.2116 |
| 374868 | ATP9B | RNA-P25T1-P25T1-3 | Human | Lung | AIS | 1.92e-04 | 5.62e-01 | -0.2107 |
| 374868 | ATP9B | RNA-P25T1-P25T1-4 | Human | Lung | AIS | 1.73e-07 | 4.77e-01 | -0.2119 |
| 374868 | ATP9B | RNA-P6T2-P6T2-1 | Human | Lung | IAC | 3.11e-05 | 2.77e-01 | -0.0166 |
| 374868 | ATP9B | RNA-P6T2-P6T2-2 | Human | Lung | IAC | 3.57e-06 | 2.97e-01 | -0.0132 |
| Page: 1 2 3 |
| Tissue | Expression Dynamics | Abbreviation |
| Cervix | 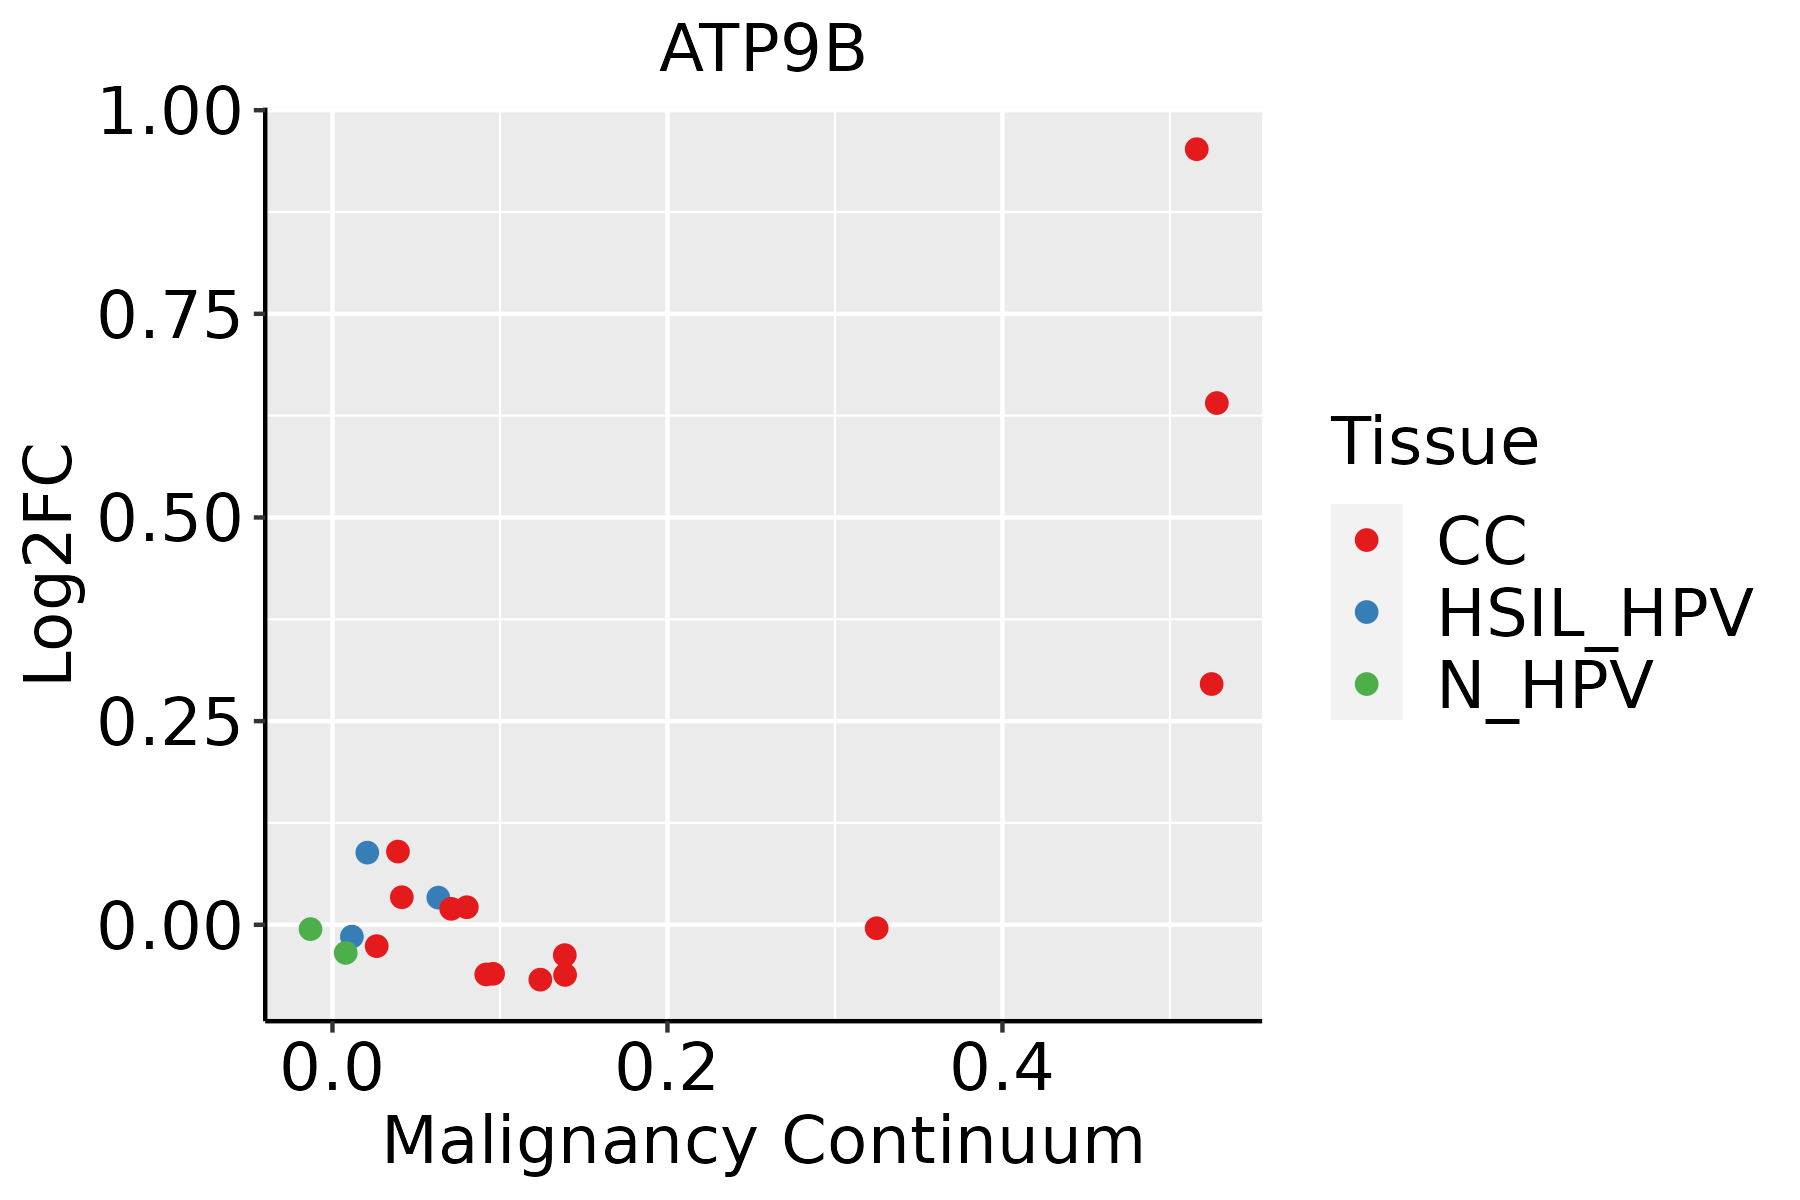 | CC: Cervix cancer |
| HSIL_HPV: HPV-infected high-grade squamous intraepithelial lesions | ||
| N_HPV: HPV-infected normal cervix | ||
| Endometrium | 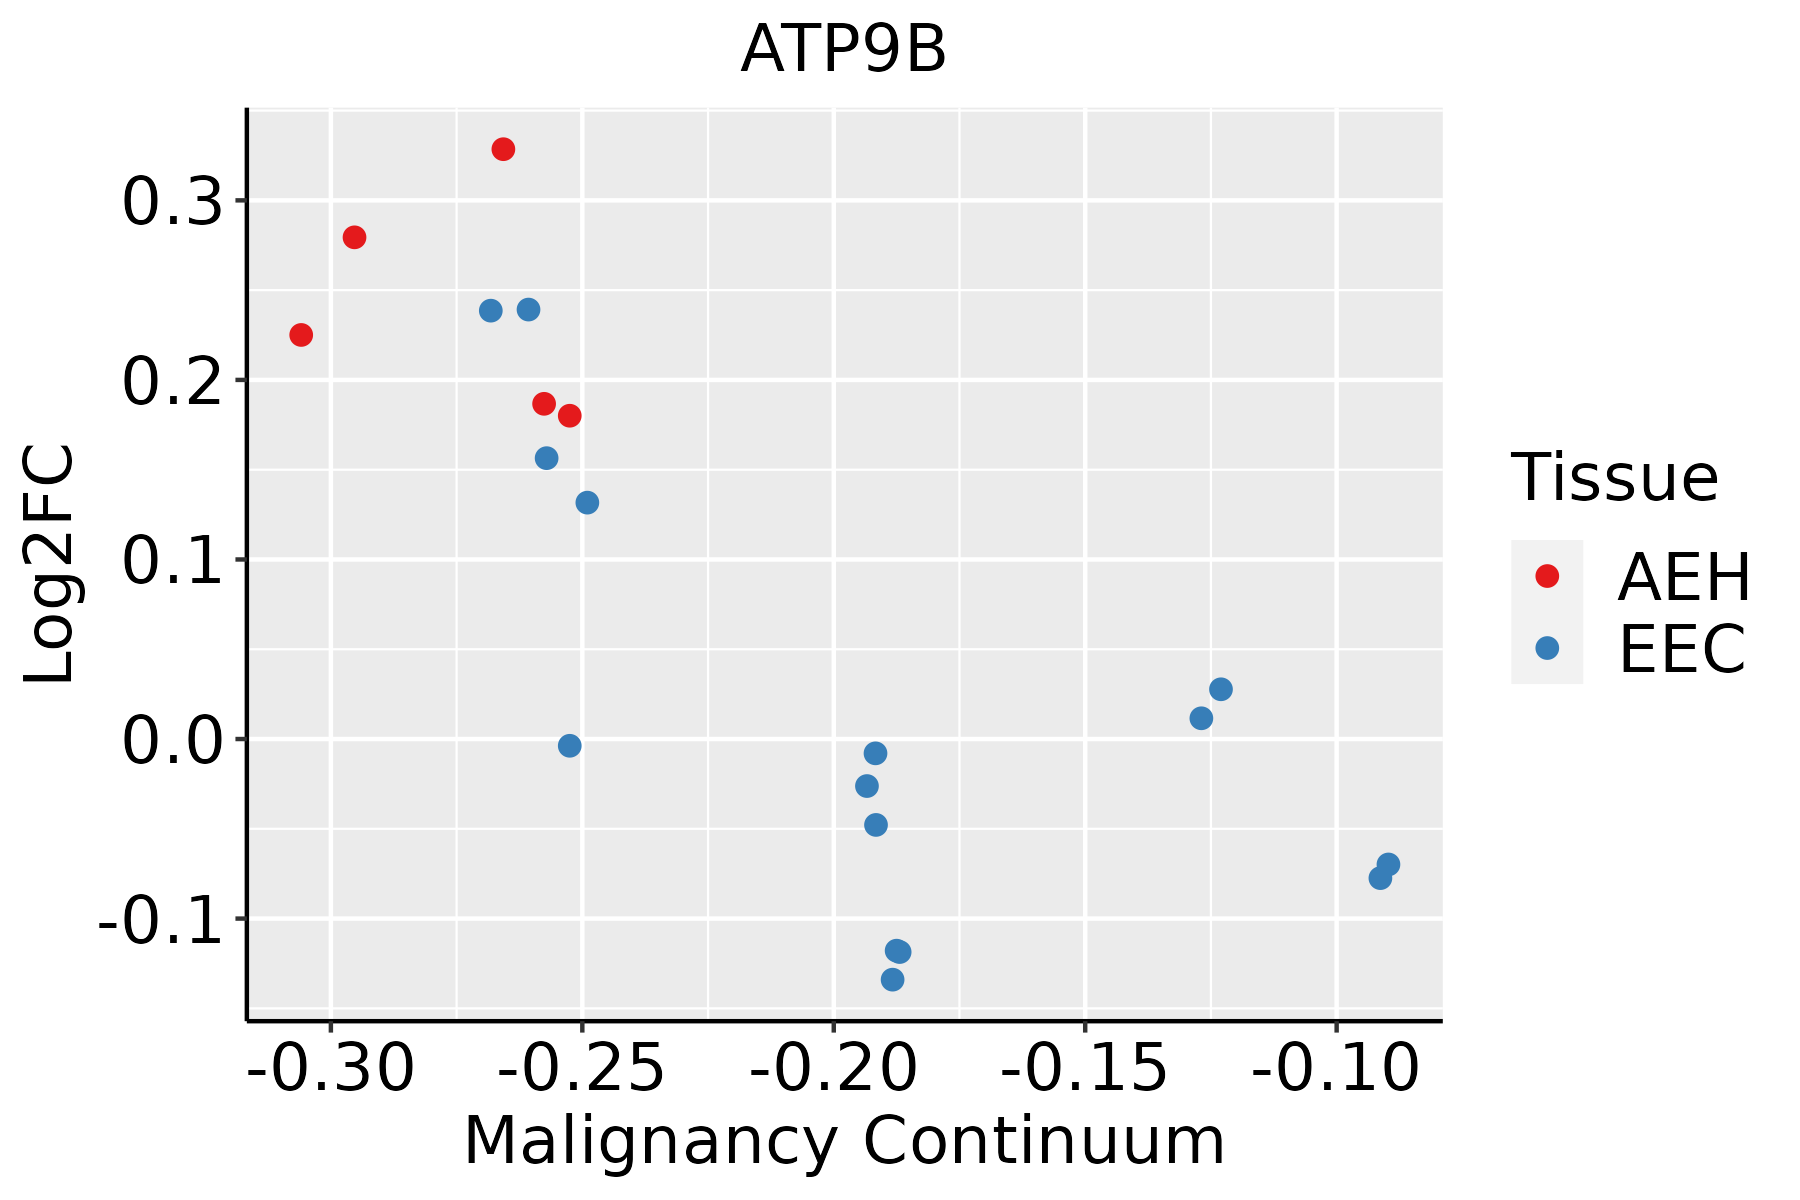 | AEH: Atypical endometrial hyperplasia |
| EEC: Endometrioid Cancer | ||
| Lung | 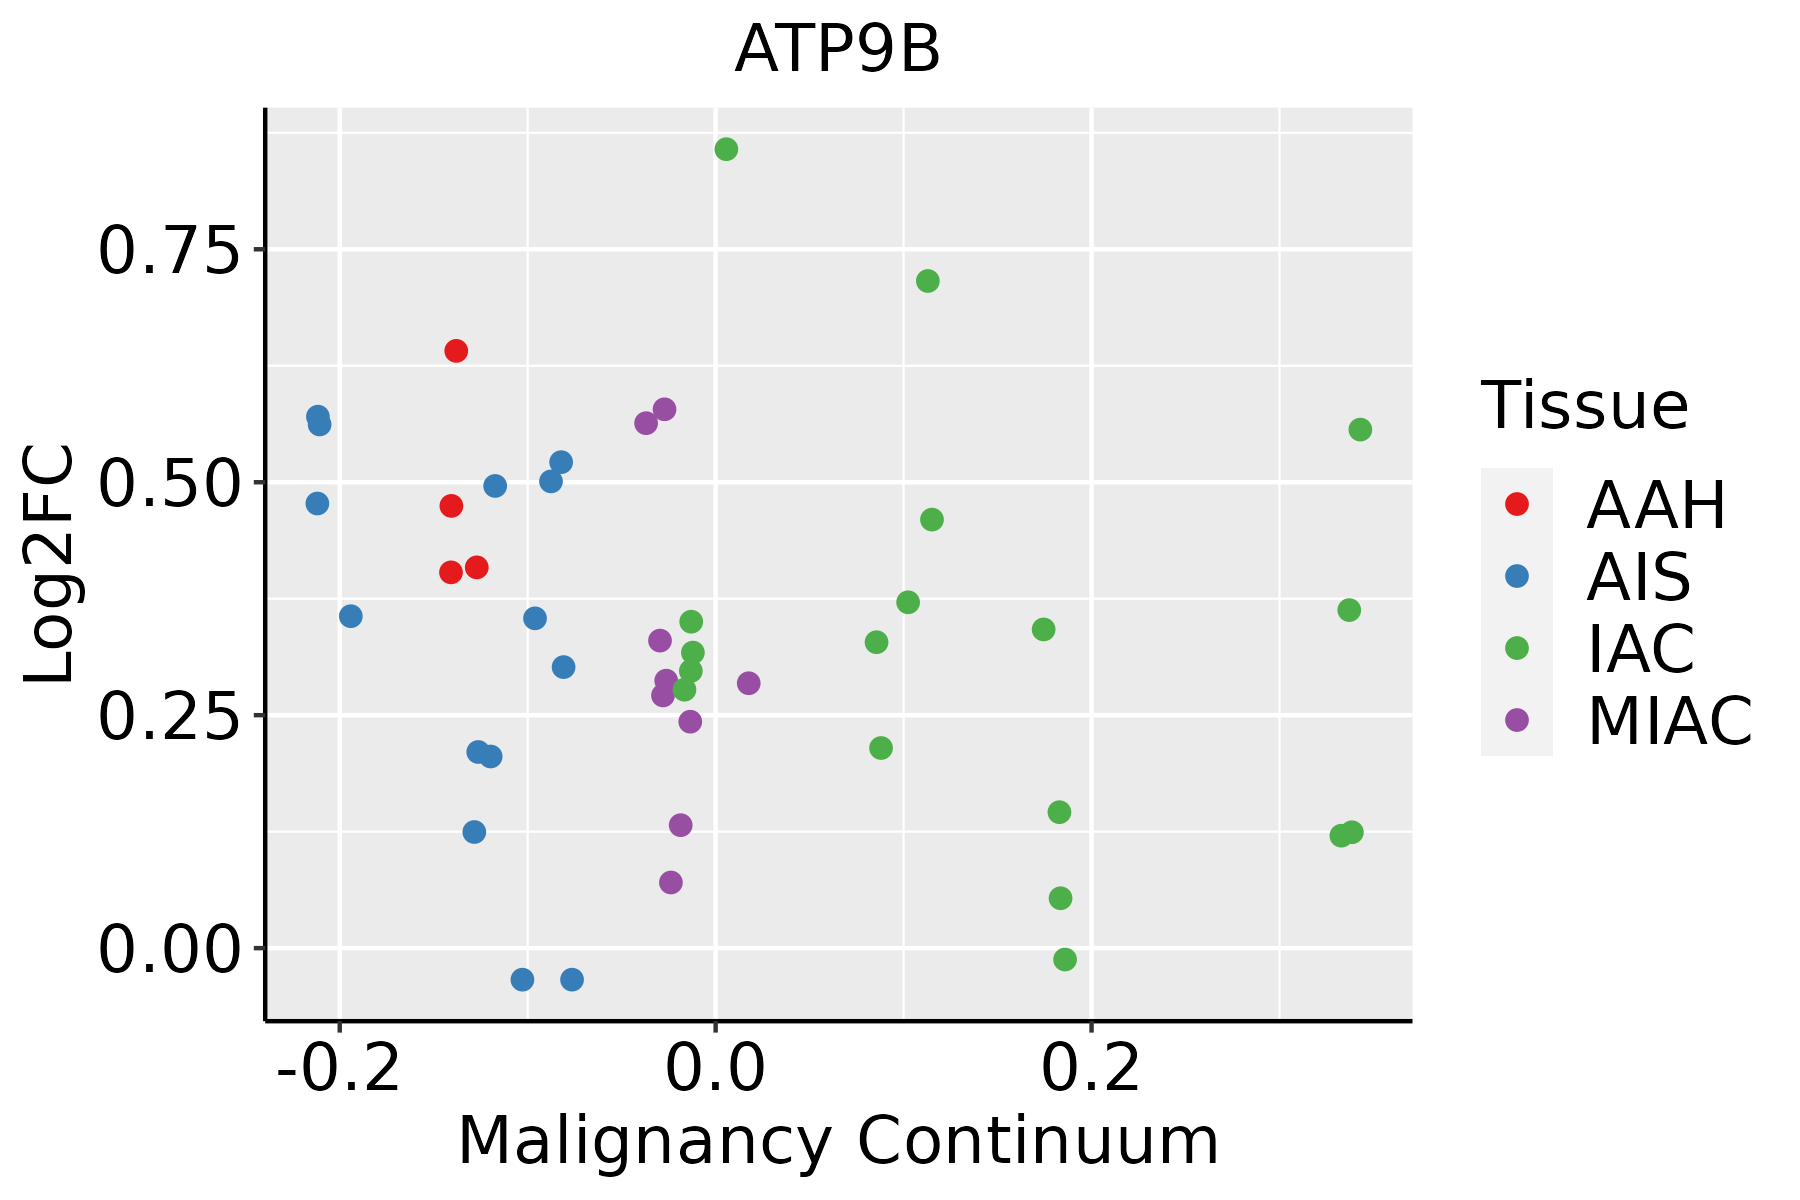 | AAH: Atypical adenomatous hyperplasia |
| AIS: Adenocarcinoma in situ | ||
| IAC: Invasive lung adenocarcinoma | ||
| MIA: Minimally invasive adenocarcinoma | ||
| Thyroid | 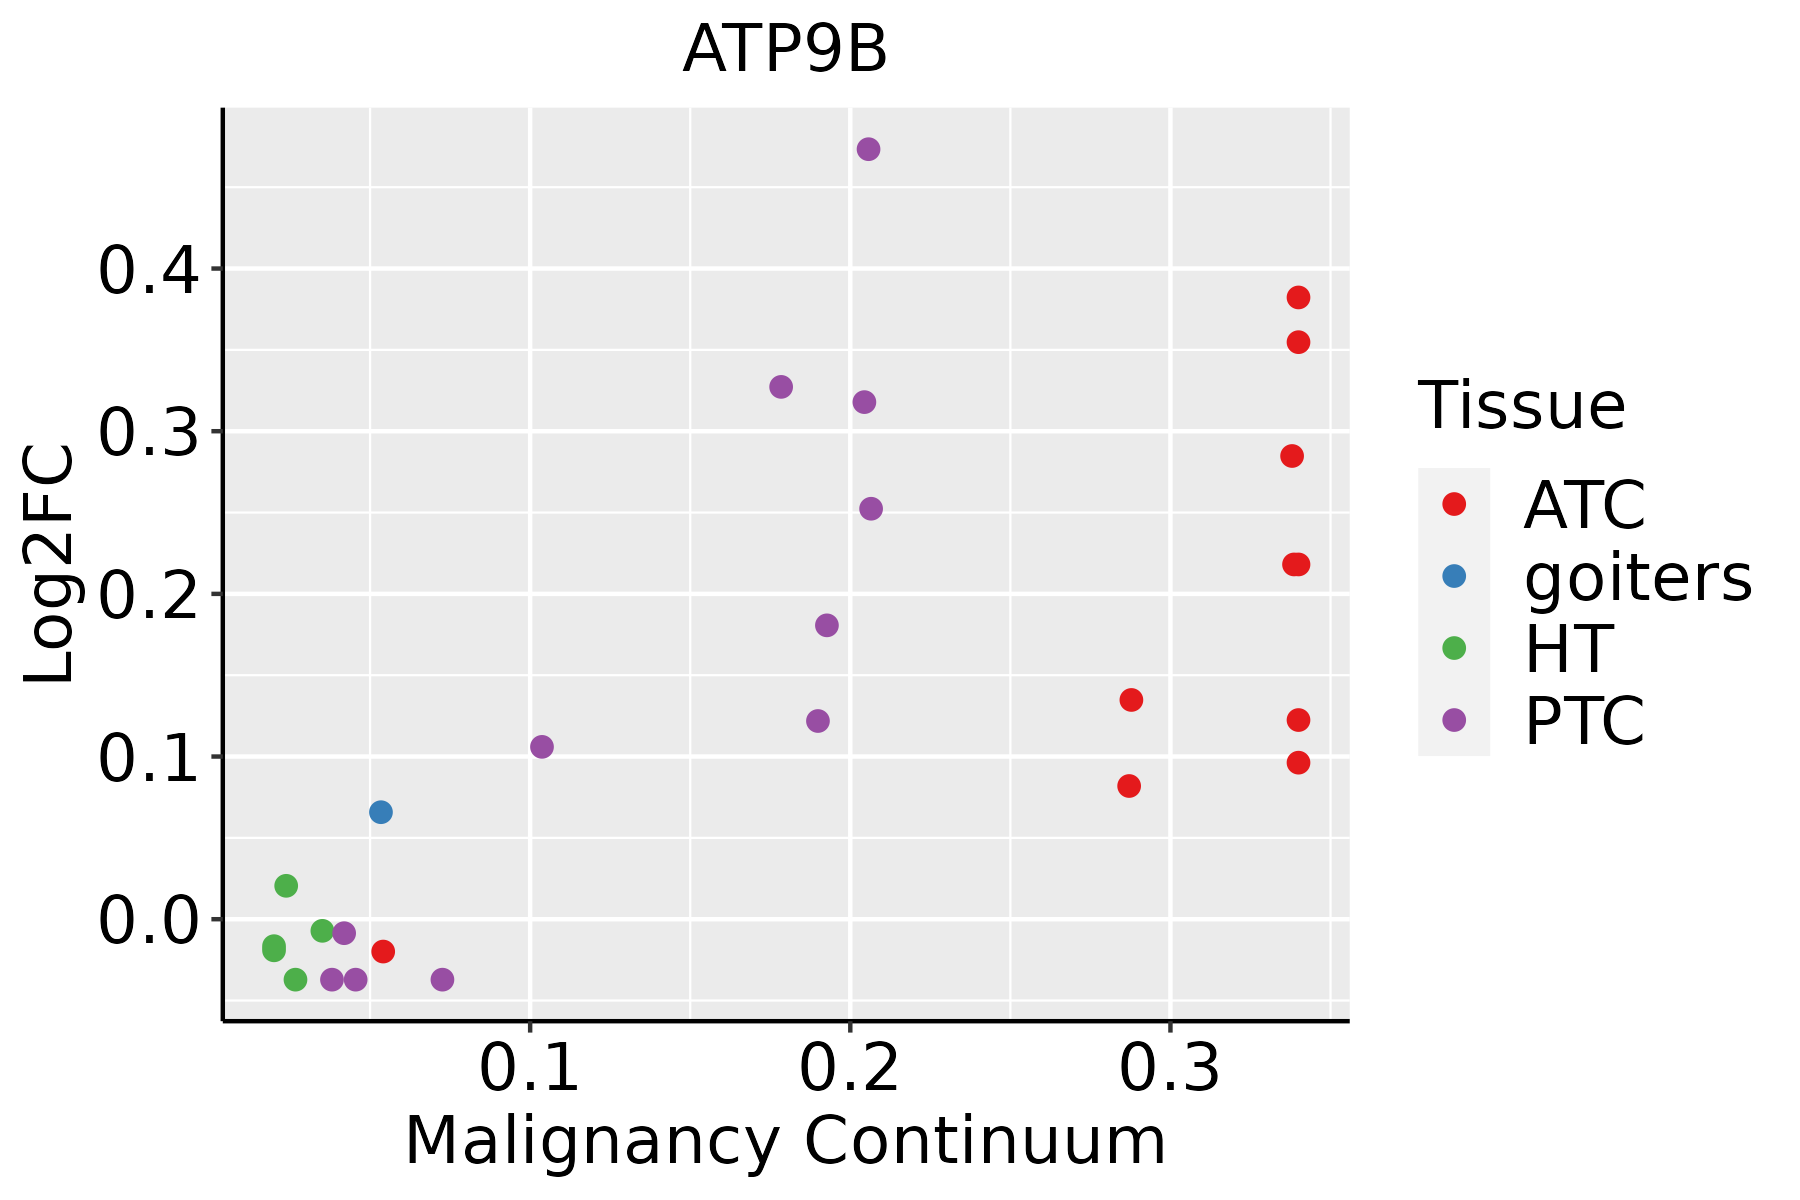 | ATC: Anaplastic thyroid cancer |
| HT: Hashimoto's thyroiditis | ||
| PTC: Papillary thyroid cancer |
| ∗log2FC in expression of this searched gene in stem-like cells from each diseased tissue sample relative to stem-like cells in normal samples in each tissue plotted against the malignancy continuum. Samples are colored based on if they are from different disease stage. |
Top |
Malignant transformation related pathway analysis |
| Find out the enriched GO biological processes and KEGG pathways involved in transition from healthy to precancer to cancer |
| Tissue | Disease Stage | Enriched GO biological Processes |
| Colorectum | AD |  |
| Colorectum | SER |  |
| Colorectum | MSS |  |
| Colorectum | MSI-H |  |
| Colorectum | FAP |  |
| ∗Top 15 enriched GO BP terms are showed in the bar plot of each disease state in each tissue. Each row represents a significant GO biological process which is colored according to the -log10(p.adjust). |
| Page: 1 2 3 4 5 6 7 8 9 |
| GO ID | Tissue | Disease Stage | Description | Gene Ratio | Bg Ratio | pvalue | p.adjust | Count |
| GO:00481938 | Cervix | CC | Golgi vesicle transport | 58/2311 | 296/18723 | 2.24e-04 | 2.54e-03 | 58 |
| GO:00068907 | Cervix | CC | retrograde vesicle-mediated transport, Golgi to endoplasmic reticulum | 15/2311 | 52/18723 | 1.15e-03 | 9.39e-03 | 15 |
| GO:00481939 | Endometrium | AEH | Golgi vesicle transport | 60/2100 | 296/18723 | 3.65e-06 | 9.79e-05 | 60 |
| GO:00068908 | Endometrium | AEH | retrograde vesicle-mediated transport, Golgi to endoplasmic reticulum | 15/2100 | 52/18723 | 4.20e-04 | 4.46e-03 | 15 |
| GO:004819313 | Endometrium | EEC | Golgi vesicle transport | 60/2168 | 296/18723 | 9.91e-06 | 2.17e-04 | 60 |
| GO:000689013 | Endometrium | EEC | retrograde vesicle-mediated transport, Golgi to endoplasmic reticulum | 15/2168 | 52/18723 | 5.90e-04 | 5.87e-03 | 15 |
| GO:00481937 | Lung | IAC | Golgi vesicle transport | 49/2061 | 296/18723 | 2.35e-03 | 2.28e-02 | 49 |
| GO:00159142 | Lung | IAC | phospholipid transport | 20/2061 | 96/18723 | 3.58e-03 | 3.00e-02 | 20 |
| GO:00157482 | Lung | IAC | organophosphate ester transport | 26/2061 | 140/18723 | 5.22e-03 | 3.97e-02 | 26 |
| GO:004819312 | Lung | AIS | Golgi vesicle transport | 46/1849 | 296/18723 | 1.32e-03 | 1.64e-02 | 46 |
| GO:001591411 | Lung | AIS | phospholipid transport | 18/1849 | 96/18723 | 5.64e-03 | 4.76e-02 | 18 |
| GO:004819320 | Thyroid | PTC | Golgi vesicle transport | 186/5968 | 296/18723 | 3.09e-28 | 1.22e-25 | 186 |
| GO:000689019 | Thyroid | PTC | retrograde vesicle-mediated transport, Golgi to endoplasmic reticulum | 37/5968 | 52/18723 | 6.98e-09 | 1.75e-07 | 37 |
| GO:0048193111 | Thyroid | ATC | Golgi vesicle transport | 189/6293 | 296/18723 | 9.58e-27 | 5.05e-24 | 189 |
| GO:0006890110 | Thyroid | ATC | retrograde vesicle-mediated transport, Golgi to endoplasmic reticulum | 37/6293 | 52/18723 | 3.45e-08 | 6.43e-07 | 37 |
| Page: 1 |
| Pathway ID | Tissue | Disease Stage | Description | Gene Ratio | Bg Ratio | pvalue | p.adjust | qvalue | Count |
| Page: 1 |
Top |
Cell-cell communication analysis |
| Identification of potential cell-cell interactions between two cell types and their ligand-receptor pairs for different disease states |
| Ligand | Receptor | LRpair | Pathway | Tissue | Disease Stage |
| Page: 1 |
Top |
Single-cell gene regulatory network inference analysis |
| Find out the significant the regulons (TFs) and the target genes of each regulon across cell types for different disease states |
| TF | Cell Type | Tissue | Disease Stage | Target Gene | RSS | Regulon Activity |
| ∗The dot plots of a searched regulon are shown for all cell subpopulations in each disease state of each tissue based on the regulon specific score inferred using pySCENIC and by calculating the average expression. |
| Page: 1 |
Top |
Somatic mutation of malignant transformation related genes |
| Annotation of somatic variants for genes involved in malignant transformation |
| Hugo Symbol | Variant Class | Variant Classification | dbSNP RS | HGVSc | HGVSp | HGVSp Short | SWISSPROT | BIOTYPE | SIFT | PolyPhen | Tumor Sample Barcode | Tissue | Histology | Sex | Age | Stage | Therapy Types | Drugs | Outcome |
| ATP9B | SNV | Missense_Mutation | novel | c.442N>T | p.Gly148Trp | p.G148W | O43861 | protein_coding | tolerated(0.18) | possibly_damaging(0.571) | TCGA-A7-A0DB-01 | Breast | breast invasive carcinoma | Female | <65 | I/II | Hormone Therapy | arimidex | SD |
| ATP9B | SNV | Missense_Mutation | c.3389T>G | p.Leu1130Arg | p.L1130R | O43861 | protein_coding | tolerated(0.15) | possibly_damaging(0.895) | TCGA-A8-A06P-01 | Breast | breast invasive carcinoma | Female | <65 | III/IV | Unspecific | SD | ||
| ATP9B | SNV | Missense_Mutation | novel | c.1466N>T | p.Ser489Phe | p.S489F | O43861 | protein_coding | deleterious(0) | probably_damaging(0.932) | TCGA-A8-A07W-01 | Breast | breast invasive carcinoma | Female | >=65 | III/IV | Hormone Therapy | exemestane | SD |
| ATP9B | SNV | Missense_Mutation | c.1527N>A | p.Met509Ile | p.M509I | O43861 | protein_coding | tolerated(0.2) | benign(0) | TCGA-AN-A0AK-01 | Breast | breast invasive carcinoma | Female | >=65 | I/II | Unknown | Unknown | SD | |
| ATP9B | SNV | Missense_Mutation | novel | c.1993N>T | p.Pro665Ser | p.P665S | O43861 | protein_coding | tolerated(1) | benign(0) | TCGA-BH-A18G-01 | Breast | breast invasive carcinoma | Female | >=65 | I/II | Unknown | Unknown | SD |
| ATP9B | SNV | Missense_Mutation | c.1324N>C | p.Asp442His | p.D442H | O43861 | protein_coding | deleterious(0) | probably_damaging(0.999) | TCGA-BH-A18Q-01 | Breast | breast invasive carcinoma | Female | <65 | I/II | Unknown | Unknown | SD | |
| ATP9B | SNV | Missense_Mutation | rs200396916 | c.1073G>A | p.Arg358Gln | p.R358Q | O43861 | protein_coding | deleterious(0) | probably_damaging(0.997) | TCGA-D8-A1JK-01 | Breast | breast invasive carcinoma | Female | >=65 | I/II | Unknown | Unknown | SD |
| ATP9B | insertion | Nonsense_Mutation | novel | c.1467_1468insAGCTAAAAAGACTTAATTTTT | p.Ser489_Tyr490insSerTerLysAspLeuIlePhe | p.S489_Y490insS*KDLIF | O43861 | protein_coding | TCGA-A8-A07W-01 | Breast | breast invasive carcinoma | Female | >=65 | III/IV | Hormone Therapy | exemestane | SD | ||
| ATP9B | insertion | Frame_Shift_Ins | novel | c.1313_1314insTTGTCATATCATATCCCATTTGTTCTGTTTTCCA | p.Met438IlefsTer17 | p.M438Ifs*17 | O43861 | protein_coding | TCGA-B6-A0I5-01 | Breast | breast invasive carcinoma | Female | <65 | I/II | Unknown | Unknown | SD | ||
| ATP9B | deletion | Frame_Shift_Del | novel | c.2123delN | p.Thr708IlefsTer5 | p.T708Ifs*5 | O43861 | protein_coding | TCGA-EW-A2FV-01 | Breast | breast invasive carcinoma | Female | <65 | III/IV | Chemotherapy | docetaxel | SD |
| Page: 1 2 3 4 5 6 7 8 9 10 11 |
Top |
Related drugs of malignant transformation related genes |
| Identification of chemicals and drugs interact with genes involved in malignant transfromation |
| (DGIdb 4.0) |
| Entrez ID | Symbol | Category | Interaction Types | Drug Claim Name | Drug Name | PMIDs |
| Page: 1 |

Copyright 2023-Present -The University of Texas Health Science Center at Houston |