
|
|||||
|
 | |
| |
| |
| |
| |
| |
|
Gene: ATP9A |
Gene summary for ATP9A |
| Gene information | Species | Human | Gene symbol | ATP9A | Gene ID | 10079 |
| Gene name | ATPase phospholipid transporting 9A (putative) | |
| Gene Alias | ATPIIA | |
| Cytomap | 20q13.2 | |
| Gene Type | protein-coding | GO ID | GO:0006810 | UniProtAcc | B4DR18 |
Top |
Malignant transformation analysis |
| Identification of the aberrant gene expression in precancerous and cancerous lesions by comparing the gene expression of stem-like cells in diseased tissues with normal stem cells |
| Entrez ID | Symbol | Replicates | Species | Organ | Tissue | Adj P-value | Log2FC | Malignancy |
| 10079 | ATP9A | CCI_1 | Human | Cervix | CC | 1.76e-04 | 5.23e-01 | 0.528 |
| 10079 | ATP9A | CCI_3 | Human | Cervix | CC | 2.33e-11 | 6.78e-01 | 0.516 |
| 10079 | ATP9A | HTA11_1938_2000001011 | Human | Colorectum | AD | 5.61e-08 | 7.10e-01 | -0.0811 |
| 10079 | ATP9A | HTA11_347_2000001011 | Human | Colorectum | AD | 5.07e-13 | 6.64e-01 | -0.1954 |
| 10079 | ATP9A | HTA11_411_2000001011 | Human | Colorectum | SER | 8.68e-04 | 8.07e-01 | -0.2602 |
| 10079 | ATP9A | HTA11_696_2000001011 | Human | Colorectum | AD | 6.27e-03 | 3.83e-01 | -0.1464 |
| 10079 | ATP9A | HTA11_866_2000001011 | Human | Colorectum | AD | 8.15e-05 | 4.35e-01 | -0.1001 |
| 10079 | ATP9A | HTA11_1391_2000001011 | Human | Colorectum | AD | 5.01e-03 | 5.00e-01 | -0.059 |
| 10079 | ATP9A | HTA11_866_3004761011 | Human | Colorectum | AD | 1.29e-06 | 6.06e-01 | 0.096 |
| 10079 | ATP9A | HTA11_6818_2000001011 | Human | Colorectum | AD | 5.41e-05 | 8.07e-01 | 0.0112 |
| 10079 | ATP9A | HTA11_6818_2000001021 | Human | Colorectum | AD | 8.16e-06 | 6.01e-01 | 0.0588 |
| 10079 | ATP9A | HTA11_99999965104_69814 | Human | Colorectum | MSS | 3.97e-21 | 1.09e+00 | 0.281 |
| 10079 | ATP9A | HTA11_99999971662_82457 | Human | Colorectum | MSS | 6.78e-18 | 1.05e+00 | 0.3859 |
| 10079 | ATP9A | HTA11_99999973899_84307 | Human | Colorectum | MSS | 2.92e-11 | 1.16e+00 | 0.2585 |
| 10079 | ATP9A | F007 | Human | Colorectum | FAP | 1.84e-03 | 2.89e-01 | 0.1176 |
| 10079 | ATP9A | A015-C-203 | Human | Colorectum | FAP | 8.40e-26 | -6.13e-02 | -0.1294 |
| 10079 | ATP9A | A015-C-204 | Human | Colorectum | FAP | 1.30e-03 | 1.77e-02 | -0.0228 |
| 10079 | ATP9A | A014-C-040 | Human | Colorectum | FAP | 5.66e-03 | -5.52e-02 | -0.1184 |
| 10079 | ATP9A | A002-C-201 | Human | Colorectum | FAP | 2.14e-10 | 3.69e-02 | 0.0324 |
| 10079 | ATP9A | A001-C-119 | Human | Colorectum | FAP | 2.99e-11 | 3.87e-01 | -0.1557 |
| Page: 1 2 3 4 5 6 7 8 |
| Tissue | Expression Dynamics | Abbreviation |
| Cervix | 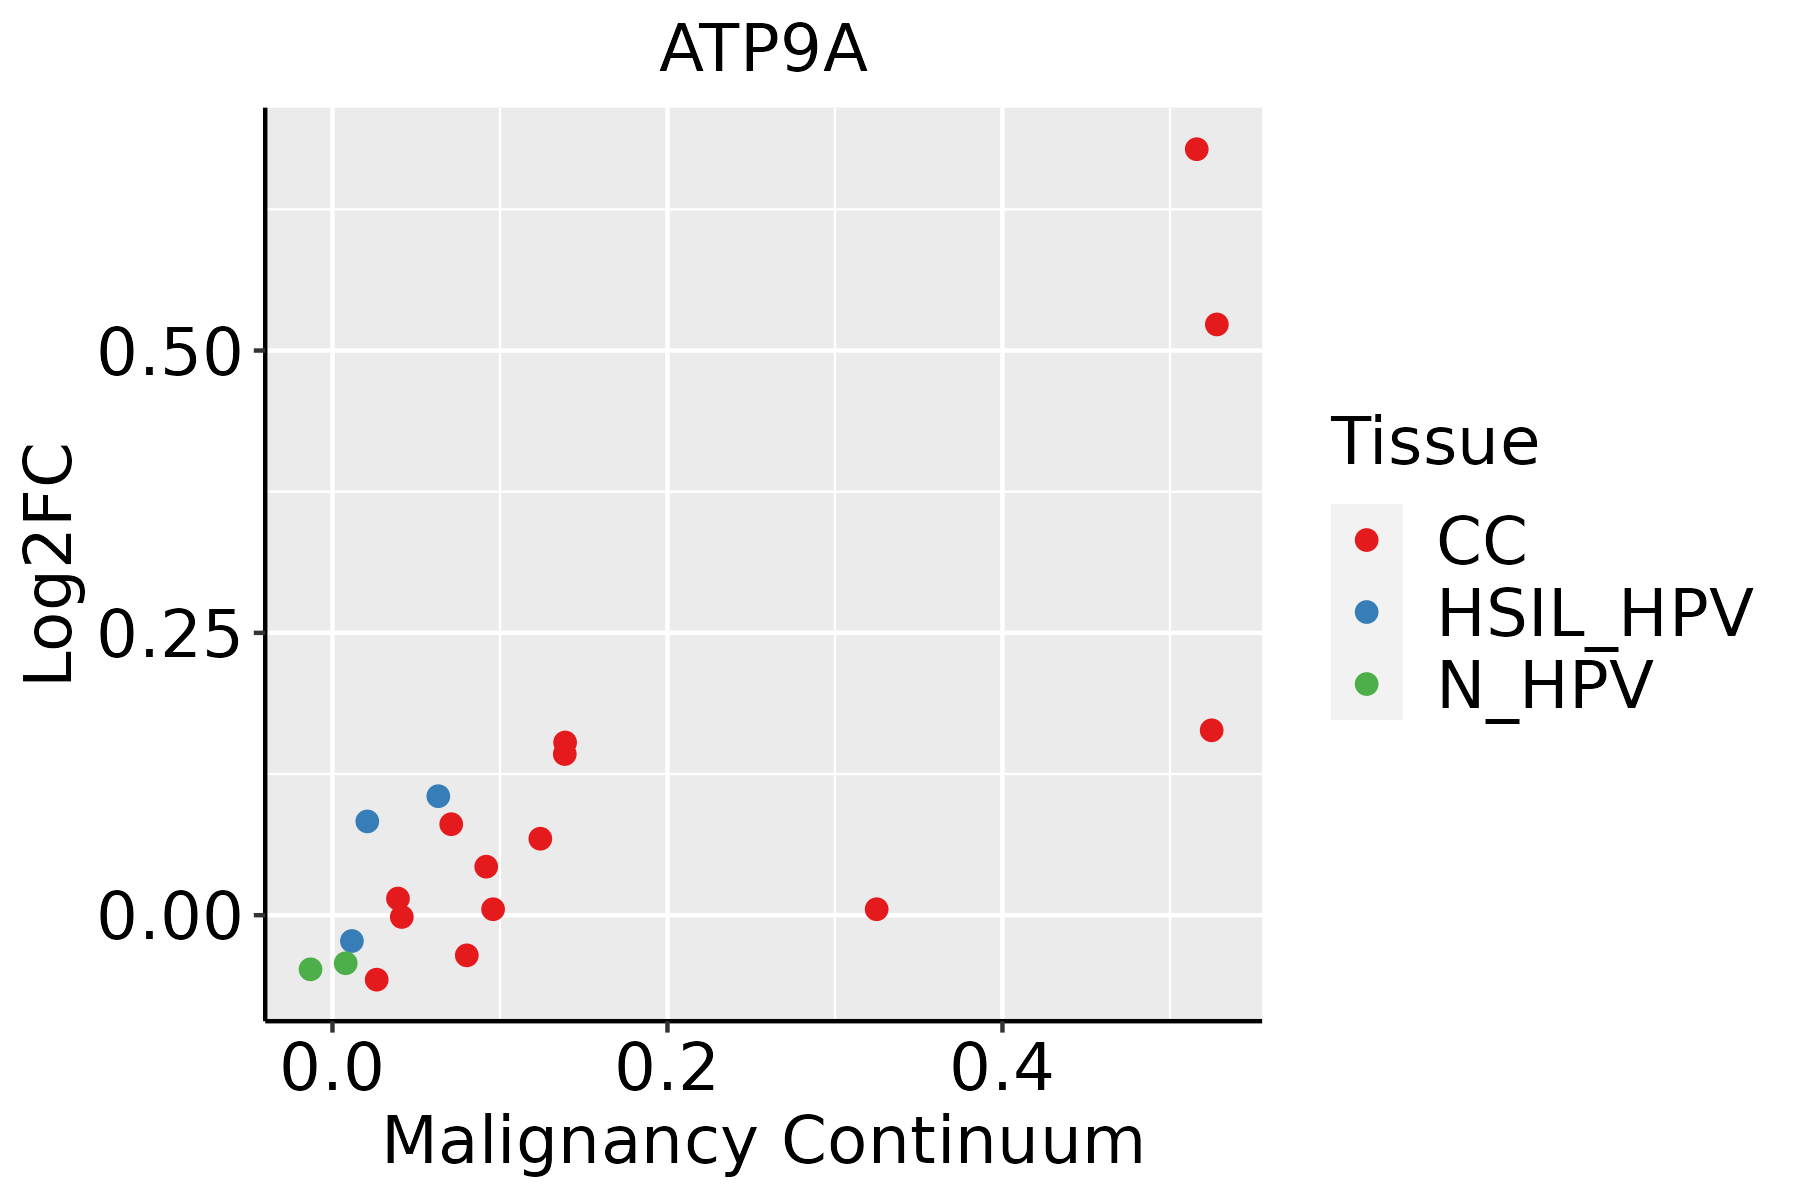 | CC: Cervix cancer |
| HSIL_HPV: HPV-infected high-grade squamous intraepithelial lesions | ||
| N_HPV: HPV-infected normal cervix | ||
| Colorectum (GSE201348) |  | FAP: Familial adenomatous polyposis |
| CRC: Colorectal cancer | ||
| Colorectum (HTA11) |  | AD: Adenomas |
| SER: Sessile serrated lesions | ||
| MSI-H: Microsatellite-high colorectal cancer | ||
| MSS: Microsatellite stable colorectal cancer | ||
| Endometrium |  | AEH: Atypical endometrial hyperplasia |
| EEC: Endometrioid Cancer | ||
| Esophagus |  | ESCC: Esophageal squamous cell carcinoma |
| HGIN: High-grade intraepithelial neoplasias | ||
| LGIN: Low-grade intraepithelial neoplasias | ||
| Liver | 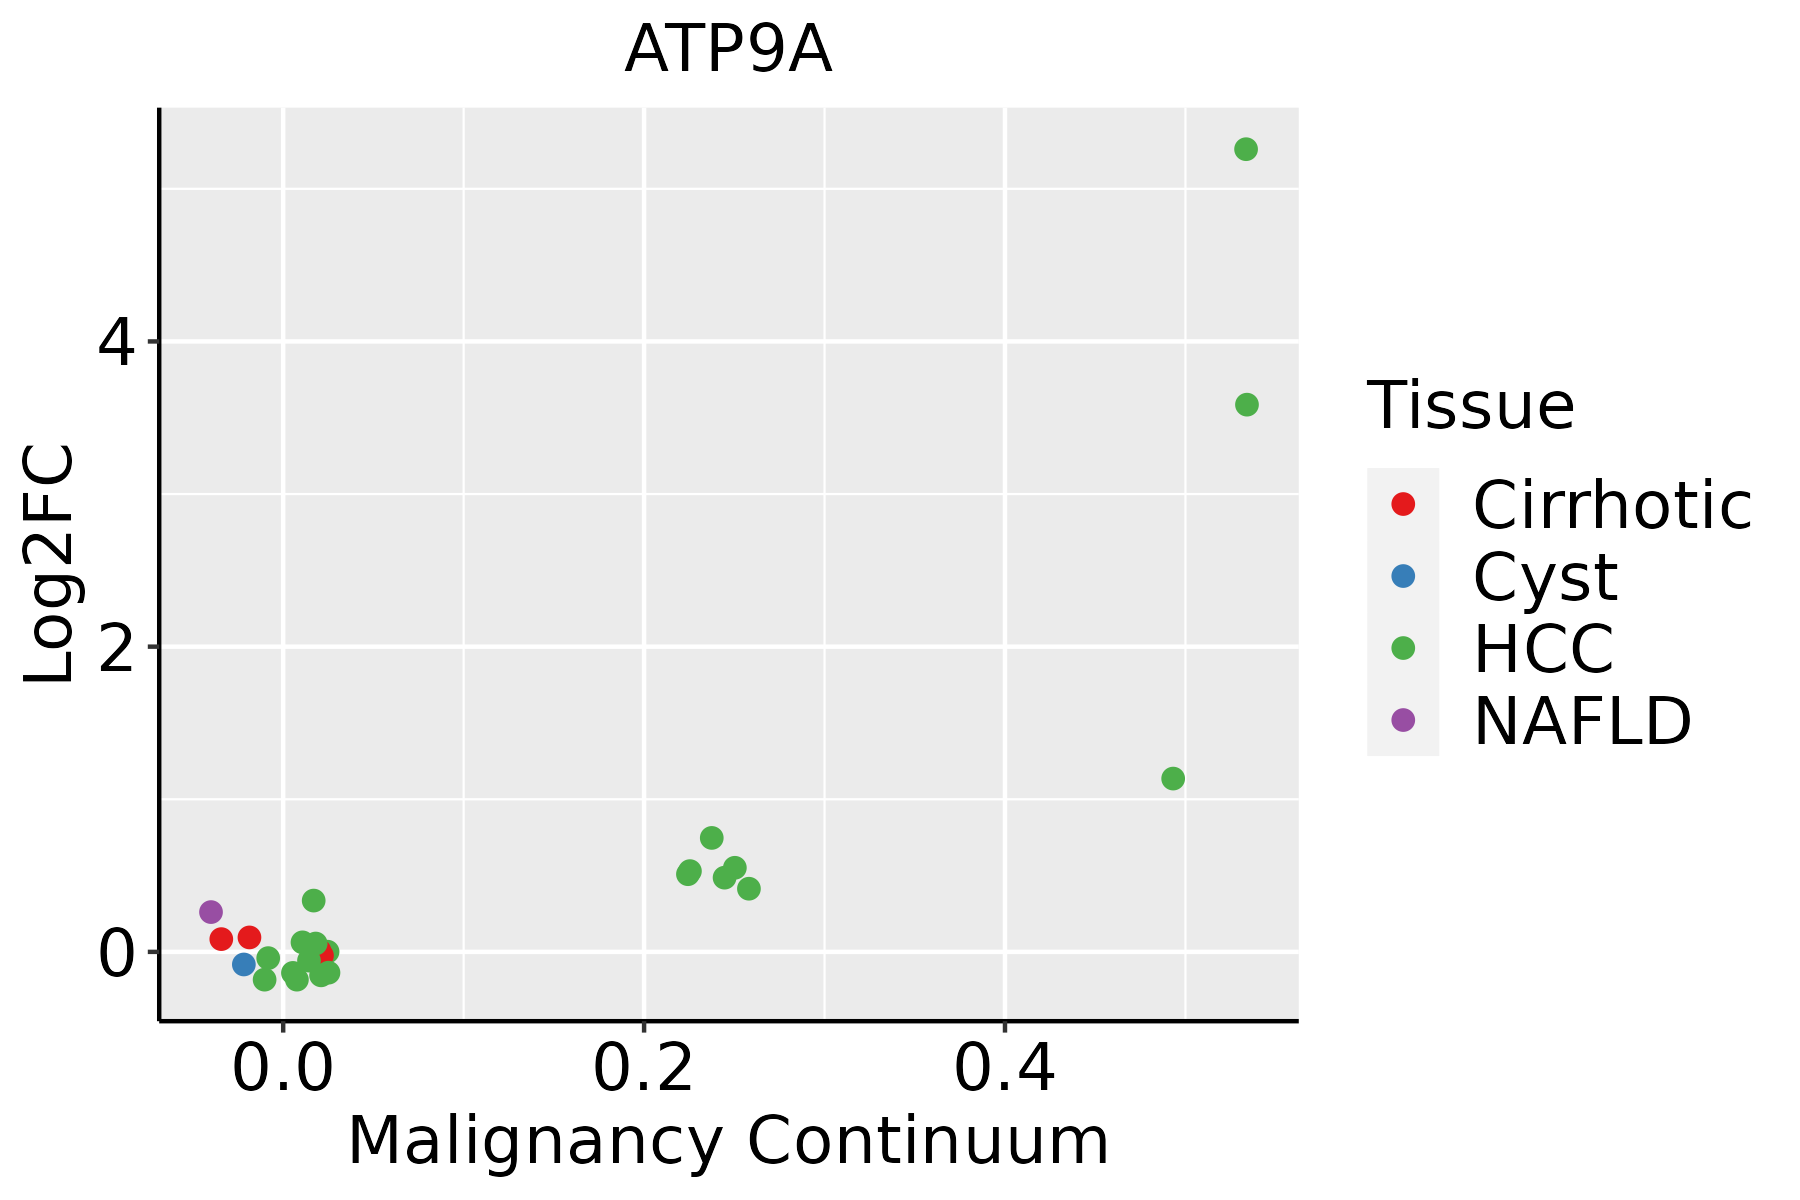 | HCC: Hepatocellular carcinoma |
| NAFLD: Non-alcoholic fatty liver disease | ||
| Prostate |  | BPH: Benign Prostatic Hyperplasia |
| Thyroid | 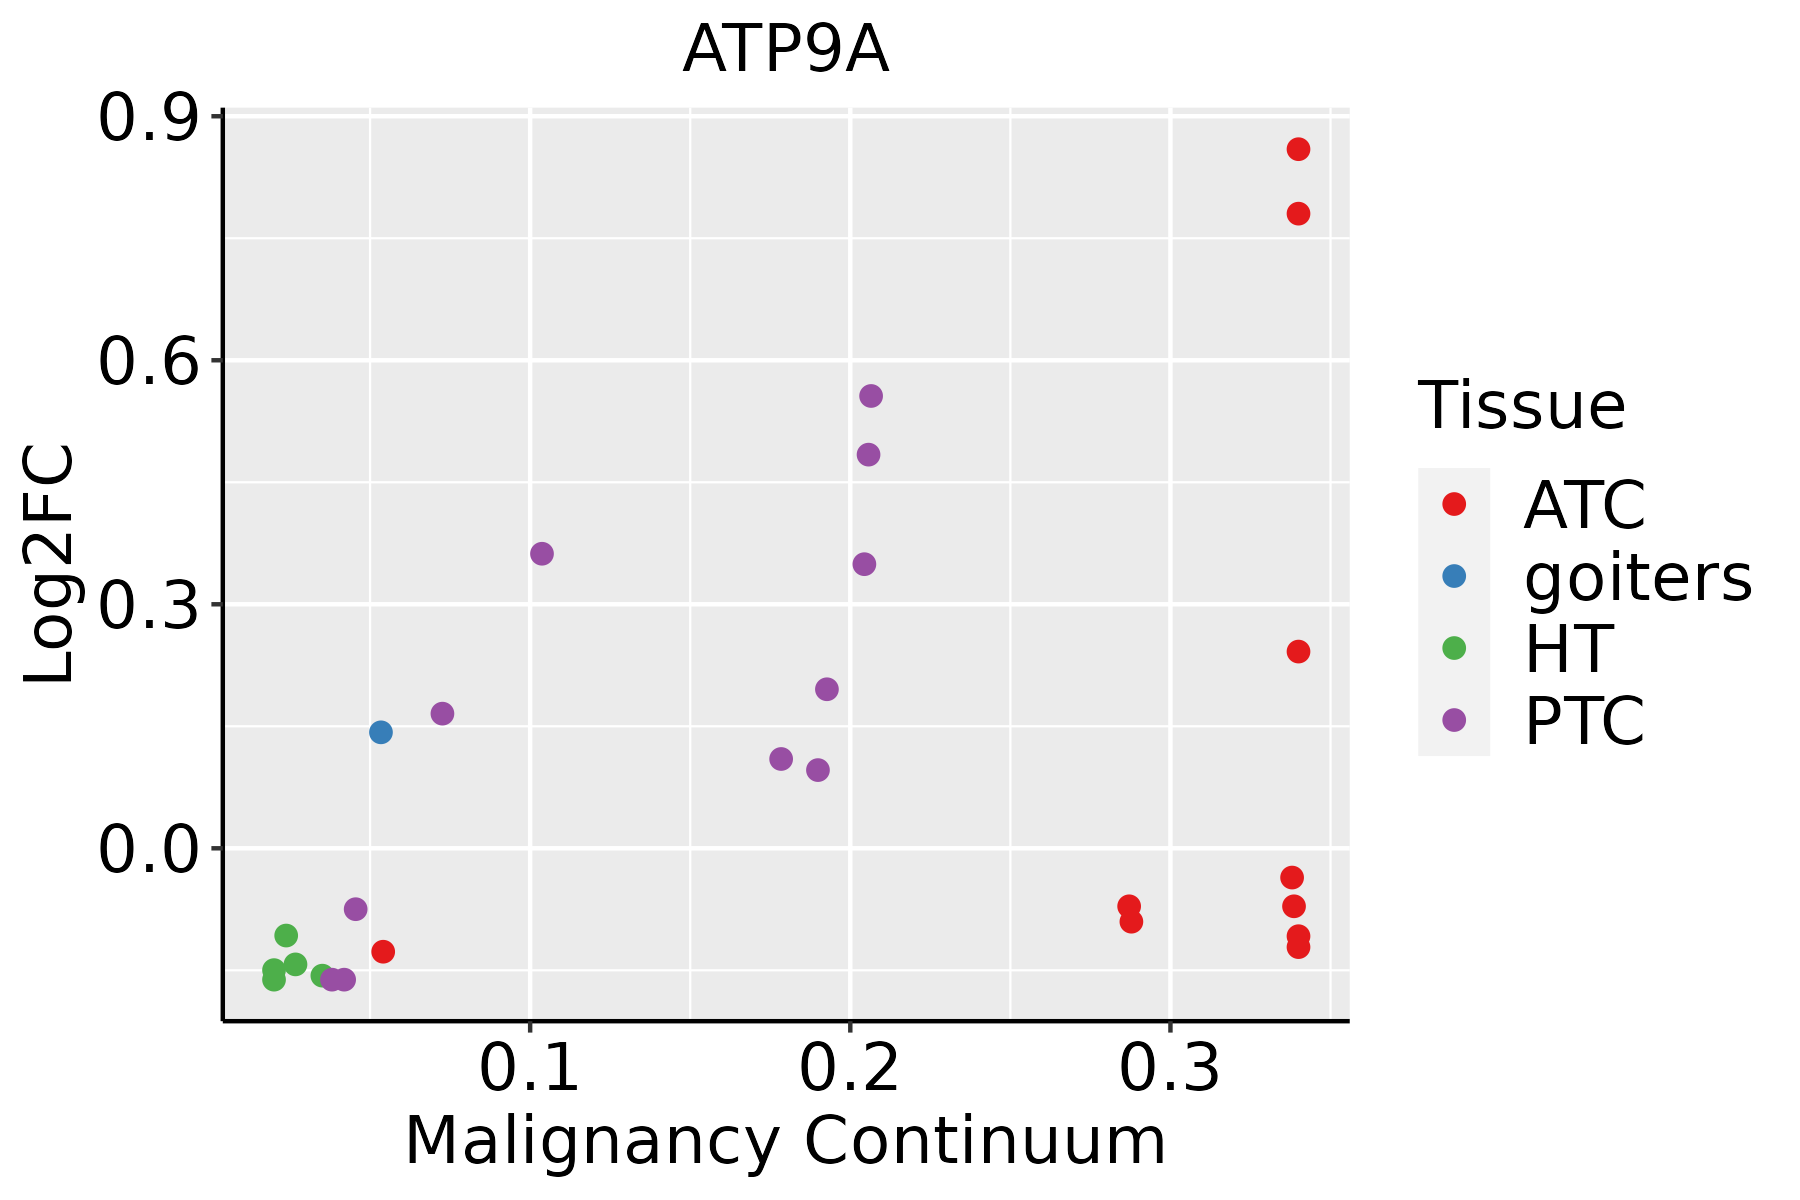 | ATC: Anaplastic thyroid cancer |
| HT: Hashimoto's thyroiditis | ||
| PTC: Papillary thyroid cancer |
| ∗log2FC in expression of this searched gene in stem-like cells from each diseased tissue sample relative to stem-like cells in normal samples in each tissue plotted against the malignancy continuum. Samples are colored based on if they are from different disease stage. |
Top |
Malignant transformation related pathway analysis |
| Find out the enriched GO biological processes and KEGG pathways involved in transition from healthy to precancer to cancer |
| Tissue | Disease Stage | Enriched GO biological Processes |
| Colorectum | AD |  |
| Colorectum | SER |  |
| Colorectum | MSS |  |
| Colorectum | MSI-H |  |
| Colorectum | FAP |  |
| ∗Top 15 enriched GO BP terms are showed in the bar plot of each disease state in each tissue. Each row represents a significant GO biological process which is colored according to the -log10(p.adjust). |
| Page: 1 2 3 4 5 6 7 8 9 |
| GO ID | Tissue | Disease Stage | Description | Gene Ratio | Bg Ratio | pvalue | p.adjust | Count |
| GO:00323868 | Cervix | CC | regulation of intracellular transport | 71/2311 | 337/18723 | 3.70e-06 | 9.74e-05 | 71 |
| GO:00988767 | Cervix | CC | vesicle-mediated transport to the plasma membrane | 34/2311 | 136/18723 | 3.75e-05 | 5.91e-04 | 34 |
| GO:00161977 | Cervix | CC | endosomal transport | 48/2311 | 230/18723 | 1.65e-04 | 1.97e-03 | 48 |
| GO:00481938 | Cervix | CC | Golgi vesicle transport | 58/2311 | 296/18723 | 2.24e-04 | 2.54e-03 | 58 |
| GO:00068907 | Cervix | CC | retrograde vesicle-mediated transport, Golgi to endoplasmic reticulum | 15/2311 | 52/18723 | 1.15e-03 | 9.39e-03 | 15 |
| GO:00171574 | Cervix | CC | regulation of exocytosis | 39/2311 | 202/18723 | 2.90e-03 | 1.93e-02 | 39 |
| GO:00164827 | Cervix | CC | cytosolic transport | 33/2311 | 168/18723 | 4.43e-03 | 2.70e-02 | 33 |
| GO:19901827 | Cervix | CC | exosomal secretion | 7/2311 | 20/18723 | 7.78e-03 | 4.10e-02 | 7 |
| GO:00068873 | Cervix | CC | exocytosis | 59/2311 | 352/18723 | 8.74e-03 | 4.48e-02 | 59 |
| GO:00977347 | Cervix | CC | extracellular exosome biogenesis | 7/2311 | 21/18723 | 1.04e-02 | 4.97e-02 | 7 |
| GO:0048193 | Colorectum | AD | Golgi vesicle transport | 109/3918 | 296/18723 | 1.80e-10 | 1.68e-08 | 109 |
| GO:0016197 | Colorectum | AD | endosomal transport | 90/3918 | 230/18723 | 1.88e-10 | 1.73e-08 | 90 |
| GO:0016482 | Colorectum | AD | cytosolic transport | 68/3918 | 168/18723 | 6.00e-09 | 3.72e-07 | 68 |
| GO:0098876 | Colorectum | AD | vesicle-mediated transport to the plasma membrane | 57/3918 | 136/18723 | 2.30e-08 | 1.27e-06 | 57 |
| GO:1990182 | Colorectum | AD | exosomal secretion | 16/3918 | 20/18723 | 2.67e-08 | 1.47e-06 | 16 |
| GO:0097734 | Colorectum | AD | extracellular exosome biogenesis | 16/3918 | 21/18723 | 9.02e-08 | 4.52e-06 | 16 |
| GO:0032386 | Colorectum | AD | regulation of intracellular transport | 109/3918 | 337/18723 | 5.33e-07 | 1.95e-05 | 109 |
| GO:0140112 | Colorectum | AD | extracellular vesicle biogenesis | 16/3918 | 23/18723 | 7.04e-07 | 2.49e-05 | 16 |
| GO:0006890 | Colorectum | AD | retrograde vesicle-mediated transport, Golgi to endoplasmic reticulum | 27/3918 | 52/18723 | 7.67e-07 | 2.70e-05 | 27 |
| GO:1903541 | Colorectum | AD | regulation of exosomal secretion | 13/3918 | 17/18723 | 1.46e-06 | 4.58e-05 | 13 |
| Page: 1 2 3 4 5 6 7 8 9 10 |
| Pathway ID | Tissue | Disease Stage | Description | Gene Ratio | Bg Ratio | pvalue | p.adjust | qvalue | Count |
| Page: 1 |
Top |
Cell-cell communication analysis |
| Identification of potential cell-cell interactions between two cell types and their ligand-receptor pairs for different disease states |
| Ligand | Receptor | LRpair | Pathway | Tissue | Disease Stage |
| Page: 1 |
Top |
Single-cell gene regulatory network inference analysis |
| Find out the significant the regulons (TFs) and the target genes of each regulon across cell types for different disease states |
| TF | Cell Type | Tissue | Disease Stage | Target Gene | RSS | Regulon Activity |
| ∗The dot plots of a searched regulon are shown for all cell subpopulations in each disease state of each tissue based on the regulon specific score inferred using pySCENIC and by calculating the average expression. |
| Page: 1 |
Top |
Somatic mutation of malignant transformation related genes |
| Annotation of somatic variants for genes involved in malignant transformation |
| Hugo Symbol | Variant Class | Variant Classification | dbSNP RS | HGVSc | HGVSp | HGVSp Short | SWISSPROT | BIOTYPE | SIFT | PolyPhen | Tumor Sample Barcode | Tissue | Histology | Sex | Age | Stage | Therapy Types | Drugs | Outcome |
| ATP9A | SNV | Missense_Mutation | c.2140N>T | p.Leu714Phe | p.L714F | O75110 | protein_coding | tolerated(0.05) | probably_damaging(0.949) | TCGA-A2-A0SV-01 | Breast | breast invasive carcinoma | Female | <65 | III/IV | Other, specify in notesBisphosphonate therapy | zometa | PD | |
| ATP9A | SNV | Missense_Mutation | rs764422261 | c.1480N>A | p.Val494Ile | p.V494I | O75110 | protein_coding | tolerated(0.06) | benign(0.041) | TCGA-A2-A0SX-01 | Breast | breast invasive carcinoma | Female | <65 | I/II | Chemotherapy | adriamycin | PD |
| ATP9A | SNV | Missense_Mutation | c.2092N>A | p.Gln698Lys | p.Q698K | O75110 | protein_coding | deleterious(0.02) | possibly_damaging(0.555) | TCGA-A2-A25E-01 | Breast | breast invasive carcinoma | Female | <65 | III/IV | Chemotherapy | cytoxan | PD | |
| ATP9A | SNV | Missense_Mutation | c.760A>T | p.Ile254Leu | p.I254L | O75110 | protein_coding | tolerated(0.27) | benign(0.044) | TCGA-B6-A0RS-01 | Breast | breast invasive carcinoma | Female | <65 | I/II | Unknown | Unknown | PD | |
| ATP9A | SNV | Missense_Mutation | c.148G>C | p.Asp50His | p.D50H | O75110 | protein_coding | tolerated(0.1) | benign(0) | TCGA-BH-A0DI-01 | Breast | breast invasive carcinoma | Female | <65 | I/II | Chemotherapy | adriamycin | CR | |
| ATP9A | SNV | Missense_Mutation | c.827N>G | p.Thr276Ser | p.T276S | O75110 | protein_coding | deleterious(0) | probably_damaging(0.996) | TCGA-BH-A1F0-01 | Breast | breast invasive carcinoma | Female | >=65 | I/II | Unknown | Unknown | PD | |
| ATP9A | SNV | Missense_Mutation | c.1546C>A | p.Leu516Met | p.L516M | O75110 | protein_coding | deleterious(0) | probably_damaging(0.983) | TCGA-D8-A1XQ-01 | Breast | breast invasive carcinoma | Female | >=65 | I/II | Unknown | Unknown | SD | |
| ATP9A | SNV | Missense_Mutation | c.2018N>A | p.Val673Asp | p.V673D | O75110 | protein_coding | deleterious(0) | probably_damaging(0.965) | TCGA-D8-A27M-01 | Breast | breast invasive carcinoma | Female | <65 | I/II | Chemotherapy | methotrexate+5 | SD | |
| ATP9A | SNV | Missense_Mutation | c.1209C>G | p.Phe403Leu | p.F403L | O75110 | protein_coding | tolerated(0.63) | benign(0.074) | TCGA-E2-A1IN-01 | Breast | breast invasive carcinoma | Female | <65 | I/II | Hormone Therapy | arimidex | SD | |
| ATP9A | SNV | Missense_Mutation | novel | c.1834C>A | p.Gln612Lys | p.Q612K | O75110 | protein_coding | tolerated(0.39) | benign(0.216) | TCGA-E2-A1L7-01 | Breast | breast invasive carcinoma | Female | <65 | III/IV | Chemotherapy | cyclophosphamide | PD |
| Page: 1 2 3 4 5 6 7 8 9 10 11 12 13 14 15 16 |
Top |
Related drugs of malignant transformation related genes |
| Identification of chemicals and drugs interact with genes involved in malignant transfromation |
| (DGIdb 4.0) |
| Entrez ID | Symbol | Category | Interaction Types | Drug Claim Name | Drug Name | PMIDs |
| Page: 1 |

Copyright 2023-Present -The University of Texas Health Science Center at Houston |