| Tissue | Expression Dynamics | Abbreviation |
| Cervix | 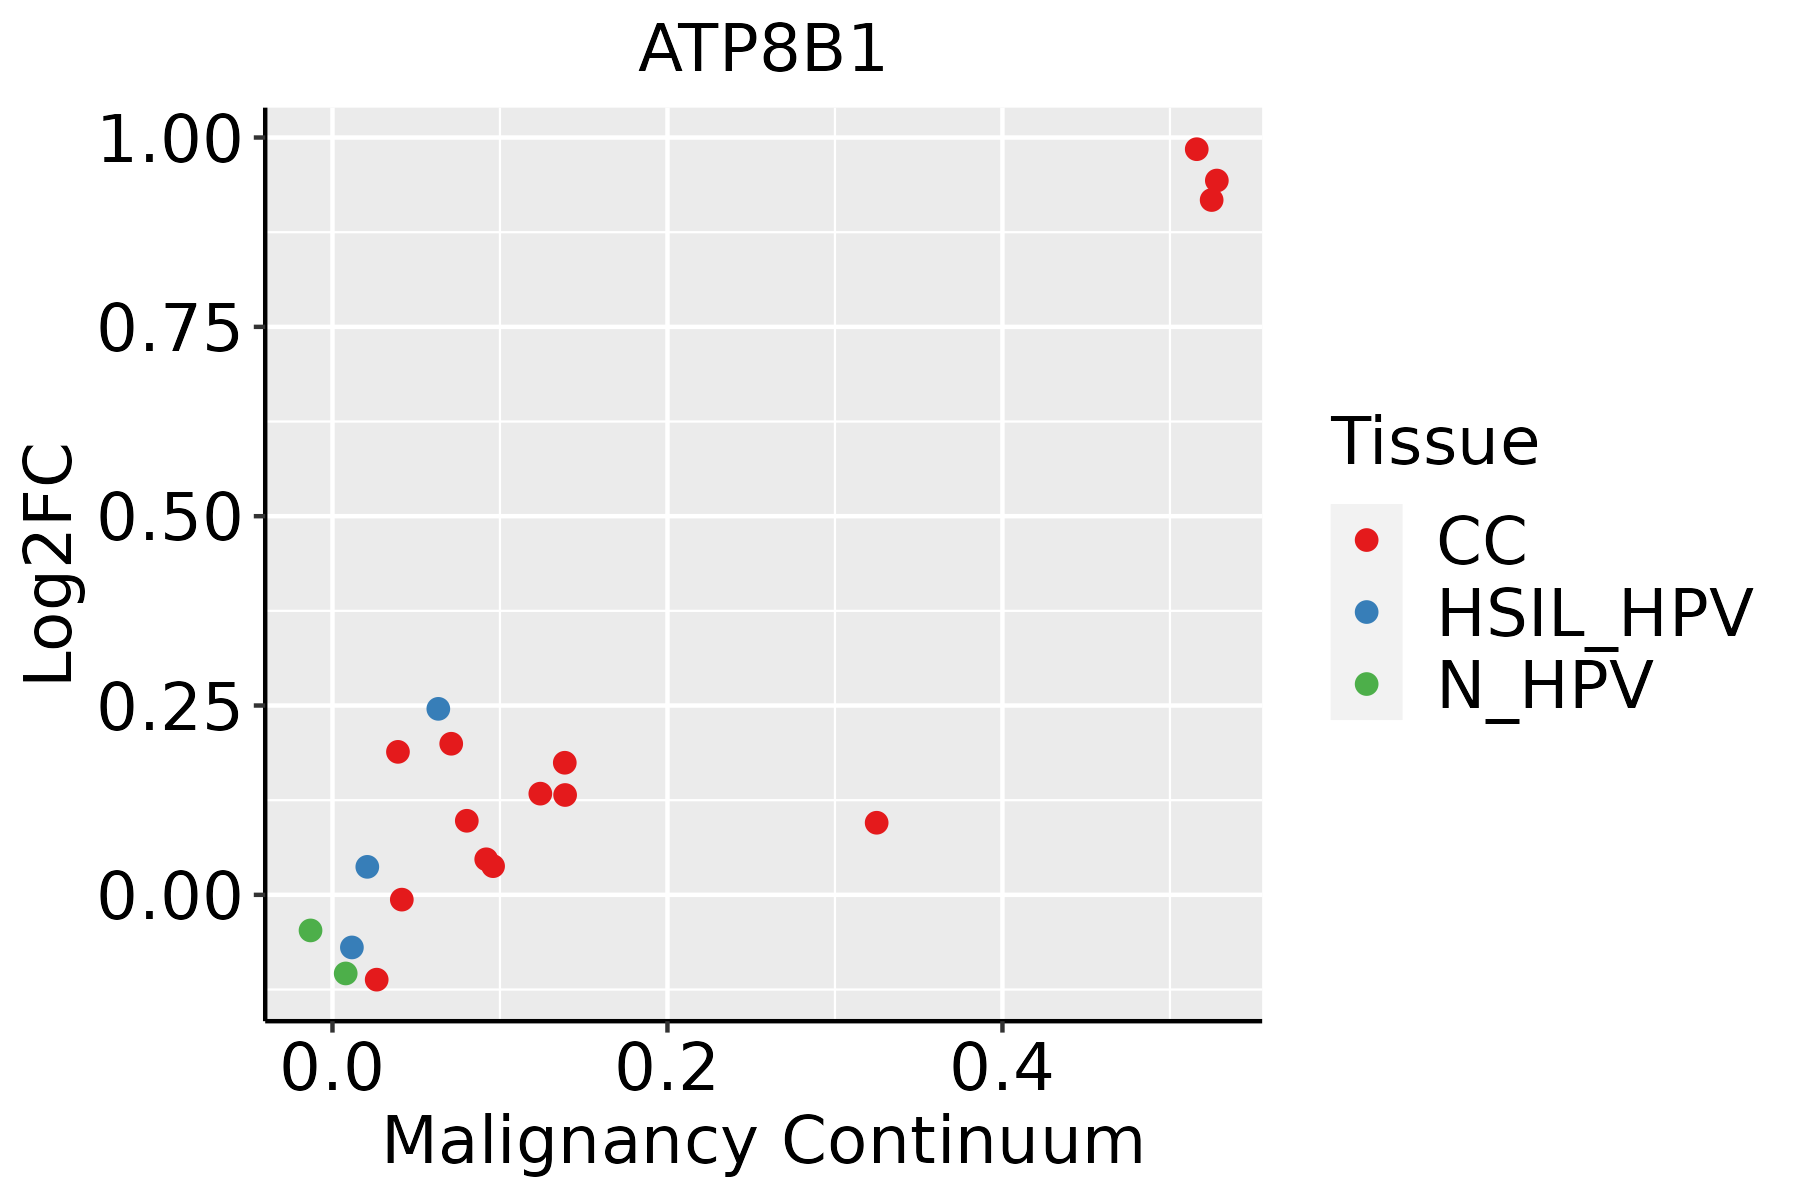 | CC: Cervix cancer |
| HSIL_HPV: HPV-infected high-grade squamous intraepithelial lesions |
| N_HPV: HPV-infected normal cervix |
| Colorectum (GSE201348) |  | FAP: Familial adenomatous polyposis |
| CRC: Colorectal cancer |
| Colorectum (HTA11) |  | AD: Adenomas |
| SER: Sessile serrated lesions |
| MSI-H: Microsatellite-high colorectal cancer |
| MSS: Microsatellite stable colorectal cancer |
| Endometrium | 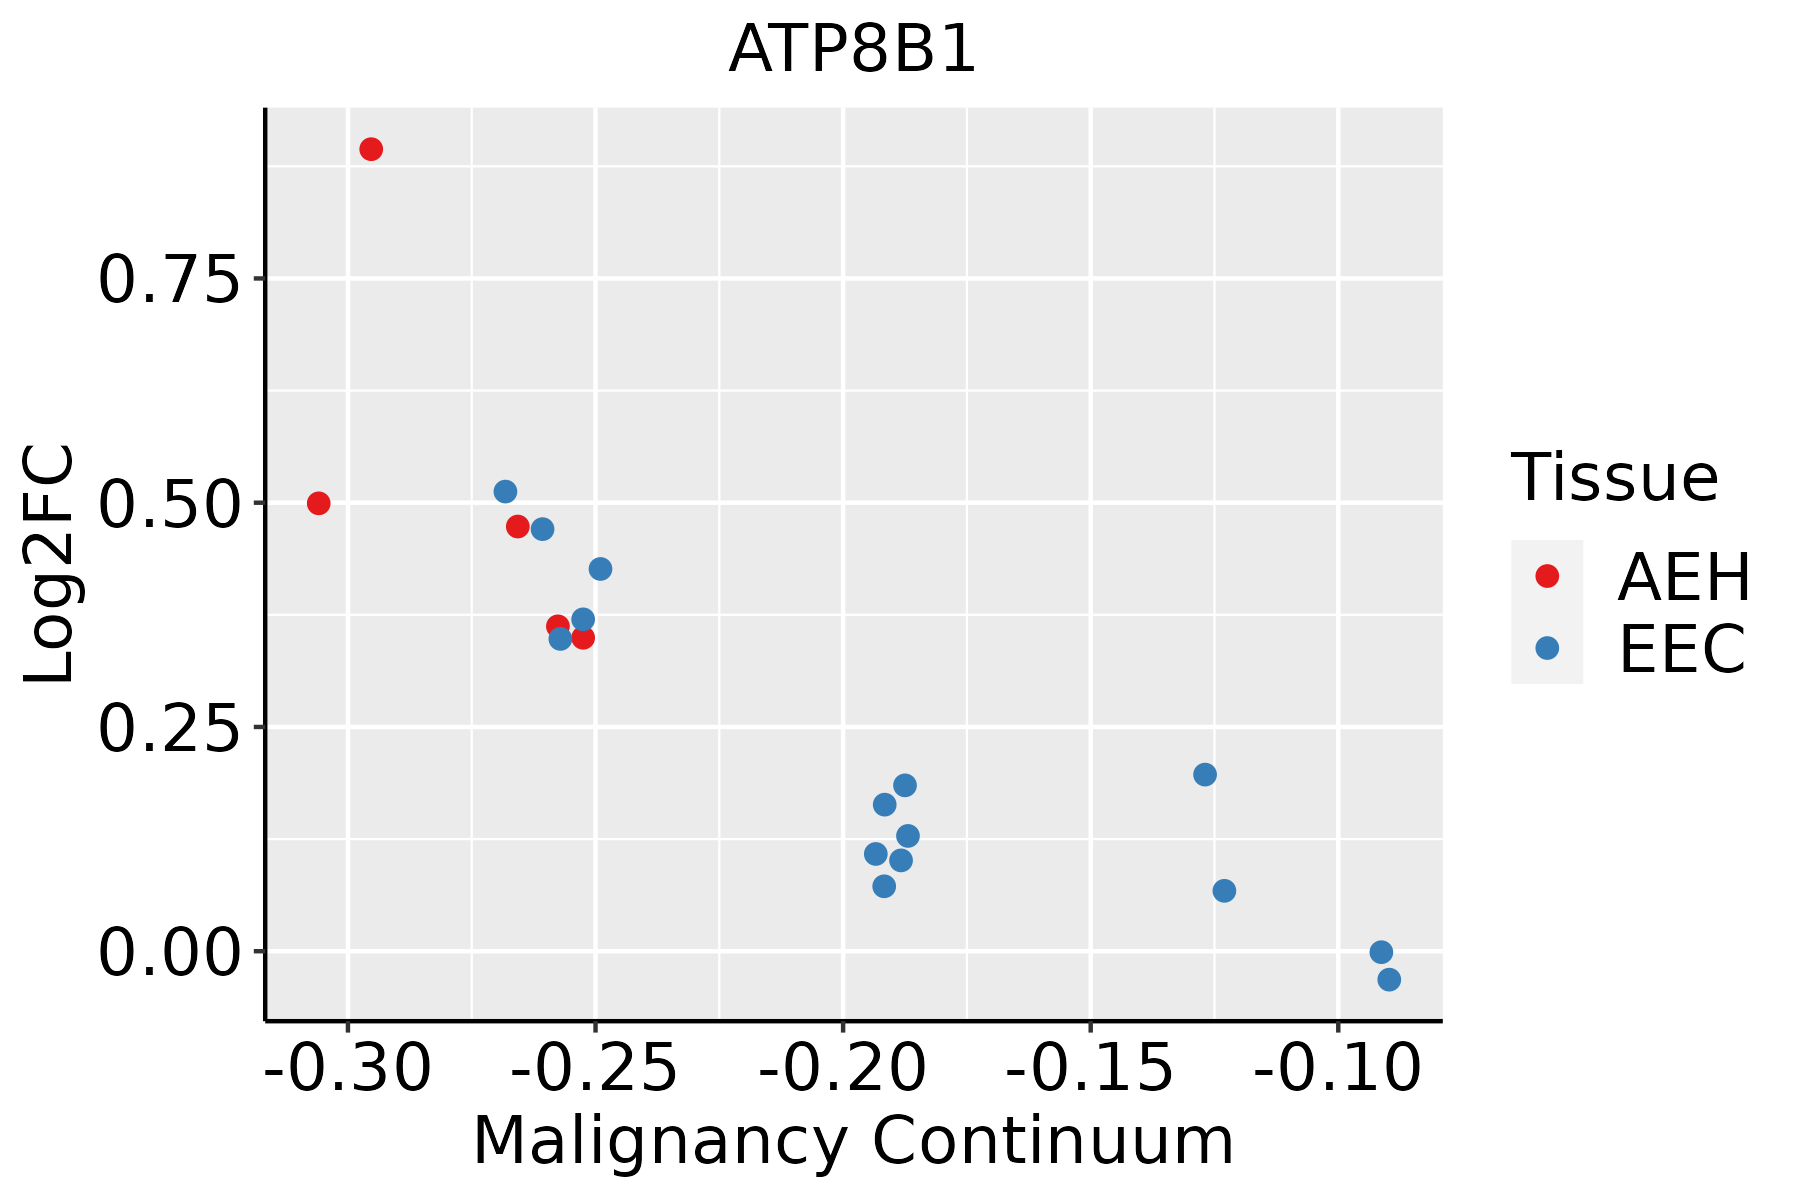 | AEH: Atypical endometrial hyperplasia |
| EEC: Endometrioid Cancer |
| Esophagus | 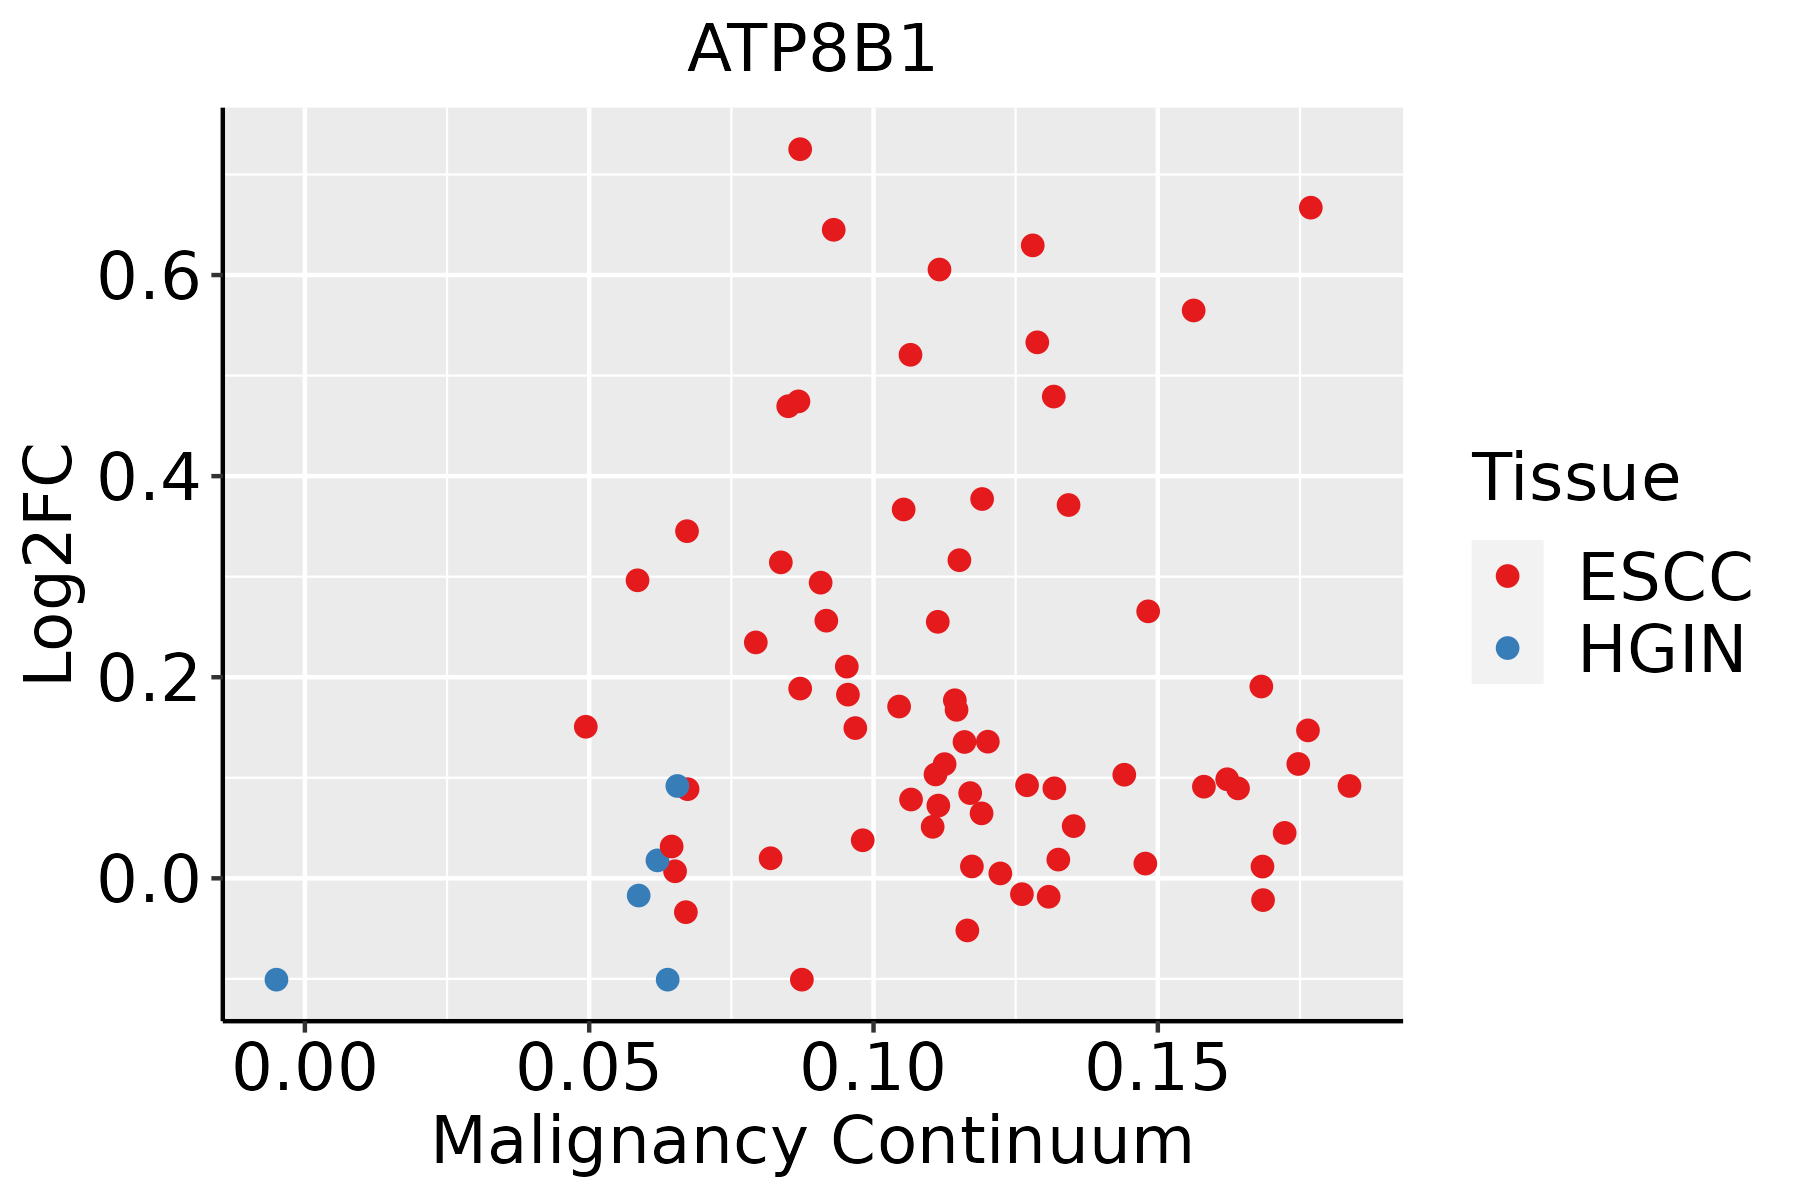 | ESCC: Esophageal squamous cell carcinoma |
| HGIN: High-grade intraepithelial neoplasias |
| LGIN: Low-grade intraepithelial neoplasias |
| GC | 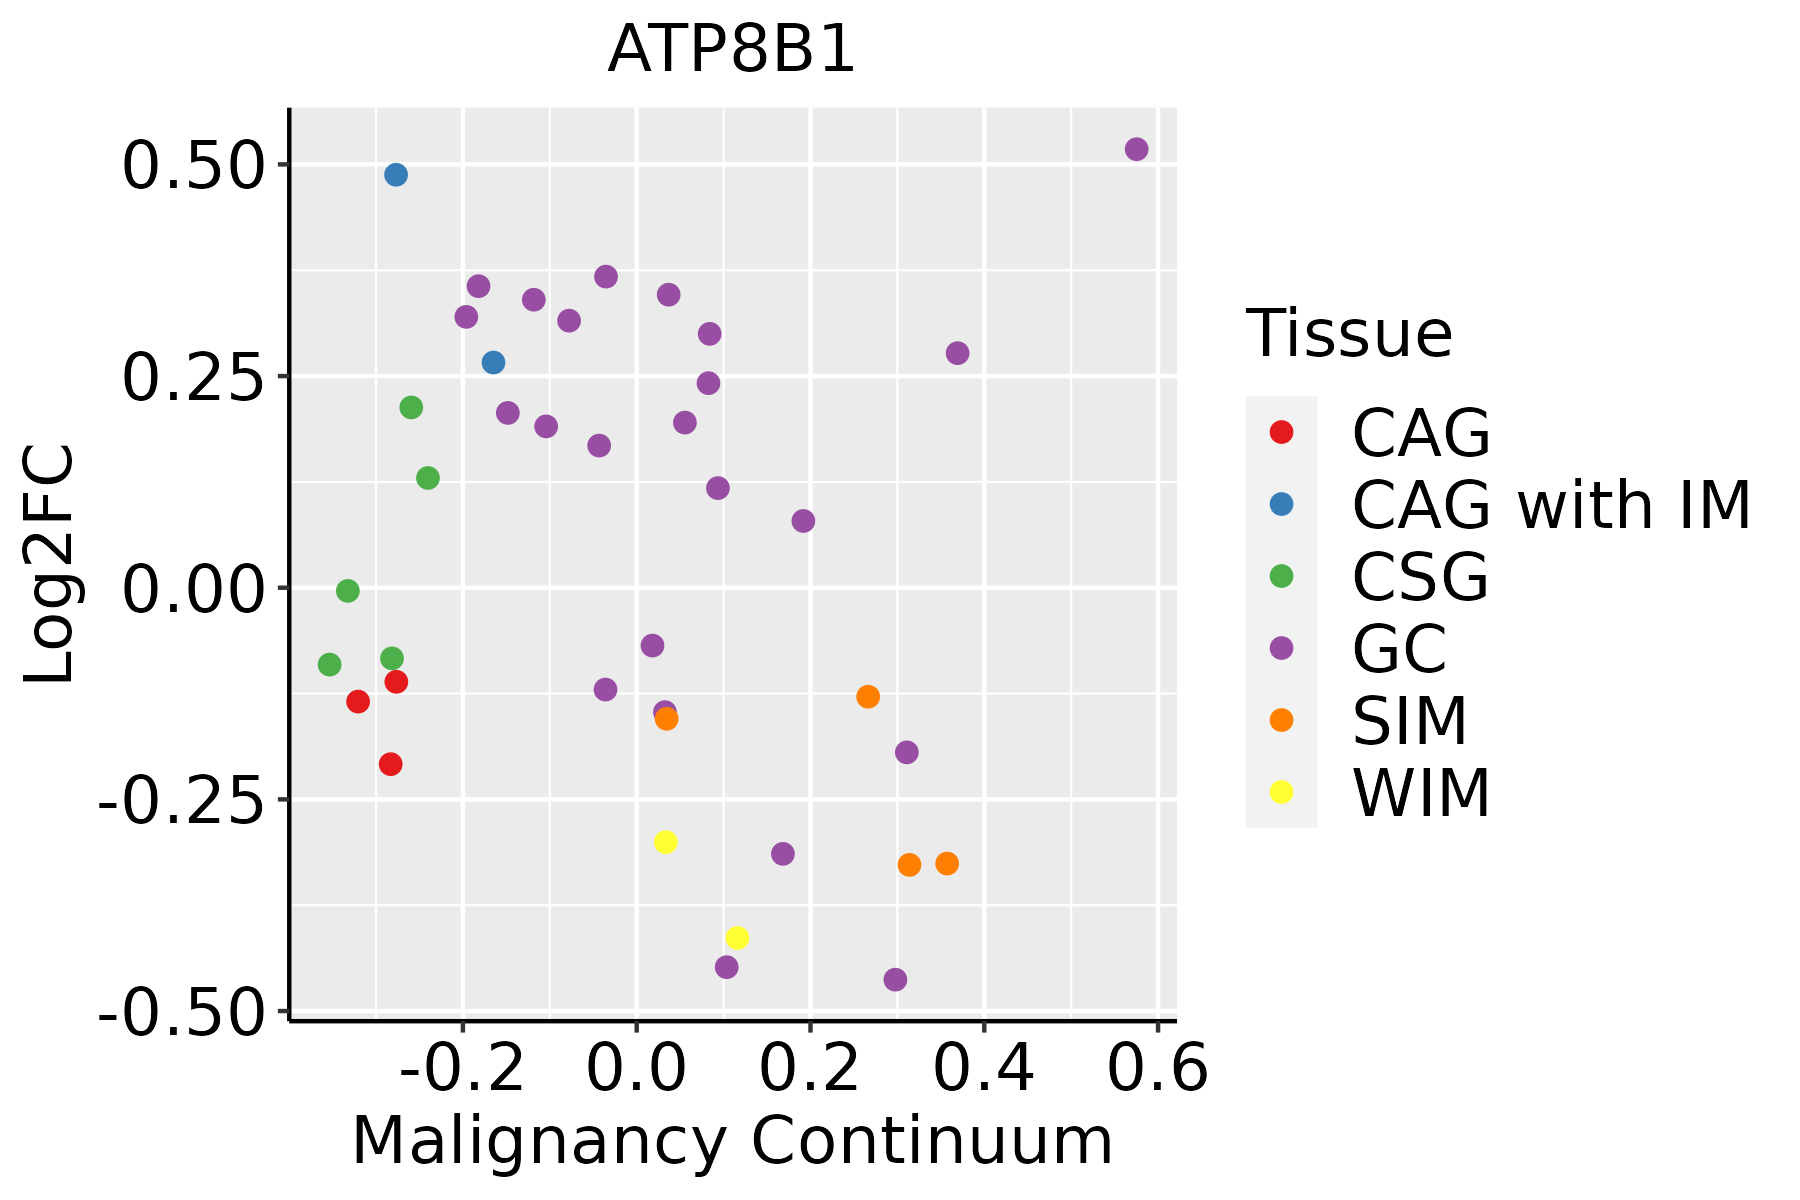 | CAG: Chronic atrophic gastritis |
| CAG with IM: Chronic atrophic gastritis with intestinal metaplasia |
| CSG: Chronic superficial gastritis |
| GC: Gastric cancer |
| SIM: Severe intestinal metaplasia |
| WIM: Wild intestinal metaplasia |
| Liver | 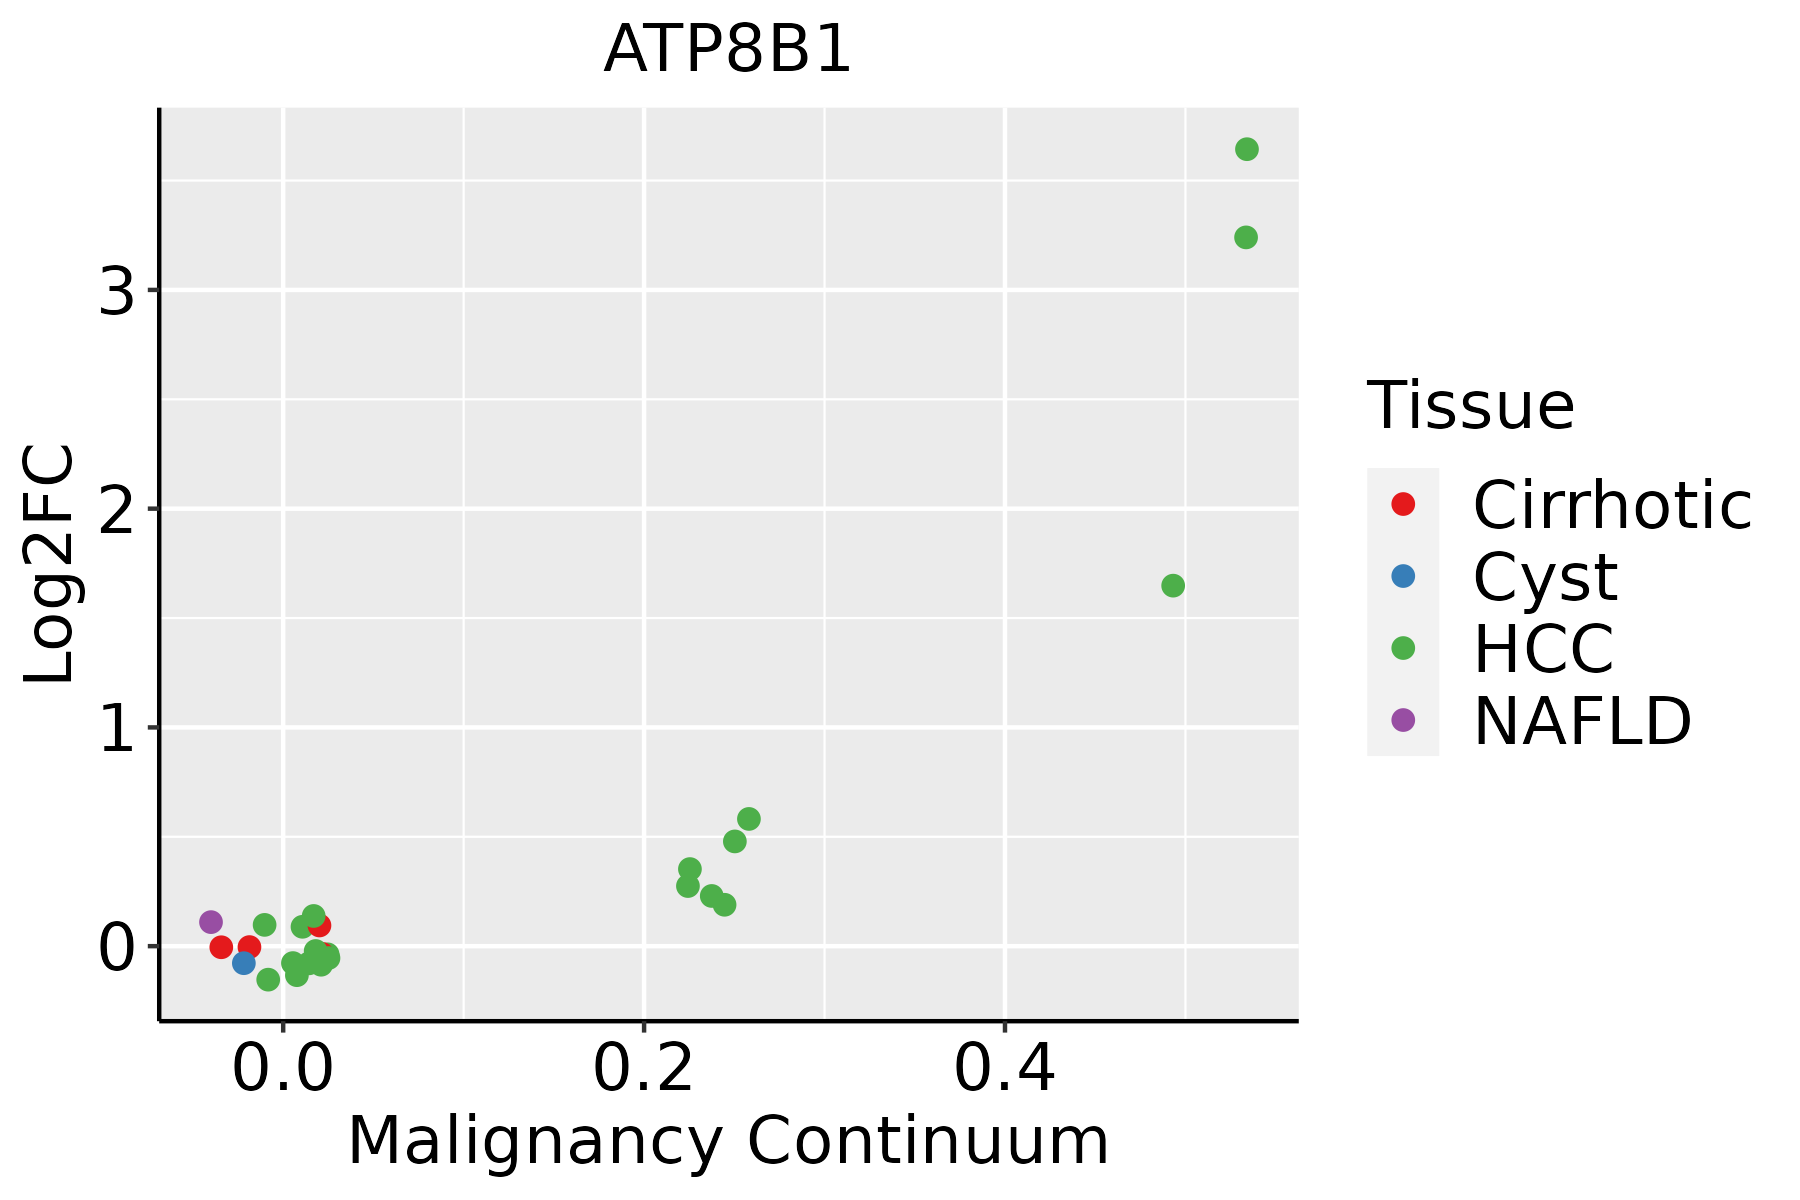 | HCC: Hepatocellular carcinoma |
| NAFLD: Non-alcoholic fatty liver disease |
| Lung | 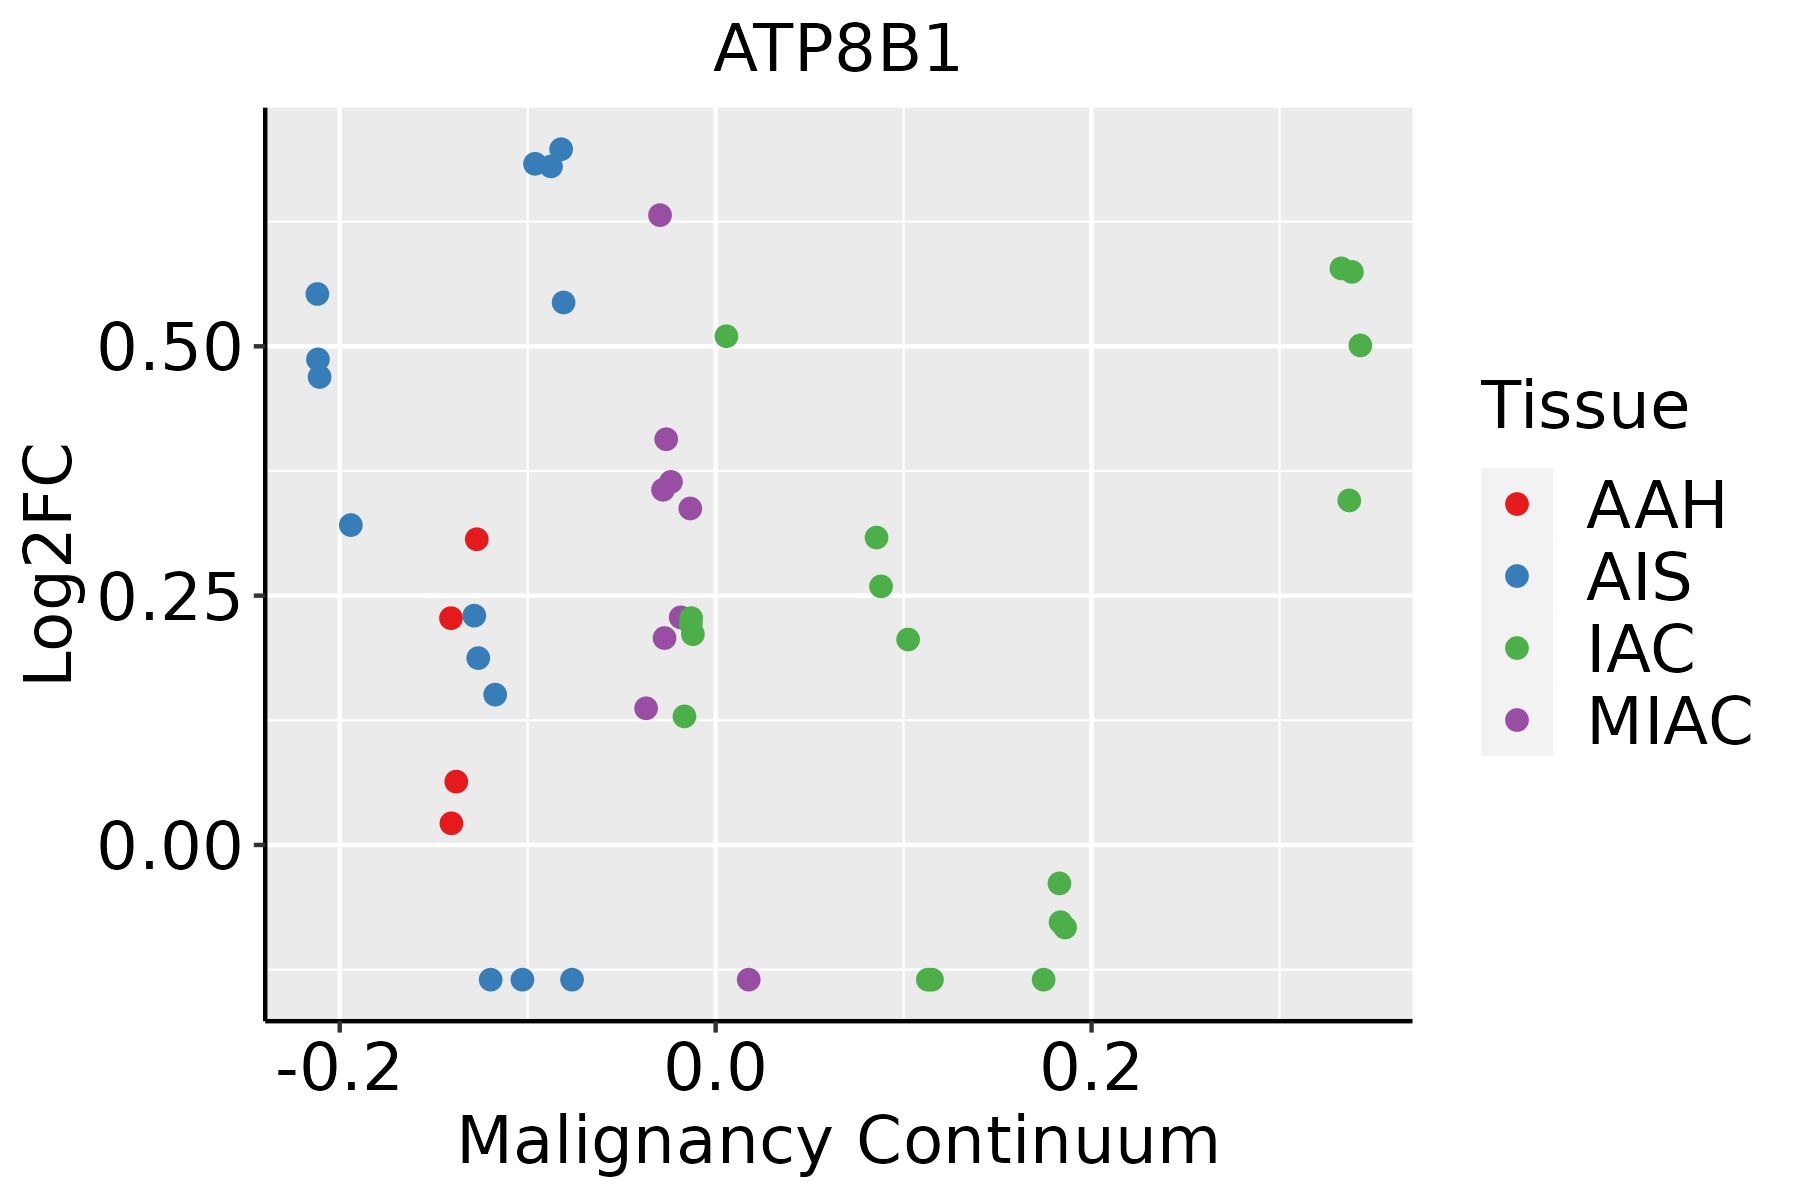 | AAH: Atypical adenomatous hyperplasia |
| AIS: Adenocarcinoma in situ |
| IAC: Invasive lung adenocarcinoma |
| MIA: Minimally invasive adenocarcinoma |
| Oral Cavity | 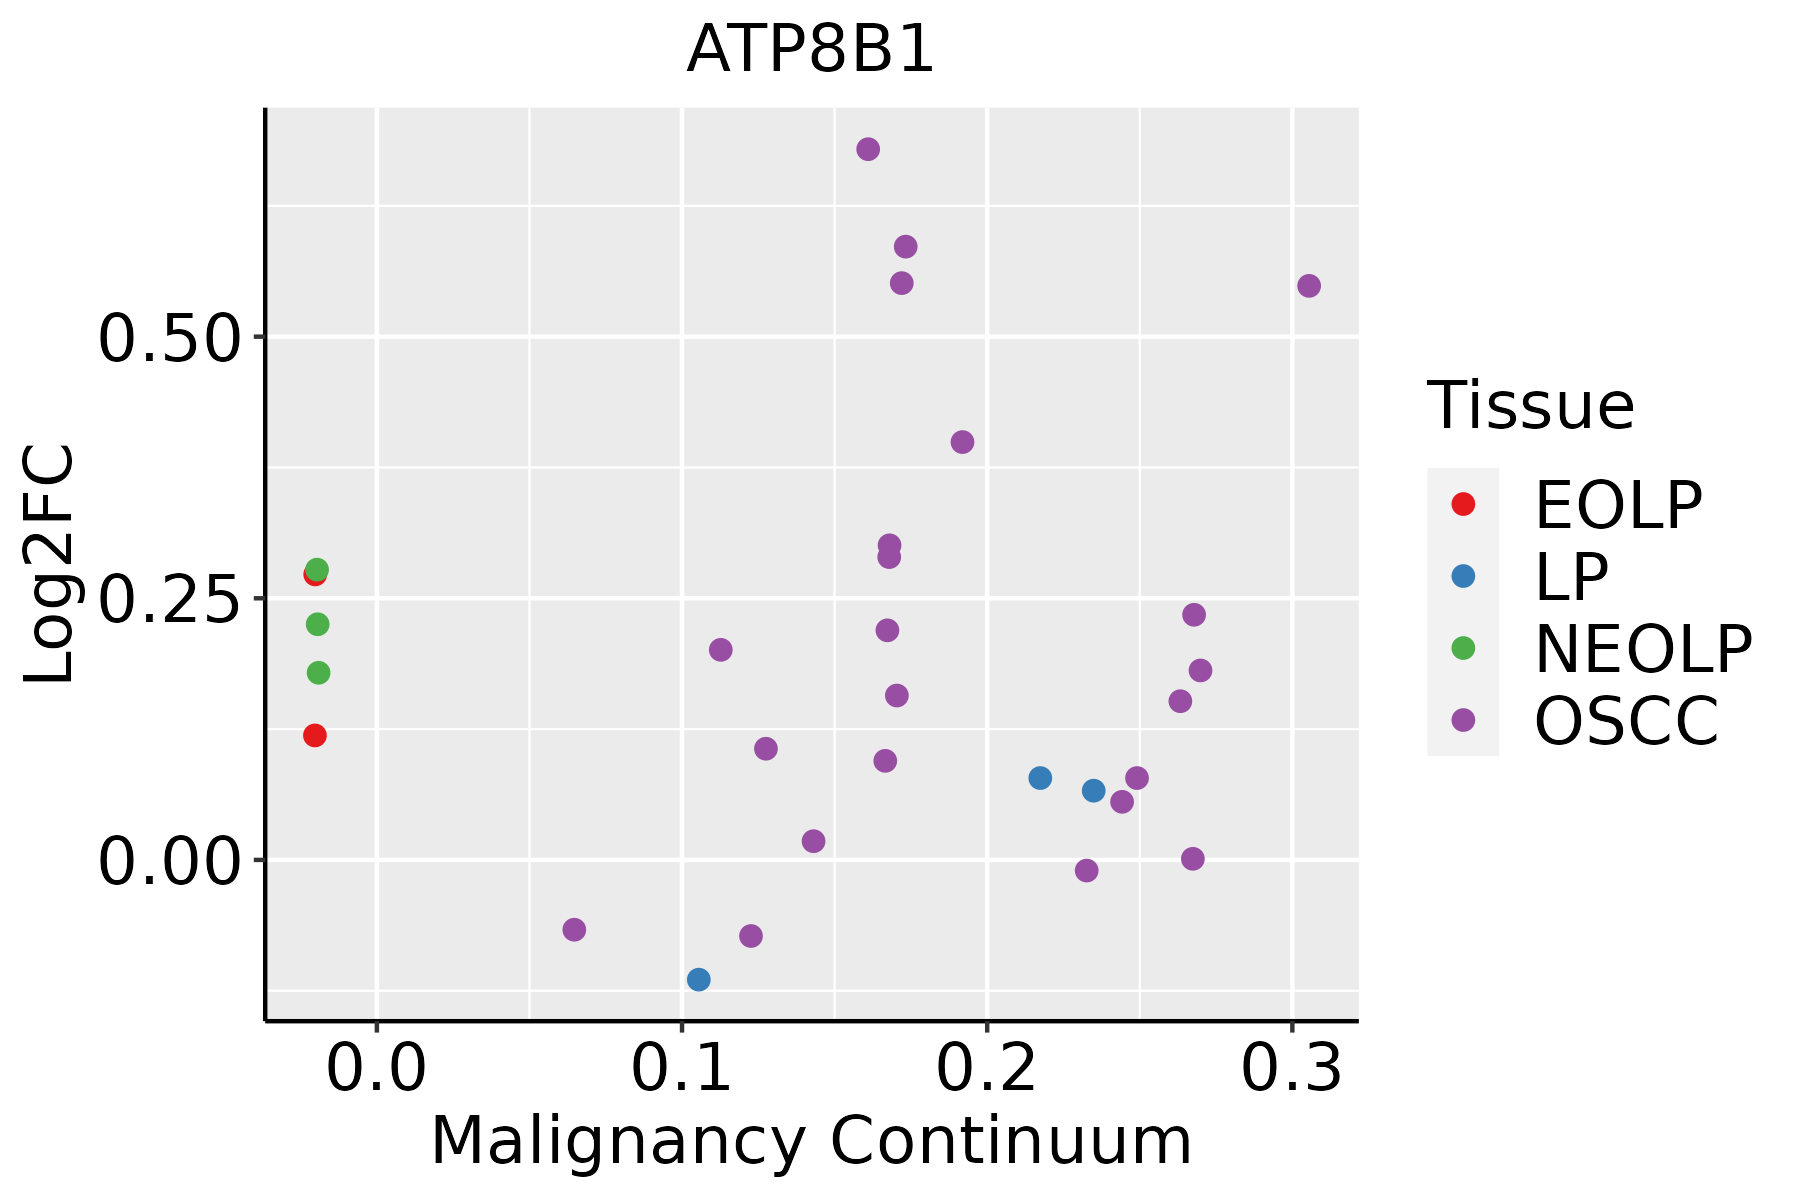 | EOLP: Erosive Oral lichen planus |
| LP: leukoplakia |
| NEOLP: Non-erosive oral lichen planus |
| OSCC: Oral squamous cell carcinoma |
| Prostate | 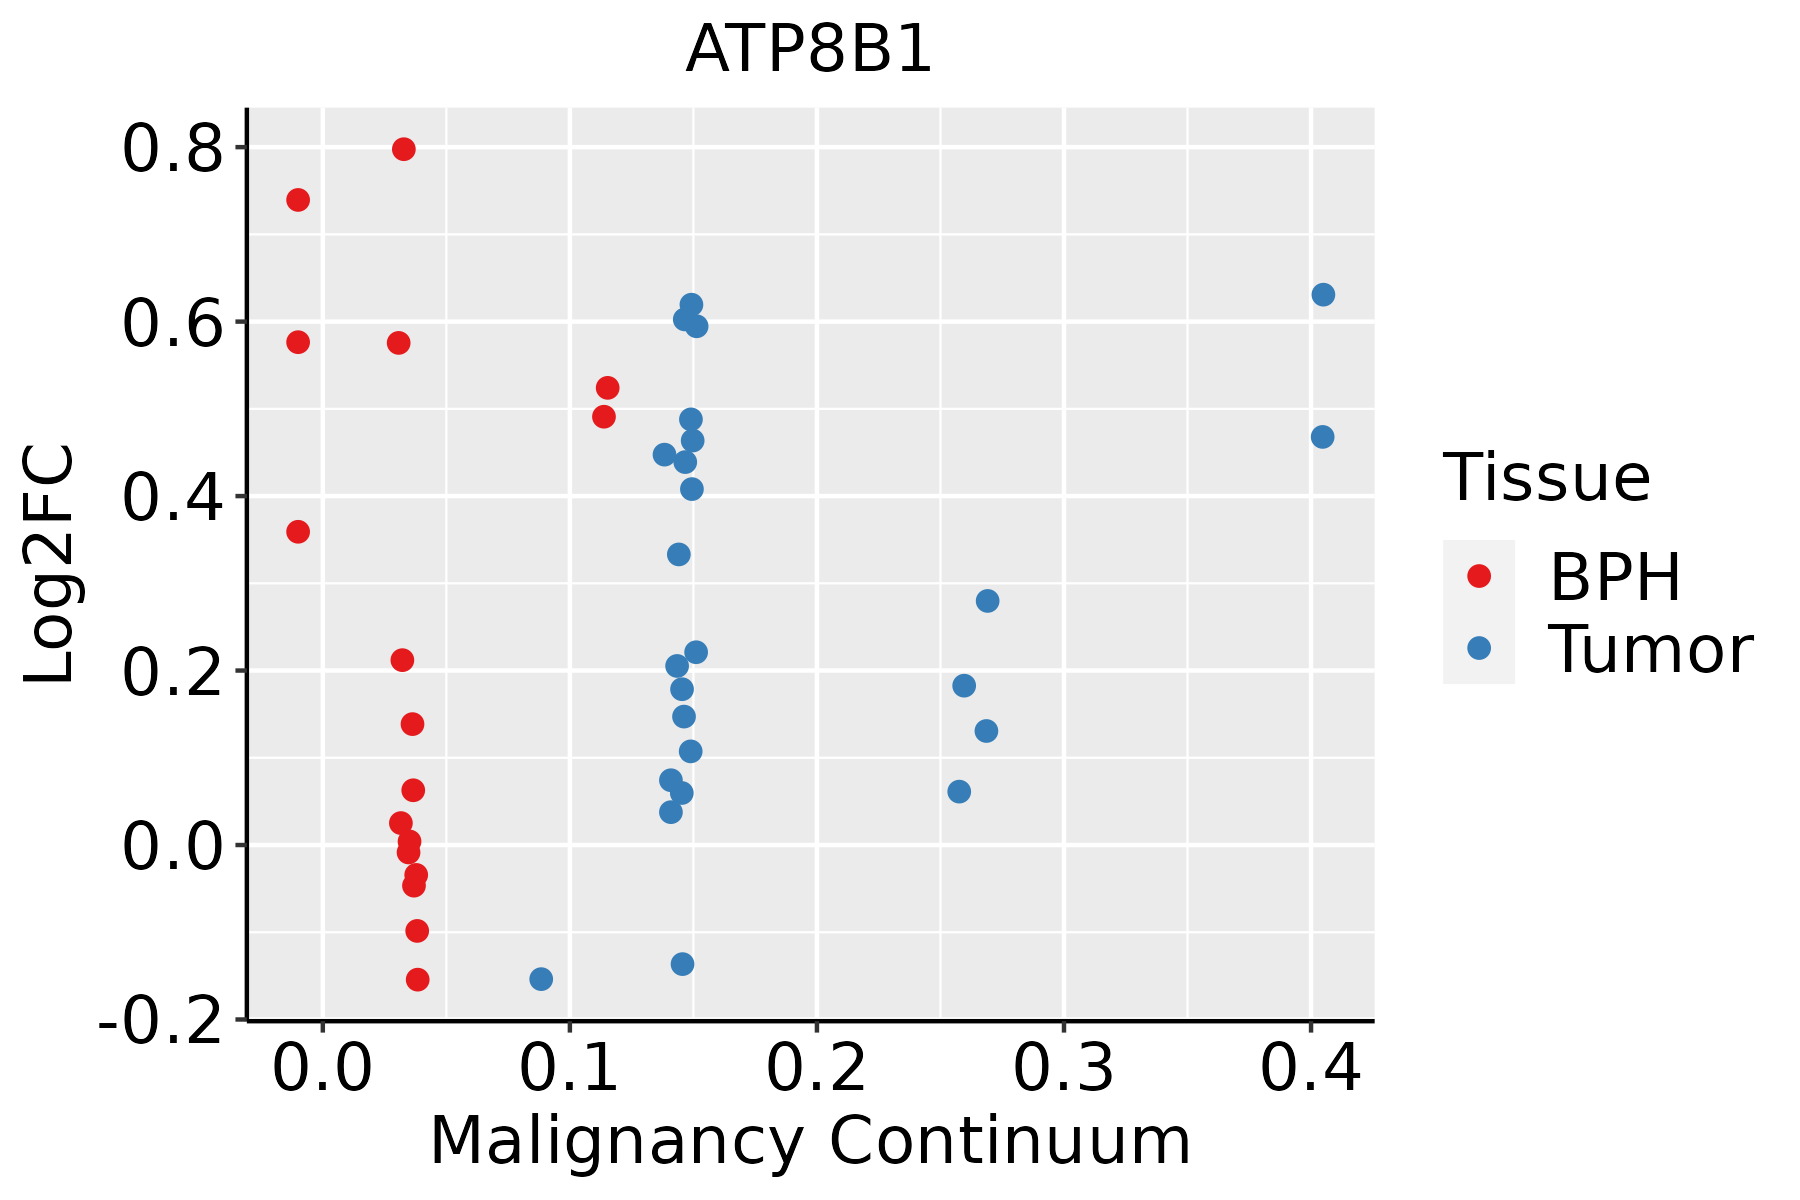 | BPH: Benign Prostatic Hyperplasia |
| GO ID | Tissue | Disease Stage | Description | Gene Ratio | Bg Ratio | pvalue | p.adjust | Count |
| GO:01200328 | Cervix | CC | regulation of plasma membrane bounded cell projection assembly | 38/2311 | 186/18723 | 1.14e-03 | 9.35e-03 | 38 |
| GO:00604917 | Cervix | CC | regulation of cell projection assembly | 38/2311 | 188/18723 | 1.40e-03 | 1.10e-02 | 38 |
| GO:00300337 | Cervix | CC | microvillus assembly | 7/2311 | 16/18723 | 1.79e-03 | 1.34e-02 | 7 |
| GO:00070304 | Cervix | CC | Golgi organization | 32/2311 | 157/18723 | 2.78e-03 | 1.87e-02 | 32 |
| GO:00070092 | Cervix | CC | plasma membrane organization | 28/2311 | 142/18723 | 7.85e-03 | 4.14e-02 | 28 |
| GO:003003313 | Cervix | HSIL_HPV | microvillus assembly | 5/737 | 16/18723 | 2.83e-04 | 4.69e-03 | 5 |
| GO:00325308 | Cervix | HSIL_HPV | regulation of microvillus organization | 4/737 | 13/18723 | 1.28e-03 | 1.48e-02 | 4 |
| GO:00325287 | Cervix | HSIL_HPV | microvillus organization | 5/737 | 24/18723 | 2.12e-03 | 2.17e-02 | 5 |
| GO:0032530 | Colorectum | AD | regulation of microvillus organization | 10/3918 | 13/18723 | 2.43e-05 | 4.69e-04 | 10 |
| GO:0032528 | Colorectum | AD | microvillus organization | 14/3918 | 24/18723 | 6.90e-05 | 1.11e-03 | 14 |
| GO:0010876 | Colorectum | AD | lipid localization | 120/3918 | 448/18723 | 1.59e-03 | 1.33e-02 | 120 |
| GO:0006869 | Colorectum | AD | lipid transport | 108/3918 | 398/18723 | 1.67e-03 | 1.39e-02 | 108 |
| GO:0030033 | Colorectum | AD | microvillus assembly | 9/3918 | 16/18723 | 2.06e-03 | 1.64e-02 | 9 |
| GO:0042490 | Colorectum | AD | mechanoreceptor differentiation | 24/3918 | 67/18723 | 3.48e-03 | 2.52e-02 | 24 |
| GO:0015698 | Colorectum | AD | inorganic anion transport | 52/3918 | 180/18723 | 6.83e-03 | 4.22e-02 | 52 |
| GO:0015748 | Colorectum | AD | organophosphate ester transport | 42/3918 | 140/18723 | 7.04e-03 | 4.31e-02 | 42 |
| GO:0060119 | Colorectum | AD | inner ear receptor cell development | 17/3918 | 45/18723 | 7.10e-03 | 4.33e-02 | 17 |
| GO:0008202 | Colorectum | AD | steroid metabolic process | 85/3918 | 319/18723 | 8.07e-03 | 4.75e-02 | 85 |
| GO:0120032 | Colorectum | AD | regulation of plasma membrane bounded cell projection assembly | 53/3918 | 186/18723 | 8.51e-03 | 4.97e-02 | 53 |
| GO:00325301 | Colorectum | SER | regulation of microvillus organization | 10/2897 | 13/18723 | 1.41e-06 | 6.46e-05 | 10 |
| Hugo Symbol | Variant Class | Variant Classification | dbSNP RS | HGVSc | HGVSp | HGVSp Short | SWISSPROT | BIOTYPE | SIFT | PolyPhen | Tumor Sample Barcode | Tissue | Histology | Sex | Age | Stage | Therapy Types | Drugs | Outcome |
| ATP8B1 | SNV | Missense_Mutation | novel | c.794N>T | p.Cys265Phe | p.C265F | O43520 | protein_coding | deleterious(0) | possibly_damaging(0.822) | TCGA-A2-A25D-01 | Breast | breast invasive carcinoma | Female | >=65 | III/IV | Hormone Therapy | tamoxiphen | SD |
| ATP8B1 | SNV | Missense_Mutation | | c.2584N>T | p.Ala862Ser | p.A862S | O43520 | protein_coding | tolerated(0.12) | benign(0.178) | TCGA-A7-A0CJ-01 | Breast | breast invasive carcinoma | Female | <65 | I/II | Chemotherapy | cytoxan | SD |
| ATP8B1 | SNV | Missense_Mutation | novel | c.88N>A | p.Glu30Lys | p.E30K | O43520 | protein_coding | tolerated_low_confidence(0.17) | benign(0.339) | TCGA-BH-A0B6-01 | Breast | breast invasive carcinoma | Female | <65 | I/II | Unknown | Unknown | SD |
| ATP8B1 | SNV | Missense_Mutation | novel | c.2224A>G | p.Ile742Val | p.I742V | O43520 | protein_coding | tolerated(0.06) | benign(0.298) | TCGA-BH-A1FU-01 | Breast | breast invasive carcinoma | Female | <65 | I/II | Unknown | Unknown | PD |
| ATP8B1 | SNV | Missense_Mutation | novel | c.1663G>A | p.Glu555Lys | p.E555K | O43520 | protein_coding | deleterious(0) | probably_damaging(0.997) | TCGA-D8-A1J8-01 | Breast | breast invasive carcinoma | Female | >=65 | I/II | Hormone Therapy | nolvadex | SD |
| ATP8B1 | insertion | Frame_Shift_Ins | novel | c.225_226insTTCTCCTGCCTCAGCCTCC | p.Gln76PhefsTer19 | p.Q76Ffs*19 | O43520 | protein_coding | | | TCGA-BH-A0HF-01 | Breast | breast invasive carcinoma | Female | >=65 | I/II | Hormone Therapy | arimidex | SD |
| ATP8B1 | insertion | Nonsense_Mutation | novel | c.3405_3406insATCTGAATACAATCAATTTCCATTAGAAAGAAGGAGAGAGTAGAGG | p.Ala1136IlefsTer2 | p.A1136Ifs*2 | O43520 | protein_coding | | | TCGA-BH-A0HO-01 | Breast | breast invasive carcinoma | Female | <65 | I/II | Chemotherapy | cyclophosphamide | SD |
| ATP8B1 | SNV | Missense_Mutation | novel | c.3418N>A | p.Leu1140Met | p.L1140M | O43520 | protein_coding | tolerated(0.21) | probably_damaging(0.998) | TCGA-2W-A8YY-01 | Cervix | cervical & endocervical cancer | Female | <65 | I/II | Chemotherapy | cisplatin | CR |
| ATP8B1 | SNV | Missense_Mutation | novel | c.3190N>C | p.Glu1064Gln | p.E1064Q | O43520 | protein_coding | tolerated(0.25) | probably_damaging(0.969) | TCGA-VS-A9UY-01 | Cervix | cervical & endocervical cancer | Female | <65 | I/II | Chemotherapy | cisplatin | PD |
| ATP8B1 | SNV | Missense_Mutation | | c.46N>G | p.Gln16Glu | p.Q16E | O43520 | protein_coding | tolerated_low_confidence(0.16) | benign(0.001) | TCGA-VS-A9UY-01 | Cervix | cervical & endocervical cancer | Female | <65 | I/II | Chemotherapy | cisplatin | PD |


