
|
|||||
|
 | |
| |
| |
| |
| |
| |
|
Gene: ATP8A1 |
Gene summary for ATP8A1 |
| Gene information | Species | Human | Gene symbol | ATP8A1 | Gene ID | 10396 |
| Gene name | ATPase phospholipid transporting 8A1 | |
| Gene Alias | ATPASEII | |
| Cytomap | 4p13 | |
| Gene Type | protein-coding | GO ID | GO:0003008 | UniProtAcc | Q9Y2Q0 |
Top |
Malignant transformation analysis |
| Identification of the aberrant gene expression in precancerous and cancerous lesions by comparing the gene expression of stem-like cells in diseased tissues with normal stem cells |
| Entrez ID | Symbol | Replicates | Species | Organ | Tissue | Adj P-value | Log2FC | Malignancy |
| 10396 | ATP8A1 | HTA11_3410_2000001011 | Human | Colorectum | AD | 6.89e-11 | -4.55e-01 | 0.0155 |
| 10396 | ATP8A1 | HTA11_866_3004761011 | Human | Colorectum | AD | 6.41e-14 | -6.48e-01 | 0.096 |
| 10396 | ATP8A1 | HTA11_8622_2000001021 | Human | Colorectum | SER | 8.36e-04 | -7.26e-01 | 0.0528 |
| 10396 | ATP8A1 | HTA11_10711_2000001011 | Human | Colorectum | AD | 1.33e-02 | -4.07e-01 | 0.0338 |
| 10396 | ATP8A1 | HTA11_7696_3000711011 | Human | Colorectum | AD | 1.20e-03 | -3.51e-01 | 0.0674 |
| 10396 | ATP8A1 | HTA11_99999971662_82457 | Human | Colorectum | MSS | 2.72e-16 | -5.93e-01 | 0.3859 |
| 10396 | ATP8A1 | HTA11_99999973899_84307 | Human | Colorectum | MSS | 7.51e-04 | -5.79e-01 | 0.2585 |
| 10396 | ATP8A1 | HTA11_99999974143_84620 | Human | Colorectum | MSS | 2.37e-41 | -8.39e-01 | 0.3005 |
| 10396 | ATP8A1 | A015-C-203 | Human | Colorectum | FAP | 1.17e-28 | -4.96e-01 | -0.1294 |
| 10396 | ATP8A1 | A015-C-204 | Human | Colorectum | FAP | 8.07e-06 | -3.85e-01 | -0.0228 |
| 10396 | ATP8A1 | A014-C-040 | Human | Colorectum | FAP | 1.91e-08 | -7.16e-01 | -0.1184 |
| 10396 | ATP8A1 | A002-C-201 | Human | Colorectum | FAP | 6.75e-15 | -4.71e-01 | 0.0324 |
| 10396 | ATP8A1 | A001-C-119 | Human | Colorectum | FAP | 1.66e-21 | -8.05e-01 | -0.1557 |
| 10396 | ATP8A1 | A001-C-108 | Human | Colorectum | FAP | 1.98e-14 | -3.39e-01 | -0.0272 |
| 10396 | ATP8A1 | A002-C-205 | Human | Colorectum | FAP | 2.30e-33 | -7.24e-01 | -0.1236 |
| 10396 | ATP8A1 | A015-C-005 | Human | Colorectum | FAP | 9.25e-07 | -4.25e-01 | -0.0336 |
| 10396 | ATP8A1 | A015-C-006 | Human | Colorectum | FAP | 2.89e-24 | -7.66e-01 | -0.0994 |
| 10396 | ATP8A1 | A015-C-106 | Human | Colorectum | FAP | 8.09e-10 | -2.49e-01 | -0.0511 |
| 10396 | ATP8A1 | A002-C-114 | Human | Colorectum | FAP | 7.52e-23 | -5.87e-01 | -0.1561 |
| 10396 | ATP8A1 | A015-C-104 | Human | Colorectum | FAP | 7.14e-34 | -6.10e-01 | -0.1899 |
| Page: 1 2 3 4 |
| Tissue | Expression Dynamics | Abbreviation |
| Colorectum (GSE201348) |  | FAP: Familial adenomatous polyposis |
| CRC: Colorectal cancer | ||
| Colorectum (HTA11) |  | AD: Adenomas |
| SER: Sessile serrated lesions | ||
| MSI-H: Microsatellite-high colorectal cancer | ||
| MSS: Microsatellite stable colorectal cancer | ||
| Lung | 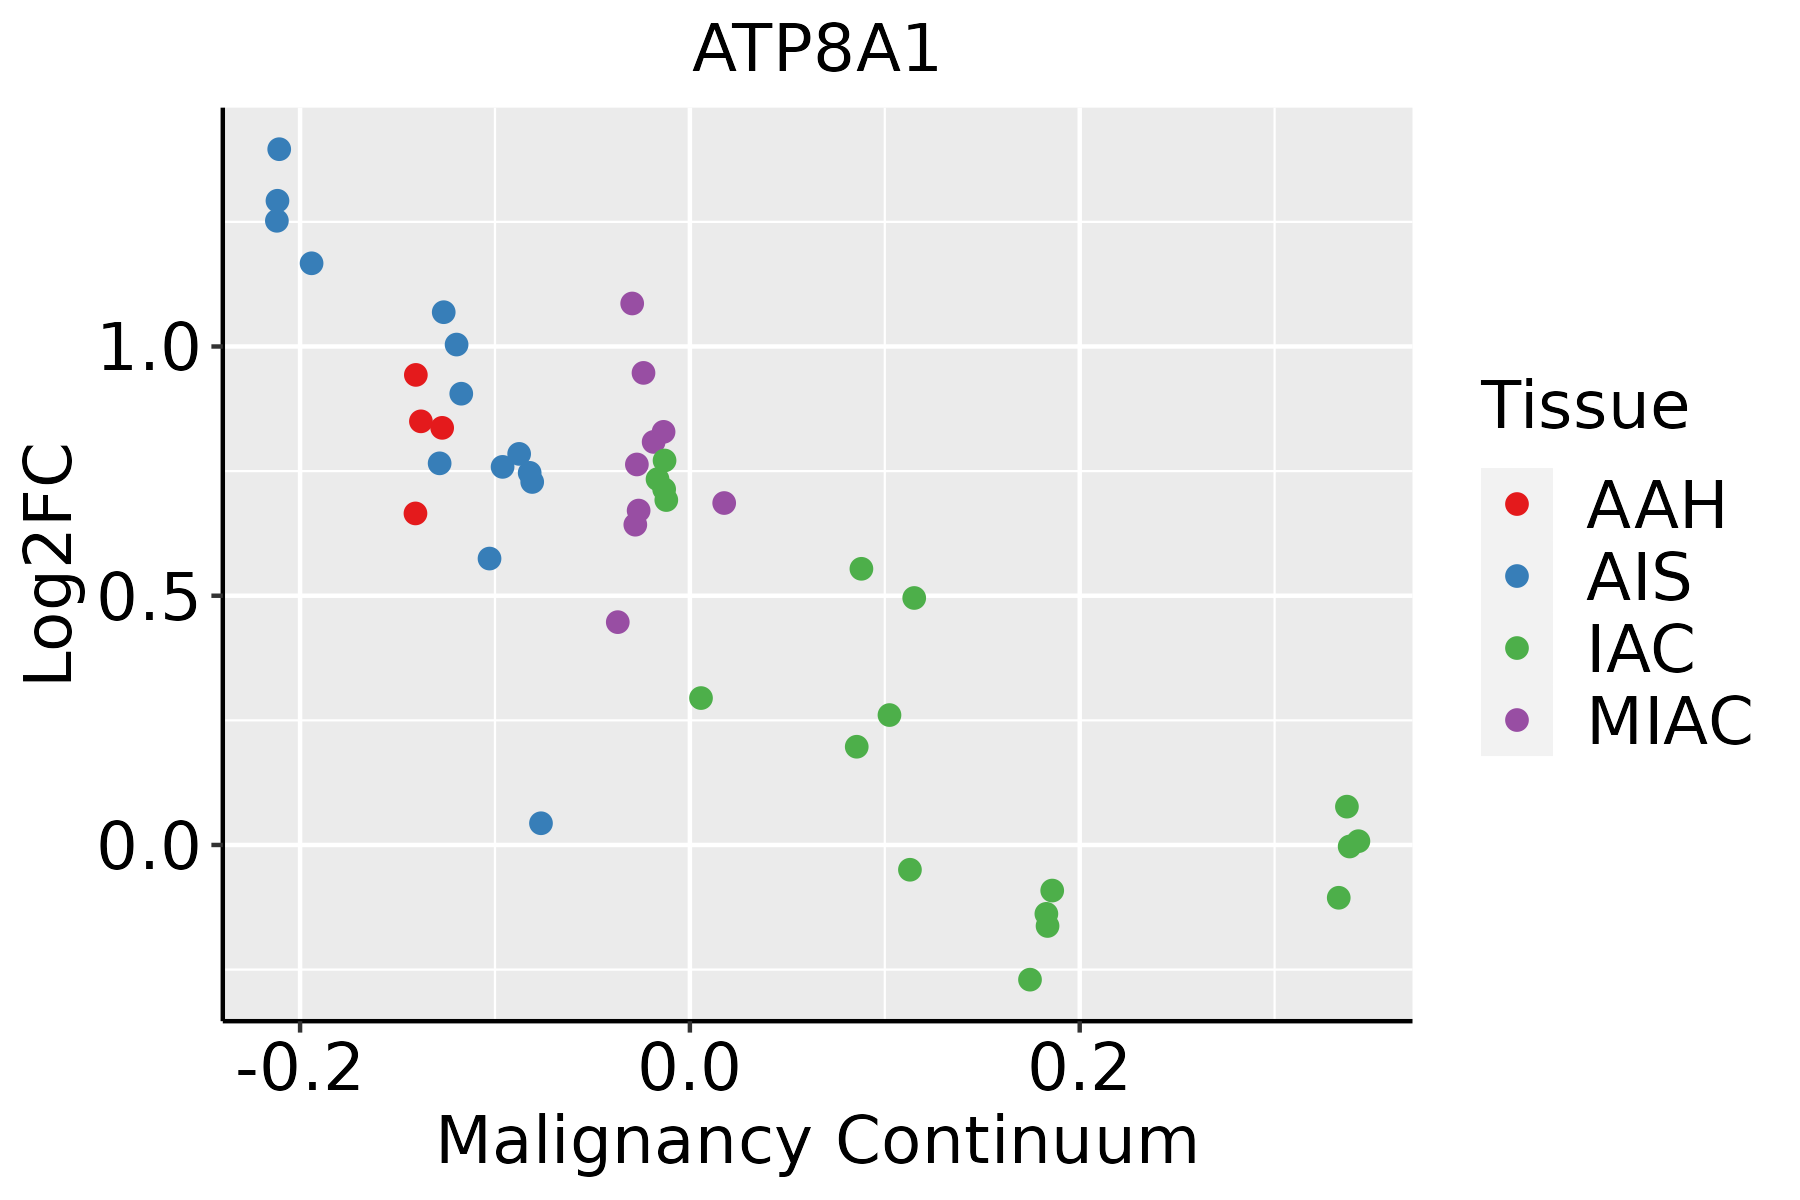 | AAH: Atypical adenomatous hyperplasia |
| AIS: Adenocarcinoma in situ | ||
| IAC: Invasive lung adenocarcinoma | ||
| MIA: Minimally invasive adenocarcinoma | ||
| Thyroid | 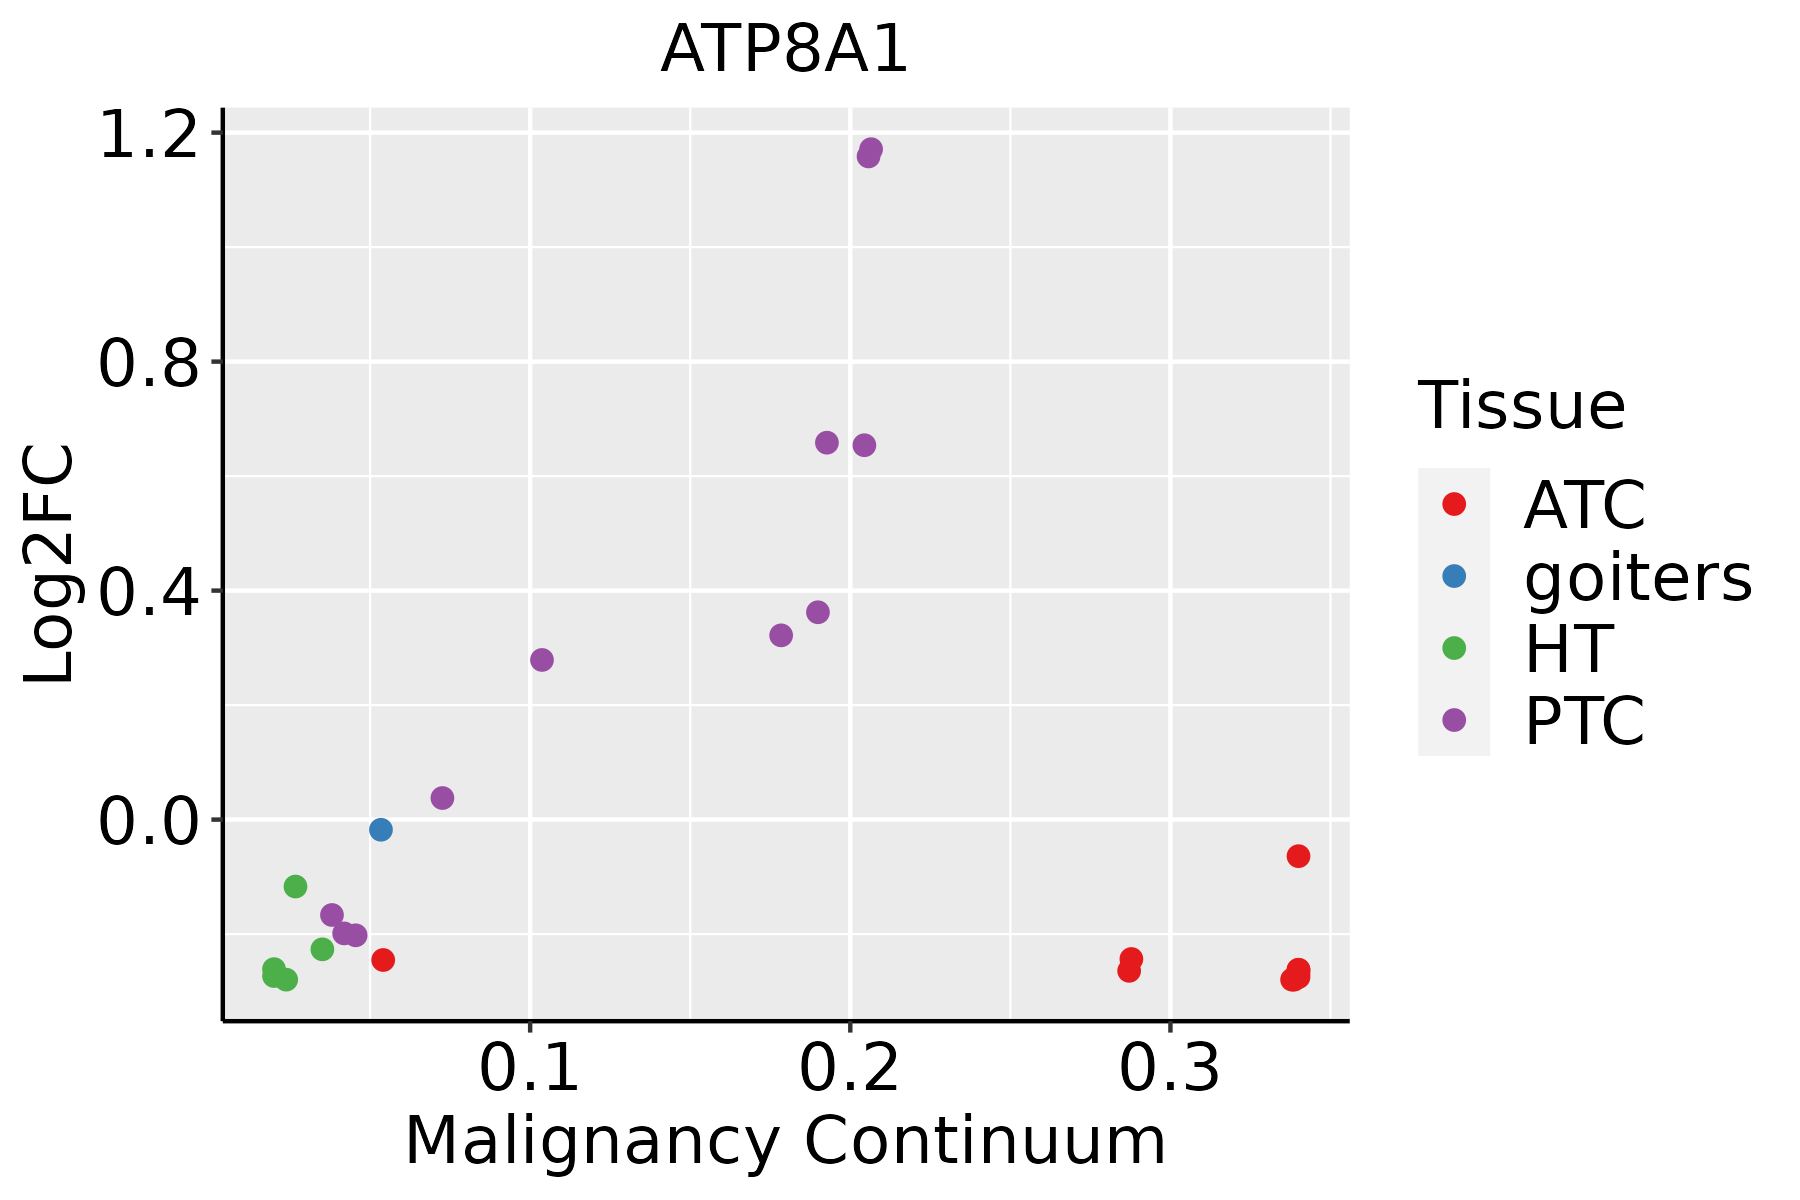 | ATC: Anaplastic thyroid cancer |
| HT: Hashimoto's thyroiditis | ||
| PTC: Papillary thyroid cancer |
| ∗log2FC in expression of this searched gene in stem-like cells from each diseased tissue sample relative to stem-like cells in normal samples in each tissue plotted against the malignancy continuum. Samples are colored based on if they are from different disease stage. |
Top |
Malignant transformation related pathway analysis |
| Find out the enriched GO biological processes and KEGG pathways involved in transition from healthy to precancer to cancer |
| Tissue | Disease Stage | Enriched GO biological Processes |
| Colorectum | AD |  |
| Colorectum | SER |  |
| Colorectum | MSS |  |
| Colorectum | MSI-H |  |
| Colorectum | FAP |  |
| ∗Top 15 enriched GO BP terms are showed in the bar plot of each disease state in each tissue. Each row represents a significant GO biological process which is colored according to the -log10(p.adjust). |
| Page: 1 2 3 4 5 6 7 8 9 |
| GO ID | Tissue | Disease Stage | Description | Gene Ratio | Bg Ratio | pvalue | p.adjust | Count |
| GO:0010876 | Colorectum | AD | lipid localization | 120/3918 | 448/18723 | 1.59e-03 | 1.33e-02 | 120 |
| GO:0006869 | Colorectum | AD | lipid transport | 108/3918 | 398/18723 | 1.67e-03 | 1.39e-02 | 108 |
| GO:0015748 | Colorectum | AD | organophosphate ester transport | 42/3918 | 140/18723 | 7.04e-03 | 4.31e-02 | 42 |
| GO:0150104 | Colorectum | MSS | transport across blood-brain barrier | 28/3467 | 87/18723 | 1.54e-03 | 1.41e-02 | 28 |
| GO:0010232 | Colorectum | MSS | vascular transport | 28/3467 | 88/18723 | 1.87e-03 | 1.64e-02 | 28 |
| GO:00108761 | Colorectum | MSS | lipid localization | 104/3467 | 448/18723 | 6.76e-03 | 4.38e-02 | 104 |
| GO:01501041 | Colorectum | FAP | transport across blood-brain barrier | 25/2622 | 87/18723 | 2.63e-04 | 3.59e-03 | 25 |
| GO:00068691 | Colorectum | FAP | lipid transport | 81/2622 | 398/18723 | 2.84e-04 | 3.76e-03 | 81 |
| GO:00102321 | Colorectum | FAP | vascular transport | 25/2622 | 88/18723 | 3.19e-04 | 4.12e-03 | 25 |
| GO:0003018 | Colorectum | FAP | vascular process in circulatory system | 56/2622 | 263/18723 | 7.67e-04 | 8.12e-03 | 56 |
| GO:00108762 | Colorectum | FAP | lipid localization | 85/2622 | 448/18723 | 1.92e-03 | 1.63e-02 | 85 |
| GO:0015914 | Colorectum | FAP | phospholipid transport | 23/2622 | 96/18723 | 6.09e-03 | 3.82e-02 | 23 |
| GO:00030181 | Colorectum | CRC | vascular process in circulatory system | 45/2078 | 263/18723 | 2.10e-03 | 2.08e-02 | 45 |
| GO:00068692 | Colorectum | CRC | lipid transport | 63/2078 | 398/18723 | 2.36e-03 | 2.26e-02 | 63 |
| GO:00108763 | Colorectum | CRC | lipid localization | 68/2078 | 448/18723 | 4.60e-03 | 3.58e-02 | 68 |
| GO:01501042 | Colorectum | CRC | transport across blood-brain barrier | 18/2078 | 87/18723 | 6.50e-03 | 4.69e-02 | 18 |
| GO:00159142 | Lung | IAC | phospholipid transport | 20/2061 | 96/18723 | 3.58e-03 | 3.00e-02 | 20 |
| GO:00157482 | Lung | IAC | organophosphate ester transport | 26/2061 | 140/18723 | 5.22e-03 | 3.97e-02 | 26 |
| GO:001591411 | Lung | AIS | phospholipid transport | 18/1849 | 96/18723 | 5.64e-03 | 4.76e-02 | 18 |
| Page: 1 |
| Pathway ID | Tissue | Disease Stage | Description | Gene Ratio | Bg Ratio | pvalue | p.adjust | qvalue | Count |
| Page: 1 |
Top |
Cell-cell communication analysis |
| Identification of potential cell-cell interactions between two cell types and their ligand-receptor pairs for different disease states |
| Ligand | Receptor | LRpair | Pathway | Tissue | Disease Stage |
| Page: 1 |
Top |
Single-cell gene regulatory network inference analysis |
| Find out the significant the regulons (TFs) and the target genes of each regulon across cell types for different disease states |
| TF | Cell Type | Tissue | Disease Stage | Target Gene | RSS | Regulon Activity |
| ∗The dot plots of a searched regulon are shown for all cell subpopulations in each disease state of each tissue based on the regulon specific score inferred using pySCENIC and by calculating the average expression. |
| Page: 1 |
Top |
Somatic mutation of malignant transformation related genes |
| Annotation of somatic variants for genes involved in malignant transformation |
| Hugo Symbol | Variant Class | Variant Classification | dbSNP RS | HGVSc | HGVSp | HGVSp Short | SWISSPROT | BIOTYPE | SIFT | PolyPhen | Tumor Sample Barcode | Tissue | Histology | Sex | Age | Stage | Therapy Types | Drugs | Outcome |
| ATP8A1 | SNV | Missense_Mutation | c.3345G>T | p.Lys1115Asn | p.K1115N | Q9Y2Q0 | protein_coding | tolerated(0.06) | benign(0.003) | TCGA-A8-A07P-01 | Breast | breast invasive carcinoma | Female | >=65 | I/II | Chemotherapy | 5-fluorouracil | SD | |
| ATP8A1 | SNV | Missense_Mutation | novel | c.653G>T | p.Arg218Ile | p.R218I | Q9Y2Q0 | protein_coding | tolerated(0.1) | benign(0.014) | TCGA-AN-A046-01 | Breast | breast invasive carcinoma | Female | >=65 | I/II | Unknown | Unknown | SD |
| ATP8A1 | SNV | Missense_Mutation | novel | c.302N>T | p.Thr101Ile | p.T101I | Q9Y2Q0 | protein_coding | deleterious(0) | probably_damaging(1) | TCGA-LL-A5YN-01 | Breast | breast invasive carcinoma | Female | <65 | I/II | Chemotherapy | carboplatin | SD |
| ATP8A1 | insertion | Nonsense_Mutation | novel | c.2003_2004insACAAACATTCAGACCATAGCAGGCCTCACCCTTATGGTCTCAT | p.Glu669GlnfsTer6 | p.E669Qfs*6 | Q9Y2Q0 | protein_coding | TCGA-A7-A0CE-01 | Breast | breast invasive carcinoma | Female | <65 | I/II | Chemotherapy | adriamycin | SD | ||
| ATP8A1 | SNV | Missense_Mutation | c.2695N>T | p.Met899Leu | p.M899L | Q9Y2Q0 | protein_coding | tolerated(0.44) | benign(0) | TCGA-C5-A1BQ-01 | Cervix | cervical & endocervical cancer | Female | >=65 | III/IV | Chemotherapy | cisplatin | CR | |
| ATP8A1 | SNV | Missense_Mutation | c.2401G>C | p.Asp801His | p.D801H | Q9Y2Q0 | protein_coding | deleterious(0) | probably_damaging(0.999) | TCGA-DR-A0ZM-01 | Cervix | cervical & endocervical cancer | Female | <65 | III/IV | Unspecific | Cisplatin | SD | |
| ATP8A1 | SNV | Missense_Mutation | novel | c.2707N>G | p.Met903Val | p.M903V | Q9Y2Q0 | protein_coding | deleterious(0.03) | benign(0.003) | TCGA-A6-2672-01 | Colorectum | colon adenocarcinoma | Female | >=65 | III/IV | Unknown | Unknown | SD |
| ATP8A1 | SNV | Missense_Mutation | rs375992978 | c.2383N>A | p.Val795Ile | p.V795I | Q9Y2Q0 | protein_coding | tolerated(1) | benign(0.015) | TCGA-A6-6654-01 | Colorectum | colon adenocarcinoma | Female | >=65 | III/IV | Chemotherapy | oxaliplatin | SD |
| ATP8A1 | SNV | Missense_Mutation | c.1631T>C | p.Leu544Pro | p.L544P | Q9Y2Q0 | protein_coding | deleterious(0) | probably_damaging(1) | TCGA-A6-6781-01 | Colorectum | colon adenocarcinoma | Male | <65 | III/IV | Chemotherapy | oxaliplatin | SD | |
| ATP8A1 | SNV | Missense_Mutation | rs372884316 | c.368N>A | p.Arg123Gln | p.R123Q | Q9Y2Q0 | protein_coding | deleterious(0) | probably_damaging(1) | TCGA-AA-A00N-01 | Colorectum | colon adenocarcinoma | Male | >=65 | I/II | Unknown | Unknown | PD |
| Page: 1 2 3 4 5 6 7 8 9 10 11 12 13 |
Top |
Related drugs of malignant transformation related genes |
| Identification of chemicals and drugs interact with genes involved in malignant transfromation |
| (DGIdb 4.0) |
| Entrez ID | Symbol | Category | Interaction Types | Drug Claim Name | Drug Name | PMIDs |
| Page: 1 |

Copyright 2023-Present -The University of Texas Health Science Center at Houston |