
|
|||||
|
 | |
| |
| |
| |
| |
| |
|
Gene: ATP6V1F |
Gene summary for ATP6V1F |
| Gene information | Species | Human | Gene symbol | ATP6V1F | Gene ID | 9296 |
| Gene name | ATPase H+ transporting V1 subunit F | |
| Gene Alias | ATP6S14 | |
| Cytomap | 7q32.1 | |
| Gene Type | protein-coding | GO ID | GO:0006810 | UniProtAcc | Q16864 |
Top |
Malignant transformation analysis |
| Identification of the aberrant gene expression in precancerous and cancerous lesions by comparing the gene expression of stem-like cells in diseased tissues with normal stem cells |
| Entrez ID | Symbol | Replicates | Species | Organ | Tissue | Adj P-value | Log2FC | Malignancy |
| 9296 | ATP6V1F | GSM4909286 | Human | Breast | IDC | 1.09e-11 | 3.62e-01 | 0.1081 |
| 9296 | ATP6V1F | GSM4909288 | Human | Breast | IDC | 1.64e-04 | -1.57e-01 | 0.0988 |
| 9296 | ATP6V1F | GSM4909291 | Human | Breast | IDC | 6.66e-15 | 5.32e-01 | 0.1753 |
| 9296 | ATP6V1F | GSM4909293 | Human | Breast | IDC | 9.44e-04 | 2.61e-01 | 0.1581 |
| 9296 | ATP6V1F | GSM4909294 | Human | Breast | IDC | 1.28e-07 | 2.21e-01 | 0.2022 |
| 9296 | ATP6V1F | GSM4909296 | Human | Breast | IDC | 1.39e-24 | 3.93e-01 | 0.1524 |
| 9296 | ATP6V1F | GSM4909297 | Human | Breast | IDC | 1.15e-14 | -1.89e-01 | 0.1517 |
| 9296 | ATP6V1F | GSM4909301 | Human | Breast | IDC | 4.89e-18 | 4.05e-01 | 0.1577 |
| 9296 | ATP6V1F | GSM4909302 | Human | Breast | IDC | 1.17e-03 | 2.51e-01 | 0.1545 |
| 9296 | ATP6V1F | GSM4909304 | Human | Breast | IDC | 3.42e-11 | 4.01e-01 | 0.1636 |
| 9296 | ATP6V1F | GSM4909306 | Human | Breast | IDC | 4.52e-08 | 3.18e-01 | 0.1564 |
| 9296 | ATP6V1F | GSM4909307 | Human | Breast | IDC | 9.80e-08 | 3.33e-01 | 0.1569 |
| 9296 | ATP6V1F | GSM4909308 | Human | Breast | IDC | 2.39e-14 | 4.81e-01 | 0.158 |
| 9296 | ATP6V1F | GSM4909311 | Human | Breast | IDC | 9.95e-39 | -1.76e-01 | 0.1534 |
| 9296 | ATP6V1F | GSM4909312 | Human | Breast | IDC | 1.96e-13 | 1.86e-02 | 0.1552 |
| 9296 | ATP6V1F | GSM4909315 | Human | Breast | IDC | 3.16e-19 | 5.09e-01 | 0.21 |
| 9296 | ATP6V1F | GSM4909316 | Human | Breast | IDC | 1.84e-10 | 4.65e-01 | 0.21 |
| 9296 | ATP6V1F | GSM4909317 | Human | Breast | IDC | 2.35e-04 | 3.36e-01 | 0.1355 |
| 9296 | ATP6V1F | GSM4909318 | Human | Breast | IDC | 7.65e-05 | 3.86e-01 | 0.2031 |
| 9296 | ATP6V1F | GSM4909319 | Human | Breast | IDC | 8.01e-55 | -3.21e-02 | 0.1563 |
| Page: 1 2 3 4 5 6 7 8 9 10 11 |
| Tissue | Expression Dynamics | Abbreviation |
| Breast | 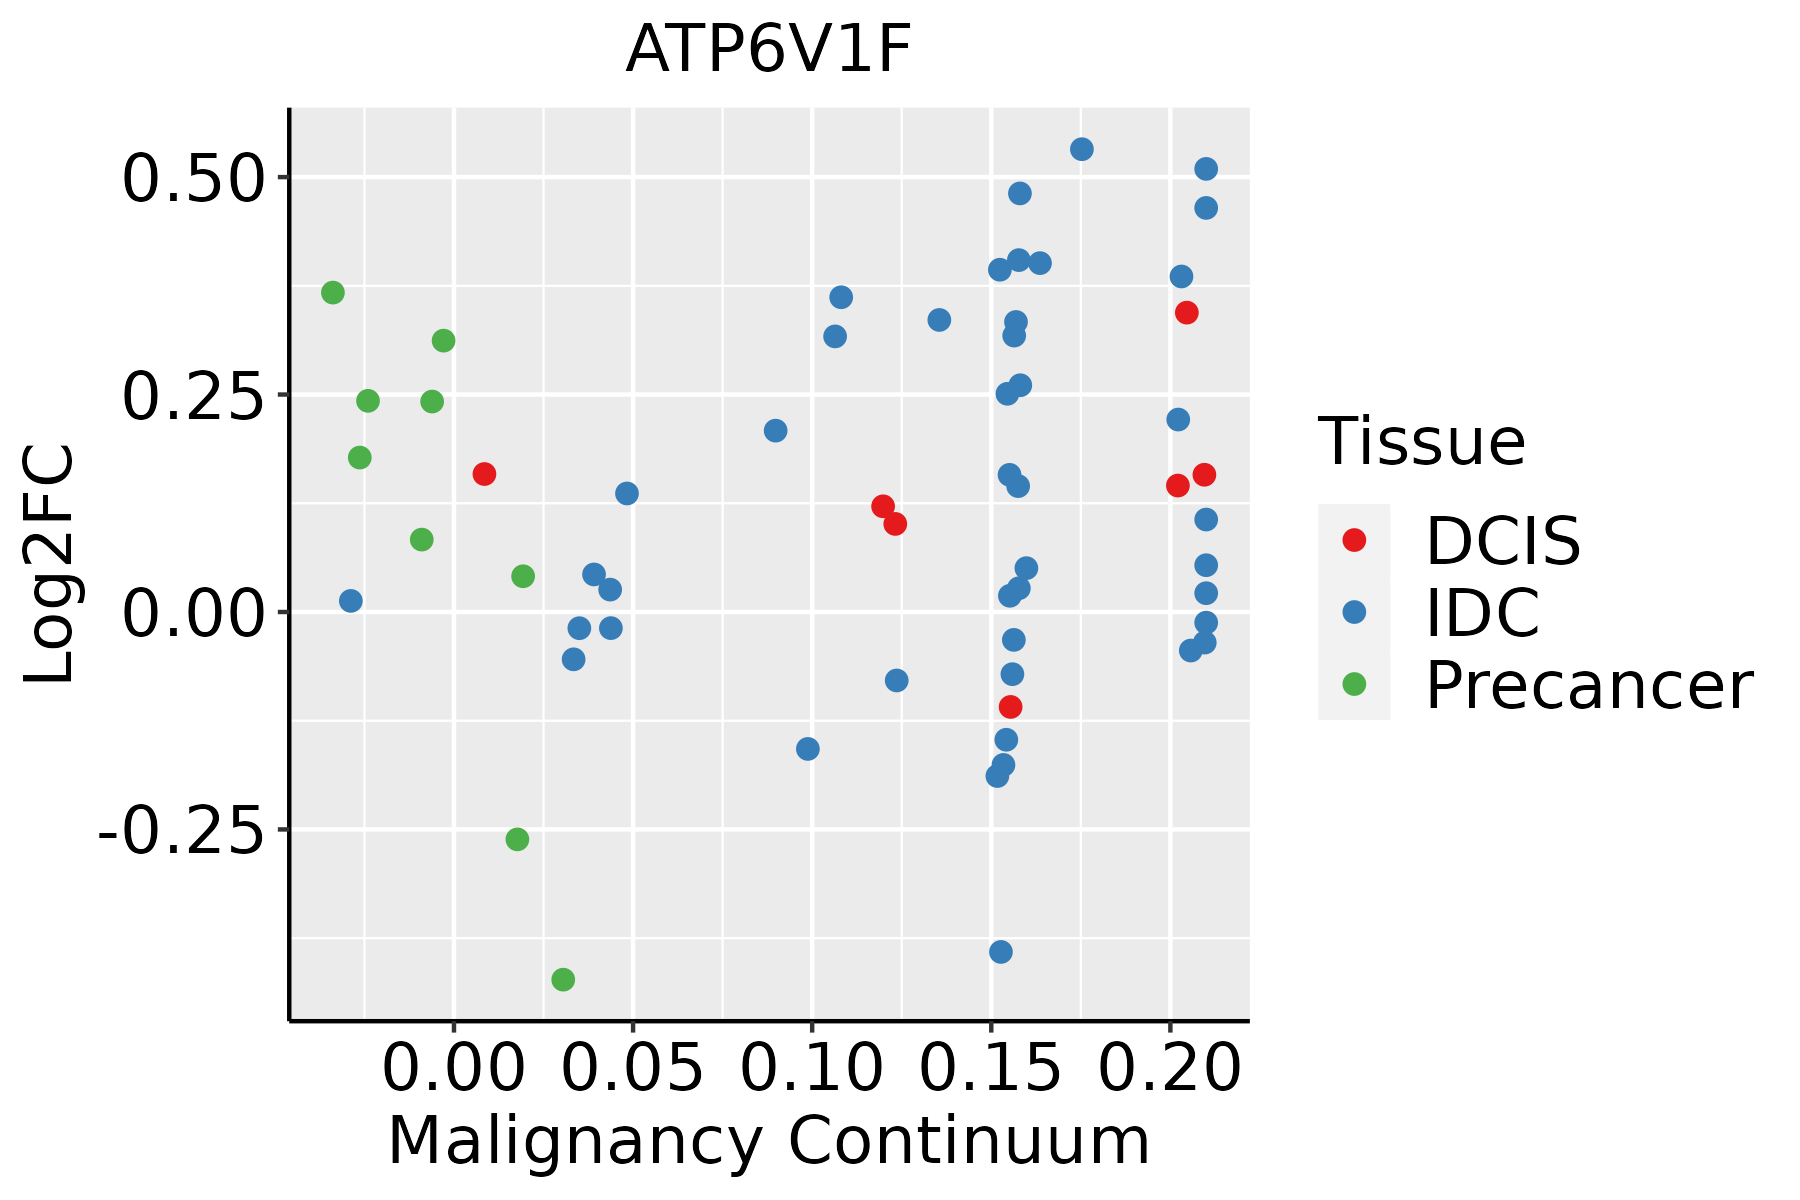 | IDC: Invasive ductal carcinoma |
| DCIS: Ductal carcinoma in situ | ||
| Precancer(BRCA1-mut): Precancerous lesion from BRCA1 mutation carriers | ||
| Cervix | 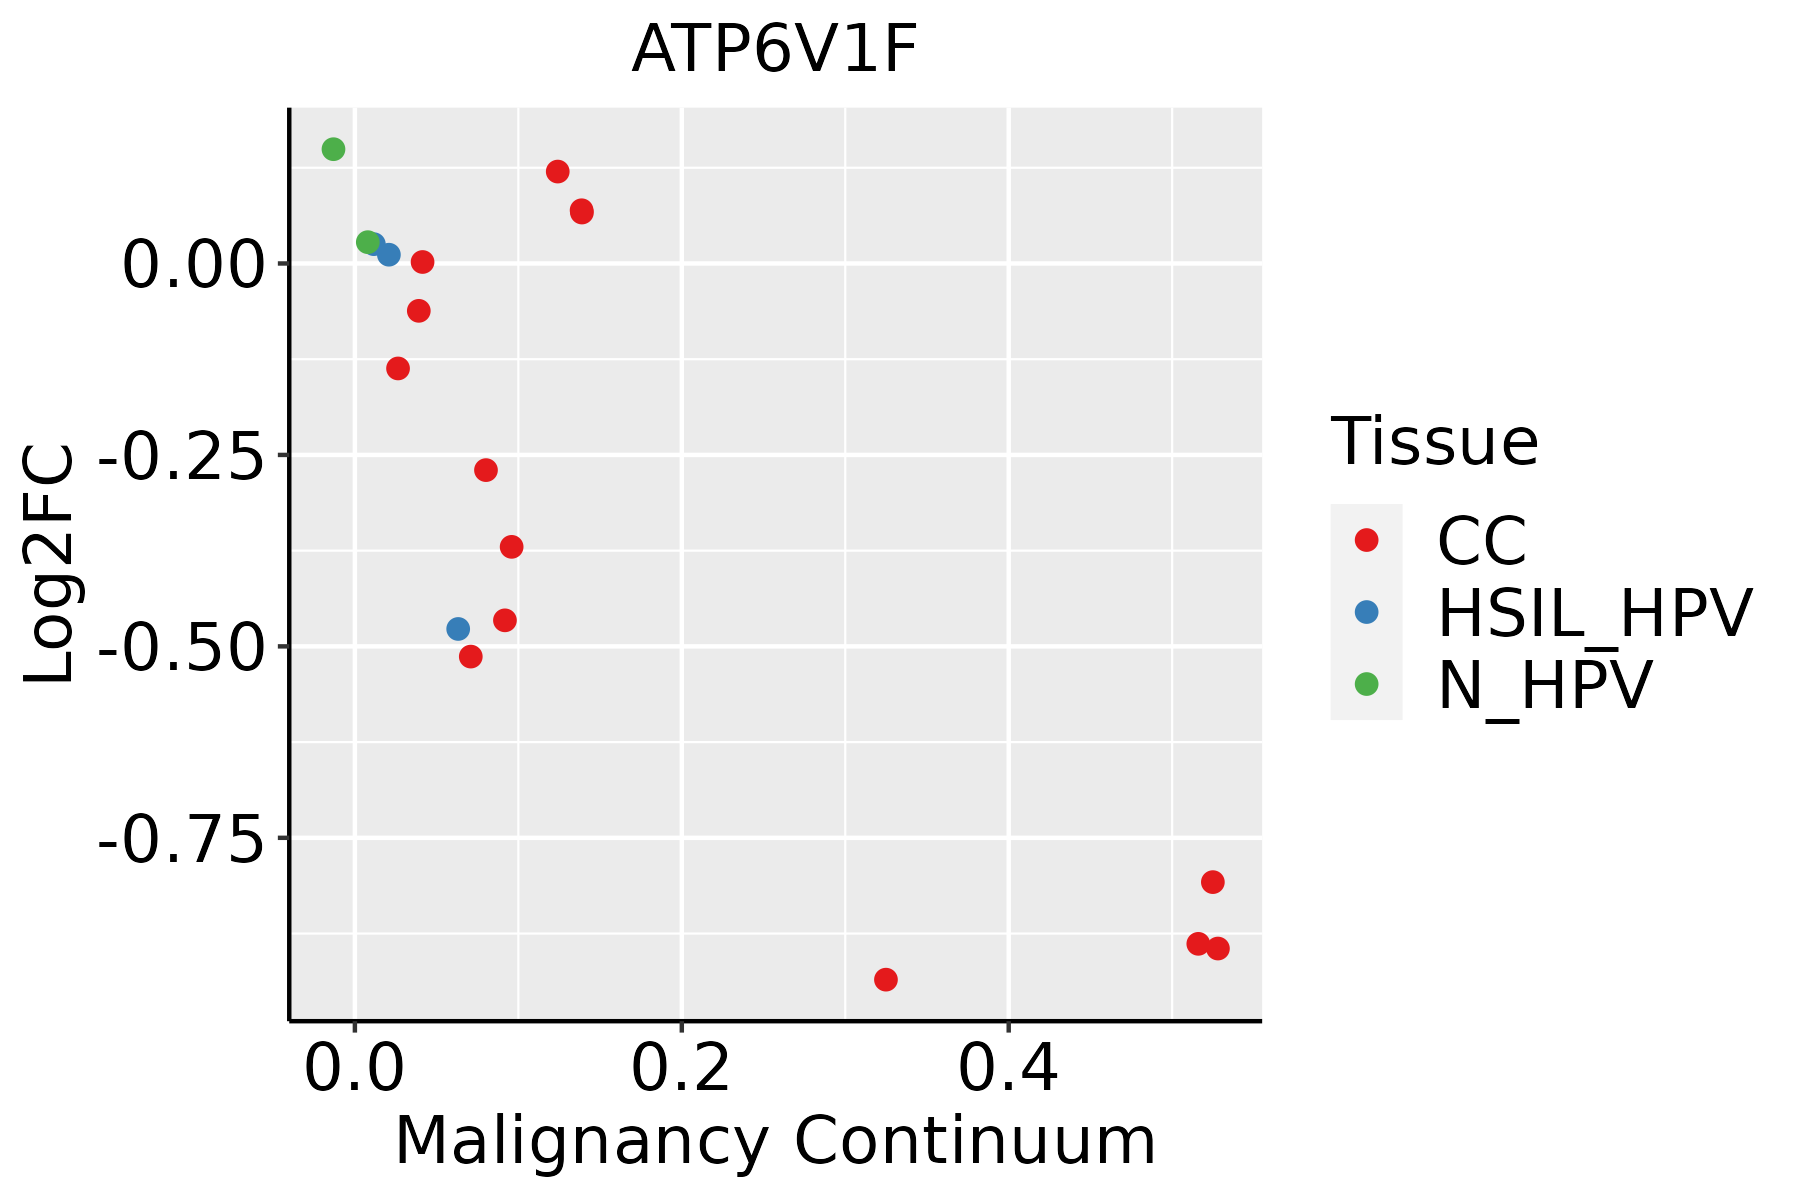 | CC: Cervix cancer |
| HSIL_HPV: HPV-infected high-grade squamous intraepithelial lesions | ||
| N_HPV: HPV-infected normal cervix | ||
| Colorectum (GSE201348) |  | FAP: Familial adenomatous polyposis |
| CRC: Colorectal cancer | ||
| Colorectum (HTA11) |  | AD: Adenomas |
| SER: Sessile serrated lesions | ||
| MSI-H: Microsatellite-high colorectal cancer | ||
| MSS: Microsatellite stable colorectal cancer | ||
| Endometrium |  | AEH: Atypical endometrial hyperplasia |
| EEC: Endometrioid Cancer | ||
| Esophagus |  | ESCC: Esophageal squamous cell carcinoma |
| HGIN: High-grade intraepithelial neoplasias | ||
| LGIN: Low-grade intraepithelial neoplasias | ||
| Liver | 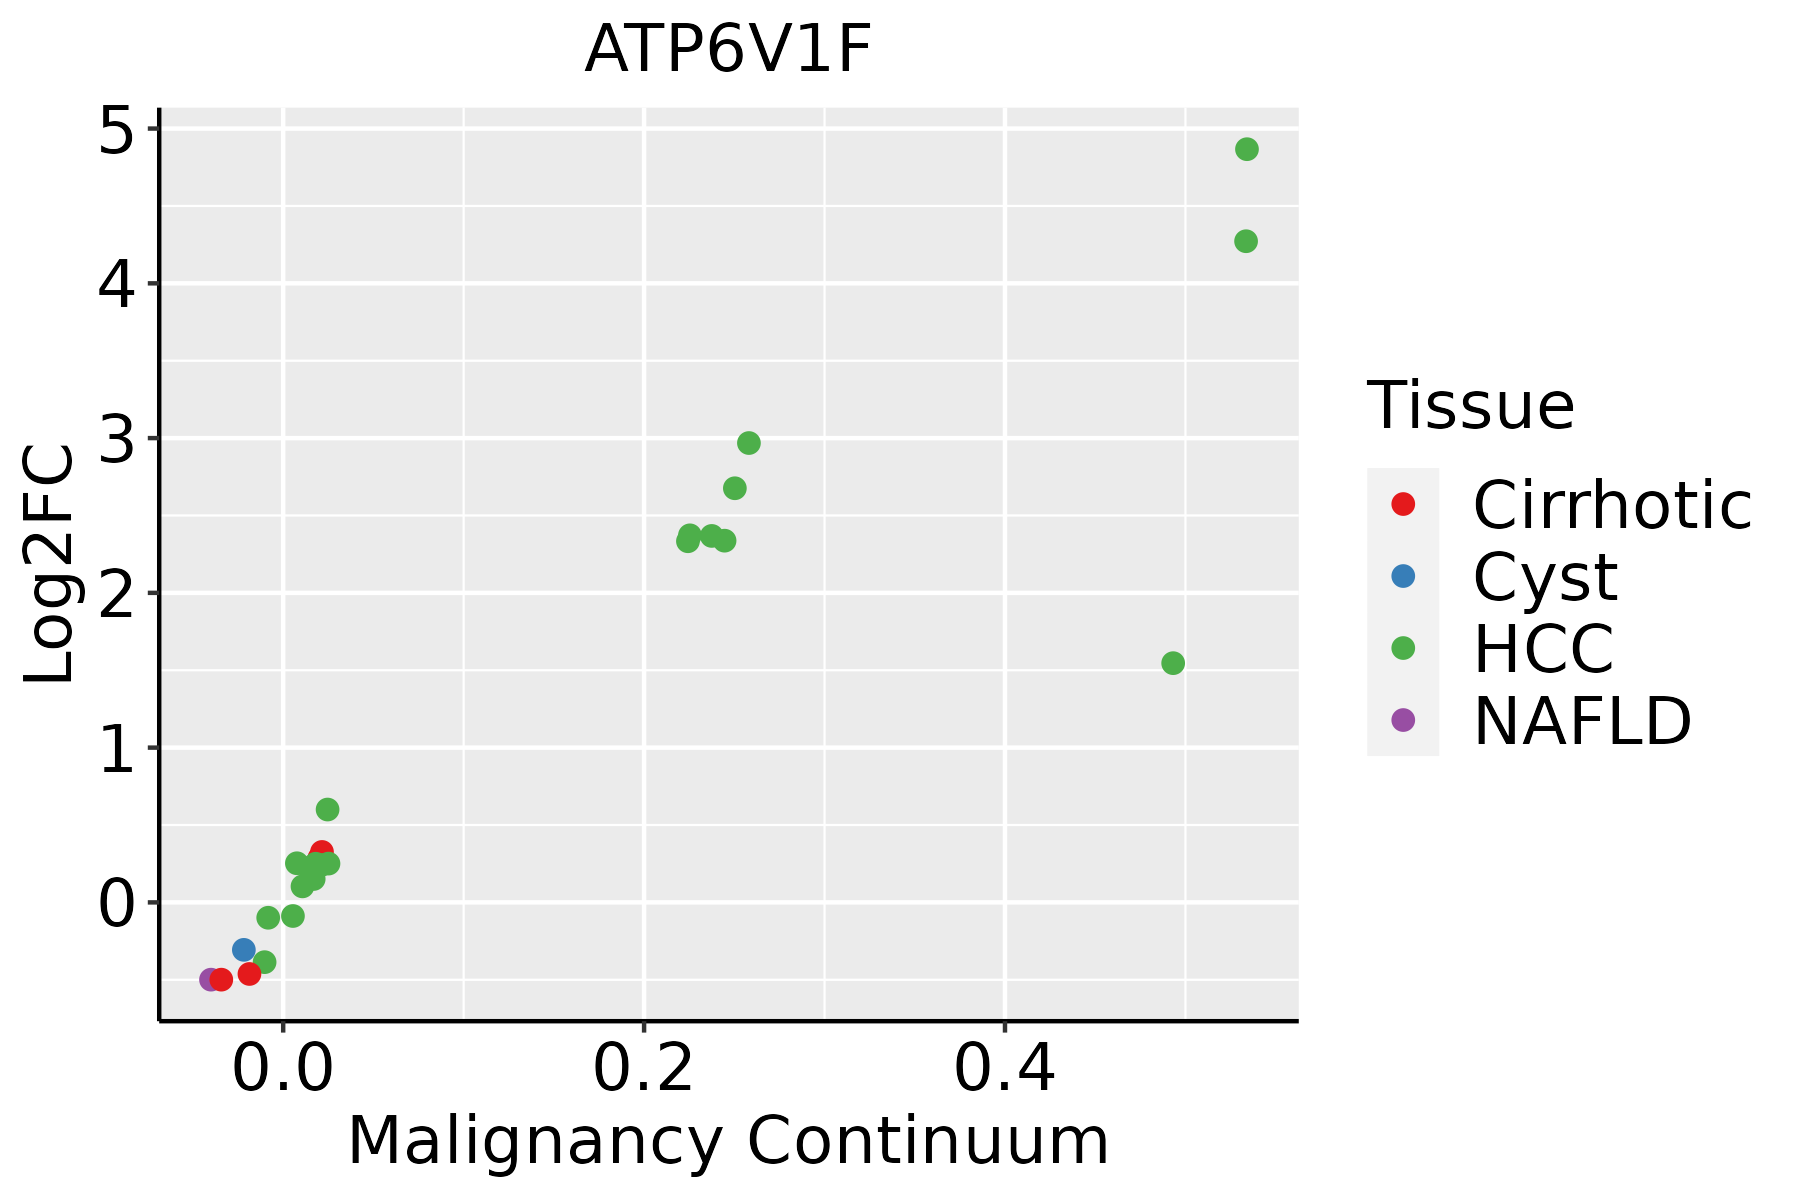 | HCC: Hepatocellular carcinoma |
| NAFLD: Non-alcoholic fatty liver disease | ||
| Oral Cavity | 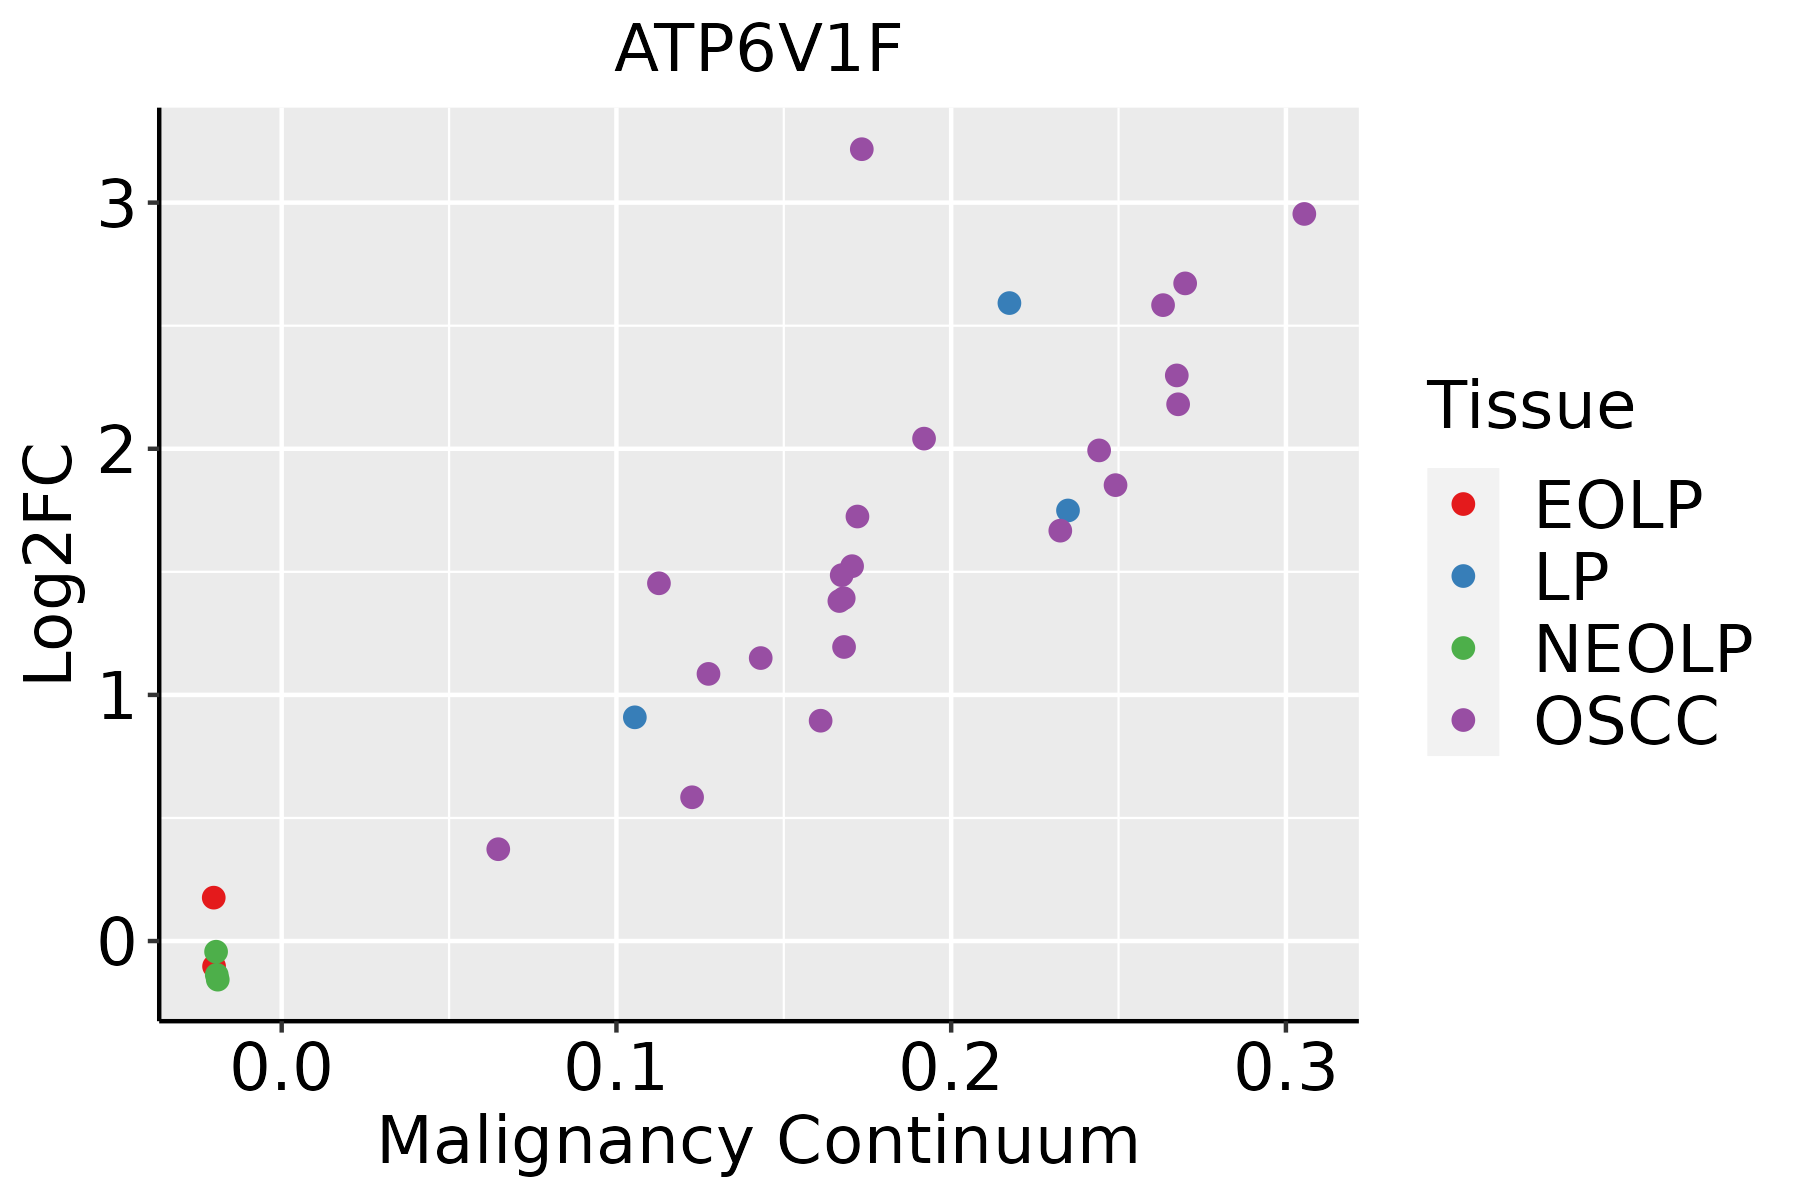 | EOLP: Erosive Oral lichen planus |
| LP: leukoplakia | ||
| NEOLP: Non-erosive oral lichen planus | ||
| OSCC: Oral squamous cell carcinoma | ||
| Prostate | 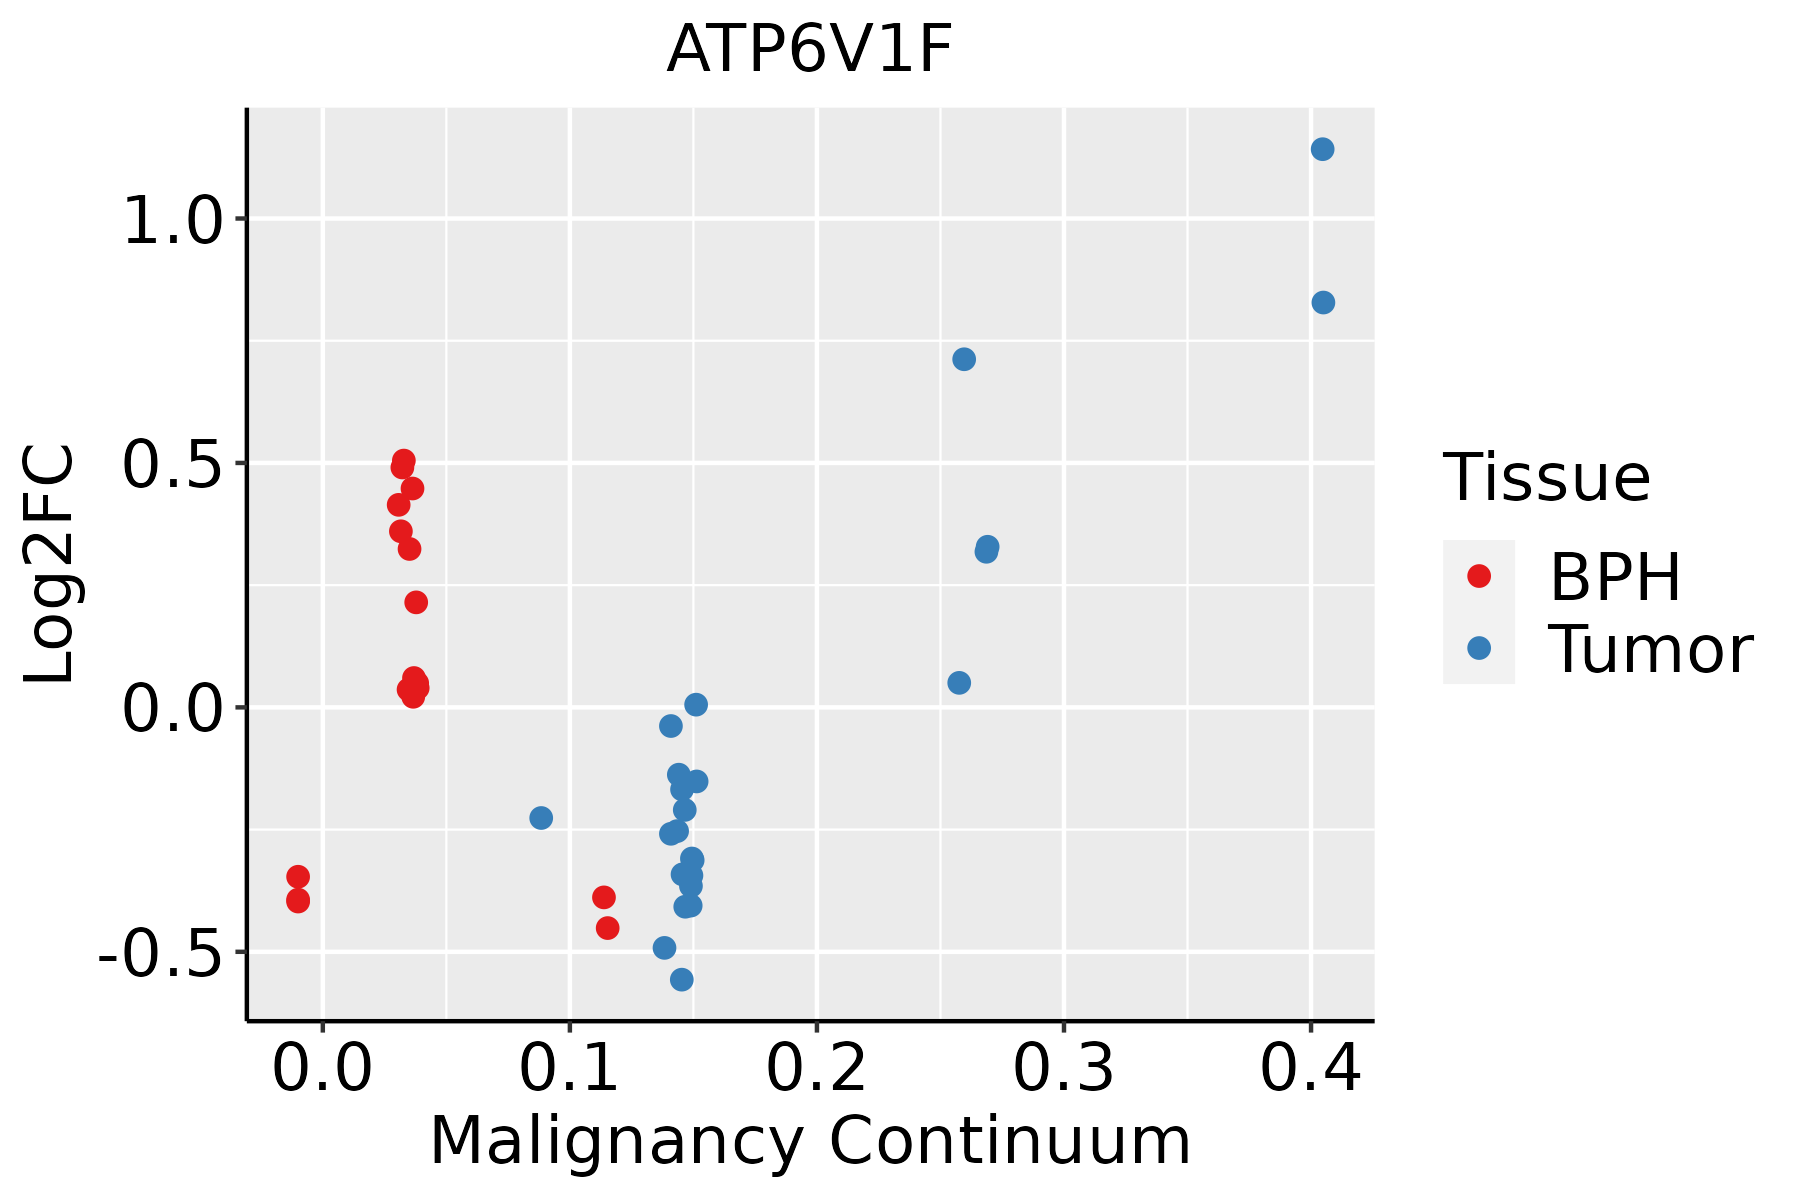 | BPH: Benign Prostatic Hyperplasia |
| Skin | 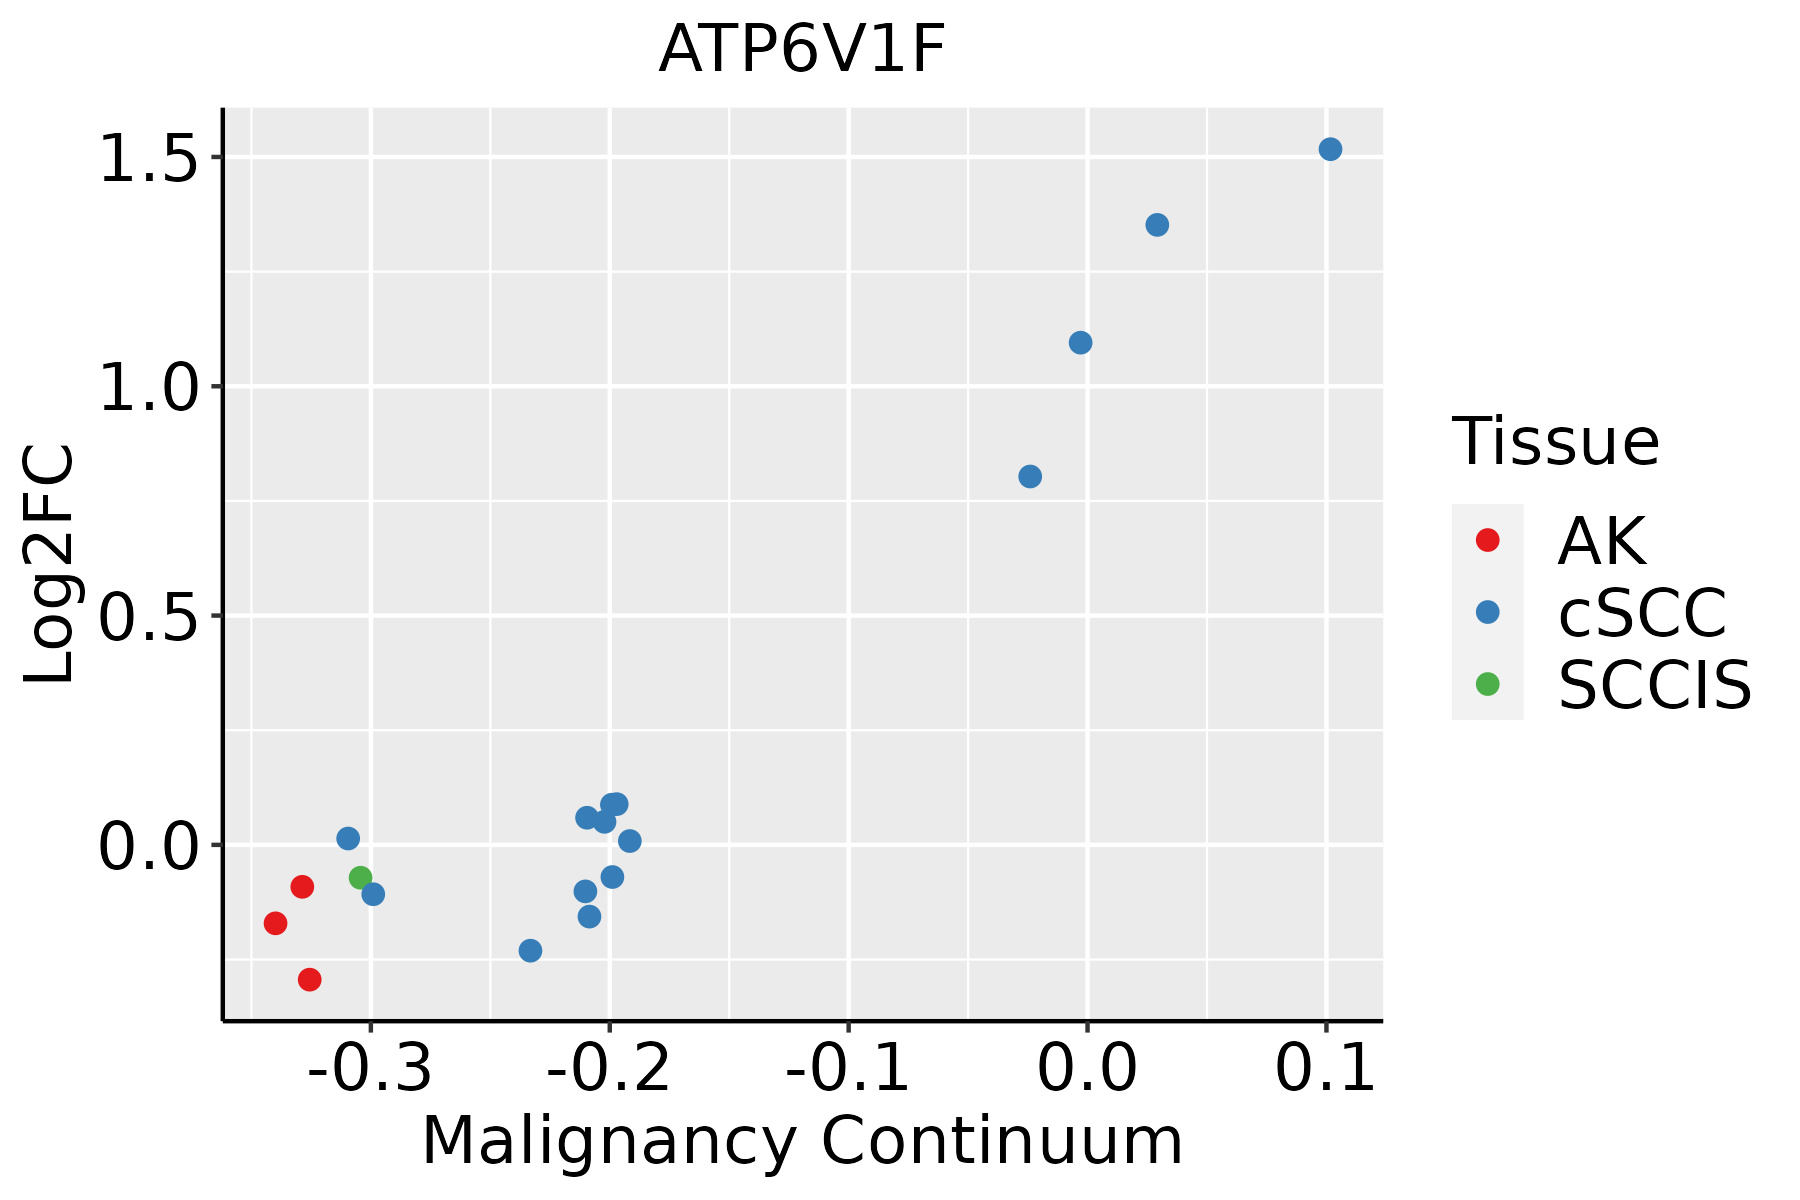 | AK: Actinic keratosis |
| cSCC: Cutaneous squamous cell carcinoma | ||
| SCCIS:squamous cell carcinoma in situ | ||
| Thyroid | 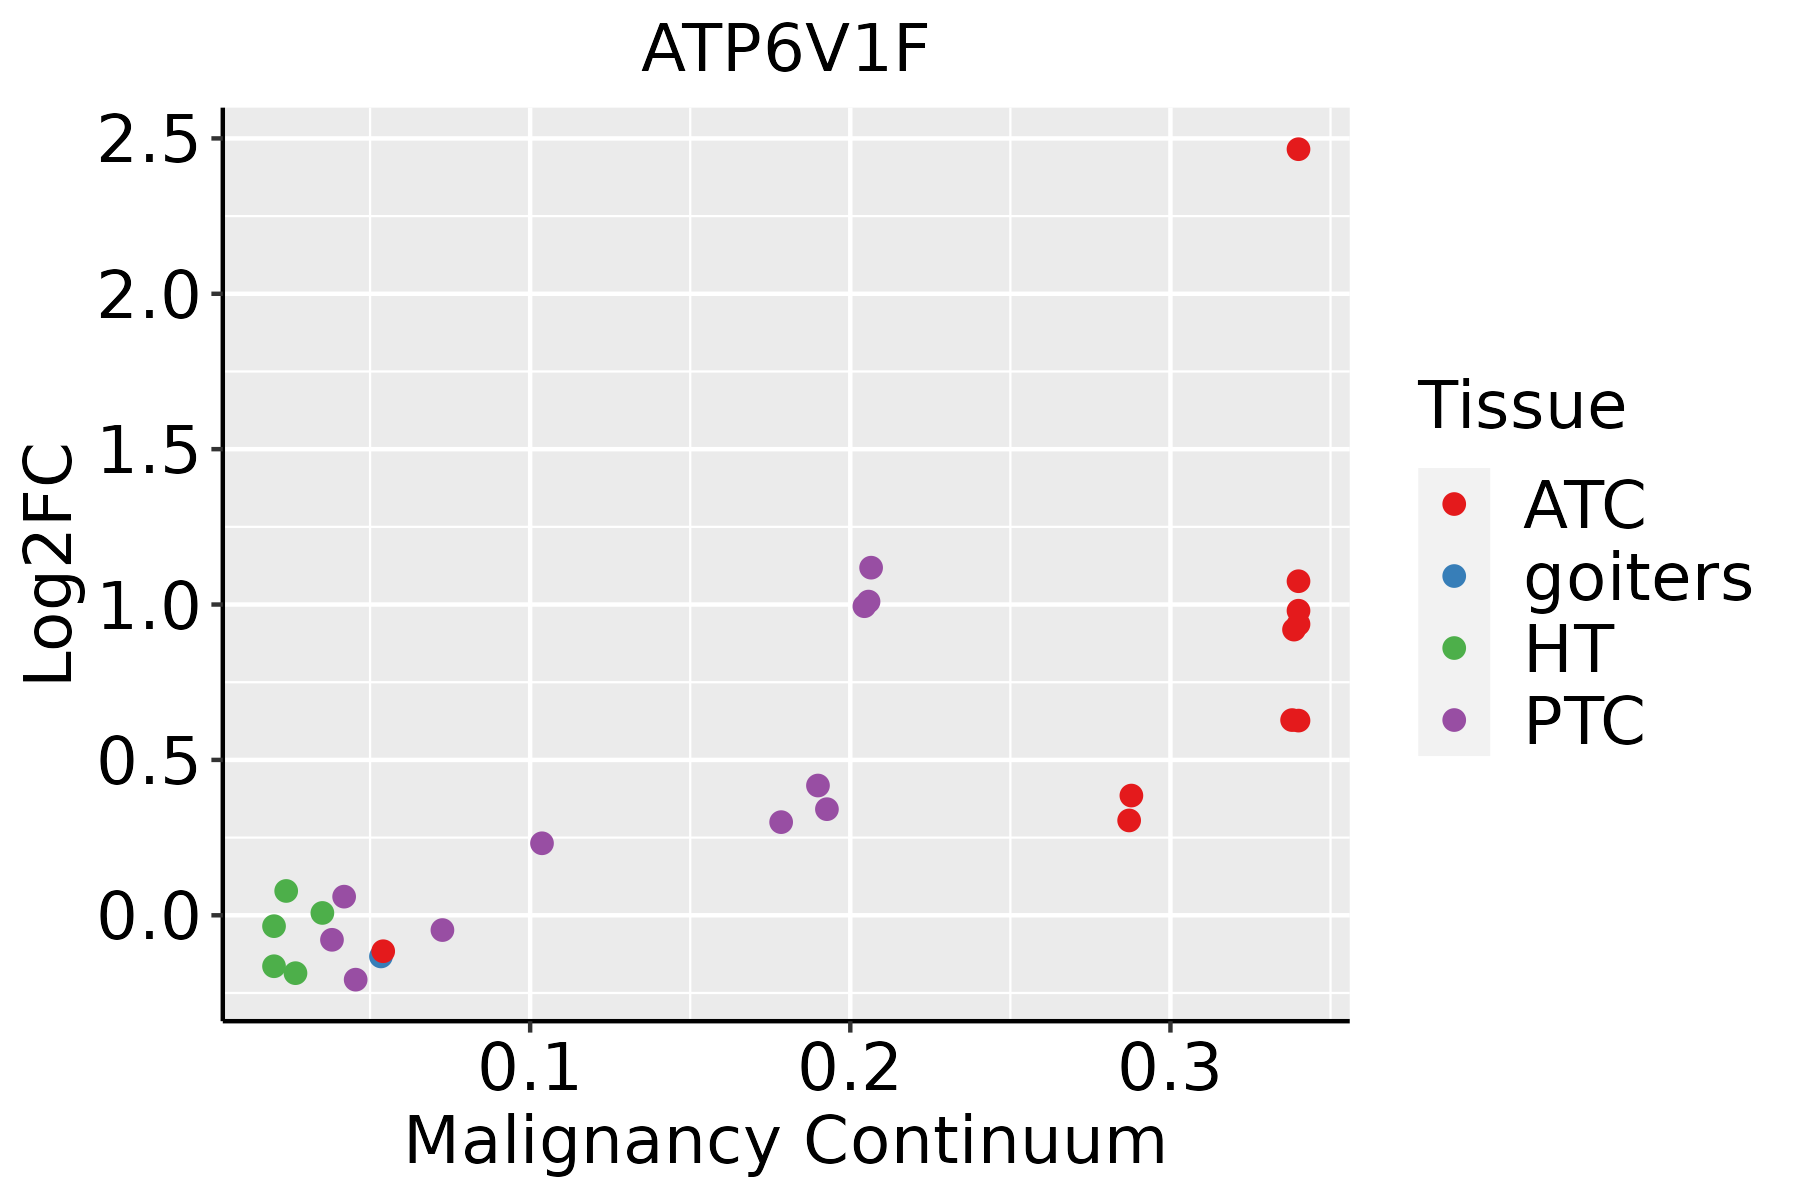 | ATC: Anaplastic thyroid cancer |
| HT: Hashimoto's thyroiditis | ||
| PTC: Papillary thyroid cancer |
| ∗log2FC in expression of this searched gene in stem-like cells from each diseased tissue sample relative to stem-like cells in normal samples in each tissue plotted against the malignancy continuum. Samples are colored based on if they are from different disease stage. |
Top |
Malignant transformation related pathway analysis |
| Find out the enriched GO biological processes and KEGG pathways involved in transition from healthy to precancer to cancer |
| Tissue | Disease Stage | Enriched GO biological Processes |
| Colorectum | AD |  |
| Colorectum | SER |  |
| Colorectum | MSS |  |
| Colorectum | MSI-H |  |
| Colorectum | FAP |  |
| ∗Top 15 enriched GO BP terms are showed in the bar plot of each disease state in each tissue. Each row represents a significant GO biological process which is colored according to the -log10(p.adjust). |
| Page: 1 2 3 4 5 6 7 8 9 |
| GO ID | Tissue | Disease Stage | Description | Gene Ratio | Bg Ratio | pvalue | p.adjust | Count |
| GO:19026008 | Breast | Precancer | proton transmembrane transport | 39/1080 | 157/18723 | 4.18e-15 | 1.18e-12 | 39 |
| GO:190260012 | Breast | IDC | proton transmembrane transport | 40/1434 | 157/18723 | 7.34e-12 | 1.34e-09 | 40 |
| GO:190260022 | Breast | DCIS | proton transmembrane transport | 40/1390 | 157/18723 | 2.77e-12 | 5.80e-10 | 40 |
| GO:19026009 | Cervix | CC | proton transmembrane transport | 39/2311 | 157/18723 | 1.23e-05 | 2.57e-04 | 39 |
| GO:190260013 | Cervix | HSIL_HPV | proton transmembrane transport | 20/737 | 157/18723 | 3.73e-06 | 1.51e-04 | 20 |
| GO:1902600 | Colorectum | AD | proton transmembrane transport | 66/3918 | 157/18723 | 1.59e-09 | 1.17e-07 | 66 |
| GO:19026001 | Colorectum | SER | proton transmembrane transport | 60/2897 | 157/18723 | 3.12e-12 | 7.08e-10 | 60 |
| GO:19026002 | Colorectum | MSS | proton transmembrane transport | 57/3467 | 157/18723 | 1.00e-07 | 4.81e-06 | 57 |
| GO:190260010 | Endometrium | AEH | proton transmembrane transport | 43/2100 | 157/18723 | 1.70e-08 | 1.04e-06 | 43 |
| GO:190260014 | Endometrium | EEC | proton transmembrane transport | 43/2168 | 157/18723 | 4.32e-08 | 2.38e-06 | 43 |
| GO:190260017 | Esophagus | HGIN | proton transmembrane transport | 43/2587 | 157/18723 | 5.51e-06 | 1.75e-04 | 43 |
| GO:190260018 | Esophagus | ESCC | proton transmembrane transport | 88/8552 | 157/18723 | 5.62e-03 | 2.10e-02 | 88 |
| GO:19026007 | Liver | HCC | proton transmembrane transport | 87/7958 | 157/18723 | 7.27e-04 | 4.42e-03 | 87 |
| GO:190260015 | Prostate | BPH | proton transmembrane transport | 52/3107 | 157/18723 | 2.81e-07 | 6.06e-06 | 52 |
| GO:190260016 | Prostate | Tumor | proton transmembrane transport | 55/3246 | 157/18723 | 6.83e-08 | 1.96e-06 | 55 |
| GO:1902600110 | Skin | cSCC | proton transmembrane transport | 57/4864 | 157/18723 | 2.66e-03 | 1.50e-02 | 57 |
| GO:1902600111 | Thyroid | PTC | proton transmembrane transport | 72/5968 | 157/18723 | 1.64e-04 | 1.26e-03 | 72 |
| GO:190260032 | Thyroid | ATC | proton transmembrane transport | 73/6293 | 157/18723 | 5.25e-04 | 3.06e-03 | 73 |
| Page: 1 |
| Pathway ID | Tissue | Disease Stage | Description | Gene Ratio | Bg Ratio | pvalue | p.adjust | qvalue | Count |
| hsa0019016 | Breast | Precancer | Oxidative phosphorylation | 59/684 | 134/8465 | 6.15e-30 | 3.24e-28 | 2.48e-28 | 59 |
| hsa0511014 | Breast | Precancer | Vibrio cholerae infection | 14/684 | 50/8465 | 2.67e-05 | 2.64e-04 | 2.02e-04 | 14 |
| hsa0414518 | Breast | Precancer | Phagosome | 27/684 | 152/8465 | 7.37e-05 | 6.85e-04 | 5.25e-04 | 27 |
| hsa0532312 | Breast | Precancer | Rheumatoid arthritis | 19/684 | 93/8465 | 1.30e-04 | 1.14e-03 | 8.73e-04 | 19 |
| hsa051206 | Breast | Precancer | Epithelial cell signaling in Helicobacter pylori infection | 14/684 | 70/8465 | 1.21e-03 | 7.99e-03 | 6.12e-03 | 14 |
| hsa0019017 | Breast | Precancer | Oxidative phosphorylation | 59/684 | 134/8465 | 6.15e-30 | 3.24e-28 | 2.48e-28 | 59 |
| hsa0511015 | Breast | Precancer | Vibrio cholerae infection | 14/684 | 50/8465 | 2.67e-05 | 2.64e-04 | 2.02e-04 | 14 |
| hsa0414519 | Breast | Precancer | Phagosome | 27/684 | 152/8465 | 7.37e-05 | 6.85e-04 | 5.25e-04 | 27 |
| hsa0532313 | Breast | Precancer | Rheumatoid arthritis | 19/684 | 93/8465 | 1.30e-04 | 1.14e-03 | 8.73e-04 | 19 |
| hsa0512013 | Breast | Precancer | Epithelial cell signaling in Helicobacter pylori infection | 14/684 | 70/8465 | 1.21e-03 | 7.99e-03 | 6.12e-03 | 14 |
| hsa0019023 | Breast | IDC | Oxidative phosphorylation | 62/867 | 134/8465 | 4.78e-27 | 2.59e-25 | 1.94e-25 | 62 |
| hsa0511022 | Breast | IDC | Vibrio cholerae infection | 17/867 | 50/8465 | 4.82e-06 | 6.82e-05 | 5.10e-05 | 17 |
| hsa0414522 | Breast | IDC | Phagosome | 34/867 | 152/8465 | 8.00e-06 | 9.99e-05 | 7.48e-05 | 34 |
| hsa0532321 | Breast | IDC | Rheumatoid arthritis | 21/867 | 93/8465 | 3.69e-04 | 3.15e-03 | 2.36e-03 | 21 |
| hsa0512022 | Breast | IDC | Epithelial cell signaling in Helicobacter pylori infection | 16/867 | 70/8465 | 1.56e-03 | 1.13e-02 | 8.42e-03 | 16 |
| hsa0019033 | Breast | IDC | Oxidative phosphorylation | 62/867 | 134/8465 | 4.78e-27 | 2.59e-25 | 1.94e-25 | 62 |
| hsa0511032 | Breast | IDC | Vibrio cholerae infection | 17/867 | 50/8465 | 4.82e-06 | 6.82e-05 | 5.10e-05 | 17 |
| hsa0414532 | Breast | IDC | Phagosome | 34/867 | 152/8465 | 8.00e-06 | 9.99e-05 | 7.48e-05 | 34 |
| hsa0532331 | Breast | IDC | Rheumatoid arthritis | 21/867 | 93/8465 | 3.69e-04 | 3.15e-03 | 2.36e-03 | 21 |
| hsa0512032 | Breast | IDC | Epithelial cell signaling in Helicobacter pylori infection | 16/867 | 70/8465 | 1.56e-03 | 1.13e-02 | 8.42e-03 | 16 |
| Page: 1 2 3 4 5 6 7 8 9 |
Top |
Cell-cell communication analysis |
| Identification of potential cell-cell interactions between two cell types and their ligand-receptor pairs for different disease states |
| Ligand | Receptor | LRpair | Pathway | Tissue | Disease Stage |
| Page: 1 |
Top |
Single-cell gene regulatory network inference analysis |
| Find out the significant the regulons (TFs) and the target genes of each regulon across cell types for different disease states |
| TF | Cell Type | Tissue | Disease Stage | Target Gene | RSS | Regulon Activity |
| ∗The dot plots of a searched regulon are shown for all cell subpopulations in each disease state of each tissue based on the regulon specific score inferred using pySCENIC and by calculating the average expression. |
| Page: 1 |
Top |
Somatic mutation of malignant transformation related genes |
| Annotation of somatic variants for genes involved in malignant transformation |
| Hugo Symbol | Variant Class | Variant Classification | dbSNP RS | HGVSc | HGVSp | HGVSp Short | SWISSPROT | BIOTYPE | SIFT | PolyPhen | Tumor Sample Barcode | Tissue | Histology | Sex | Age | Stage | Therapy Types | Drugs | Outcome |
| ATP6V1F | SNV | Missense_Mutation | rs745835589 | c.403C>T | p.Arg135Cys | p.R135C | Q16864 | protein_coding | tolerated(0.08) | probably_damaging(0.945) | TCGA-WS-AB45-01 | Colorectum | colon adenocarcinoma | Female | <65 | I/II | Unknown | Unknown | SD |
| ATP6V1F | SNV | Missense_Mutation | novel | c.134T>G | p.Ile45Ser | p.I45S | Q16864 | protein_coding | tolerated(0.17) | benign(0.193) | TCGA-A5-A2K5-01 | Endometrium | uterine corpus endometrioid carcinoma | Female | >=65 | I/II | Unknown | Unknown | SD |
| ATP6V1F | SNV | Missense_Mutation | c.80A>T | p.Glu27Val | p.E27V | Q16864 | protein_coding | deleterious(0) | probably_damaging(0.959) | TCGA-AP-A051-01 | Endometrium | uterine corpus endometrioid carcinoma | Female | >=65 | I/II | Unknown | Unknown | SD | |
| ATP6V1F | SNV | Missense_Mutation | novel | c.128N>T | p.Thr43Ile | p.T43I | Q16864 | protein_coding | deleterious(0.01) | possibly_damaging(0.894) | TCGA-AX-A1CE-01 | Endometrium | uterine corpus endometrioid carcinoma | Female | <65 | I/II | Unspecific | Paclitaxel | SD |
| ATP6V1F | SNV | Missense_Mutation | c.382N>A | p.Ala128Thr | p.A128T | Q16864 | protein_coding | deleterious(0.03) | possibly_damaging(0.588) | TCGA-EY-A2OM-01 | Endometrium | uterine corpus endometrioid carcinoma | Female | <65 | I/II | Chemotherapy | taxol | SD | |
| ATP6V1F | SNV | Missense_Mutation | c.406N>T | p.Arg136Trp | p.R136W | Q16864 | protein_coding | deleterious(0) | probably_damaging(1) | TCGA-MI-A75E-01 | Liver | liver hepatocellular carcinoma | Male | <65 | III/IV | Unknown | Unknown | SD | |
| ATP6V1F | SNV | Missense_Mutation | rs200558362 | c.12N>T | p.Arg4Ser | p.R4S | Q16864 | protein_coding | deleterious(0.04) | benign(0.138) | TCGA-78-7220-01 | Lung | lung adenocarcinoma | Female | <65 | III/IV | Unknown | Unknown | PD |
| ATP6V1F | SNV | Missense_Mutation | novel | c.79G>A | p.Glu27Lys | p.E27K | Q16864 | protein_coding | deleterious(0.01) | possibly_damaging(0.783) | TCGA-BB-A5HU-01 | Oral cavity | head & neck squamous cell carcinoma | Male | <65 | I/II | Chemotherapy | cisplatin | CR |
| ATP6V1F | SNV | Missense_Mutation | c.420N>A | p.Met140Ile | p.M140I | Q16864 | protein_coding | tolerated(0.12) | benign(0.006) | TCGA-BR-8372-01 | Stomach | stomach adenocarcinoma | Male | <65 | III/IV | Chemotherapy | etoposide | CR | |
| ATP6V1F | SNV | Missense_Mutation | c.247N>C | p.Phe83Leu | p.F83L | Q16864 | protein_coding | deleterious(0.03) | benign(0.057) | TCGA-CG-5721-01 | Stomach | stomach adenocarcinoma | Male | <65 | III/IV | Unknown | Unknown | SD |
| Page: 1 |
Top |
Related drugs of malignant transformation related genes |
| Identification of chemicals and drugs interact with genes involved in malignant transfromation |
| (DGIdb 4.0) |
| Entrez ID | Symbol | Category | Interaction Types | Drug Claim Name | Drug Name | PMIDs |
| Page: 1 |

Copyright 2023-Present -The University of Texas Health Science Center at Houston |