
|
|||||
|
 | |
| |
| |
| |
| |
| |
|
Gene: ATP6V1B2 |
Gene summary for ATP6V1B2 |
| Gene information | Species | Human | Gene symbol | ATP6V1B2 | Gene ID | 526 |
| Gene name | ATPase H+ transporting V1 subunit B2 | |
| Gene Alias | ATP6B1B2 | |
| Cytomap | 8p21.3 | |
| Gene Type | protein-coding | GO ID | GO:0006810 | UniProtAcc | A0A140VK65 |
Top |
Malignant transformation analysis |
| Identification of the aberrant gene expression in precancerous and cancerous lesions by comparing the gene expression of stem-like cells in diseased tissues with normal stem cells |
| Entrez ID | Symbol | Replicates | Species | Organ | Tissue | Adj P-value | Log2FC | Malignancy |
| 526 | ATP6V1B2 | HTA11_78_2000001011 | Human | Colorectum | AD | 1.97e-08 | 4.56e-01 | -0.1088 |
| 526 | ATP6V1B2 | HTA11_5212_2000001011 | Human | Colorectum | AD | 8.09e-03 | 3.52e-01 | -0.2061 |
| 526 | ATP6V1B2 | HTA11_99999970781_79442 | Human | Colorectum | MSS | 2.35e-10 | 4.39e-01 | 0.294 |
| 526 | ATP6V1B2 | HTA11_99999965062_69753 | Human | Colorectum | MSI-H | 4.49e-04 | 1.02e+00 | 0.3487 |
| 526 | ATP6V1B2 | LZE4T | Human | Esophagus | ESCC | 6.70e-18 | 6.32e-01 | 0.0811 |
| 526 | ATP6V1B2 | LZE7T | Human | Esophagus | ESCC | 3.47e-05 | 5.93e-02 | 0.0667 |
| 526 | ATP6V1B2 | LZE8T | Human | Esophagus | ESCC | 4.00e-09 | 2.24e-01 | 0.067 |
| 526 | ATP6V1B2 | LZE20T | Human | Esophagus | ESCC | 1.46e-02 | -3.00e-02 | 0.0662 |
| 526 | ATP6V1B2 | LZE24T | Human | Esophagus | ESCC | 8.88e-10 | 1.95e-01 | 0.0596 |
| 526 | ATP6V1B2 | LZE6T | Human | Esophagus | ESCC | 5.89e-04 | 1.61e-02 | 0.0845 |
| 526 | ATP6V1B2 | P1T-E | Human | Esophagus | ESCC | 1.10e-03 | 1.59e-01 | 0.0875 |
| 526 | ATP6V1B2 | P2T-E | Human | Esophagus | ESCC | 1.04e-25 | 4.87e-01 | 0.1177 |
| 526 | ATP6V1B2 | P4T-E | Human | Esophagus | ESCC | 3.52e-23 | 5.78e-01 | 0.1323 |
| 526 | ATP6V1B2 | P5T-E | Human | Esophagus | ESCC | 1.31e-04 | 8.33e-02 | 0.1327 |
| 526 | ATP6V1B2 | P8T-E | Human | Esophagus | ESCC | 1.19e-20 | 1.31e-01 | 0.0889 |
| 526 | ATP6V1B2 | P9T-E | Human | Esophagus | ESCC | 7.80e-07 | 1.42e-01 | 0.1131 |
| 526 | ATP6V1B2 | P10T-E | Human | Esophagus | ESCC | 1.27e-22 | 2.73e-01 | 0.116 |
| 526 | ATP6V1B2 | P11T-E | Human | Esophagus | ESCC | 1.85e-08 | 3.43e-01 | 0.1426 |
| 526 | ATP6V1B2 | P12T-E | Human | Esophagus | ESCC | 1.79e-29 | 2.57e-01 | 0.1122 |
| 526 | ATP6V1B2 | P15T-E | Human | Esophagus | ESCC | 2.15e-08 | 9.64e-02 | 0.1149 |
| Page: 1 2 3 4 5 |
| Tissue | Expression Dynamics | Abbreviation |
| Colorectum (GSE201348) |  | FAP: Familial adenomatous polyposis |
| CRC: Colorectal cancer | ||
| Colorectum (HTA11) |  | AD: Adenomas |
| SER: Sessile serrated lesions | ||
| MSI-H: Microsatellite-high colorectal cancer | ||
| MSS: Microsatellite stable colorectal cancer | ||
| Esophagus |  | ESCC: Esophageal squamous cell carcinoma |
| HGIN: High-grade intraepithelial neoplasias | ||
| LGIN: Low-grade intraepithelial neoplasias | ||
| Oral Cavity | 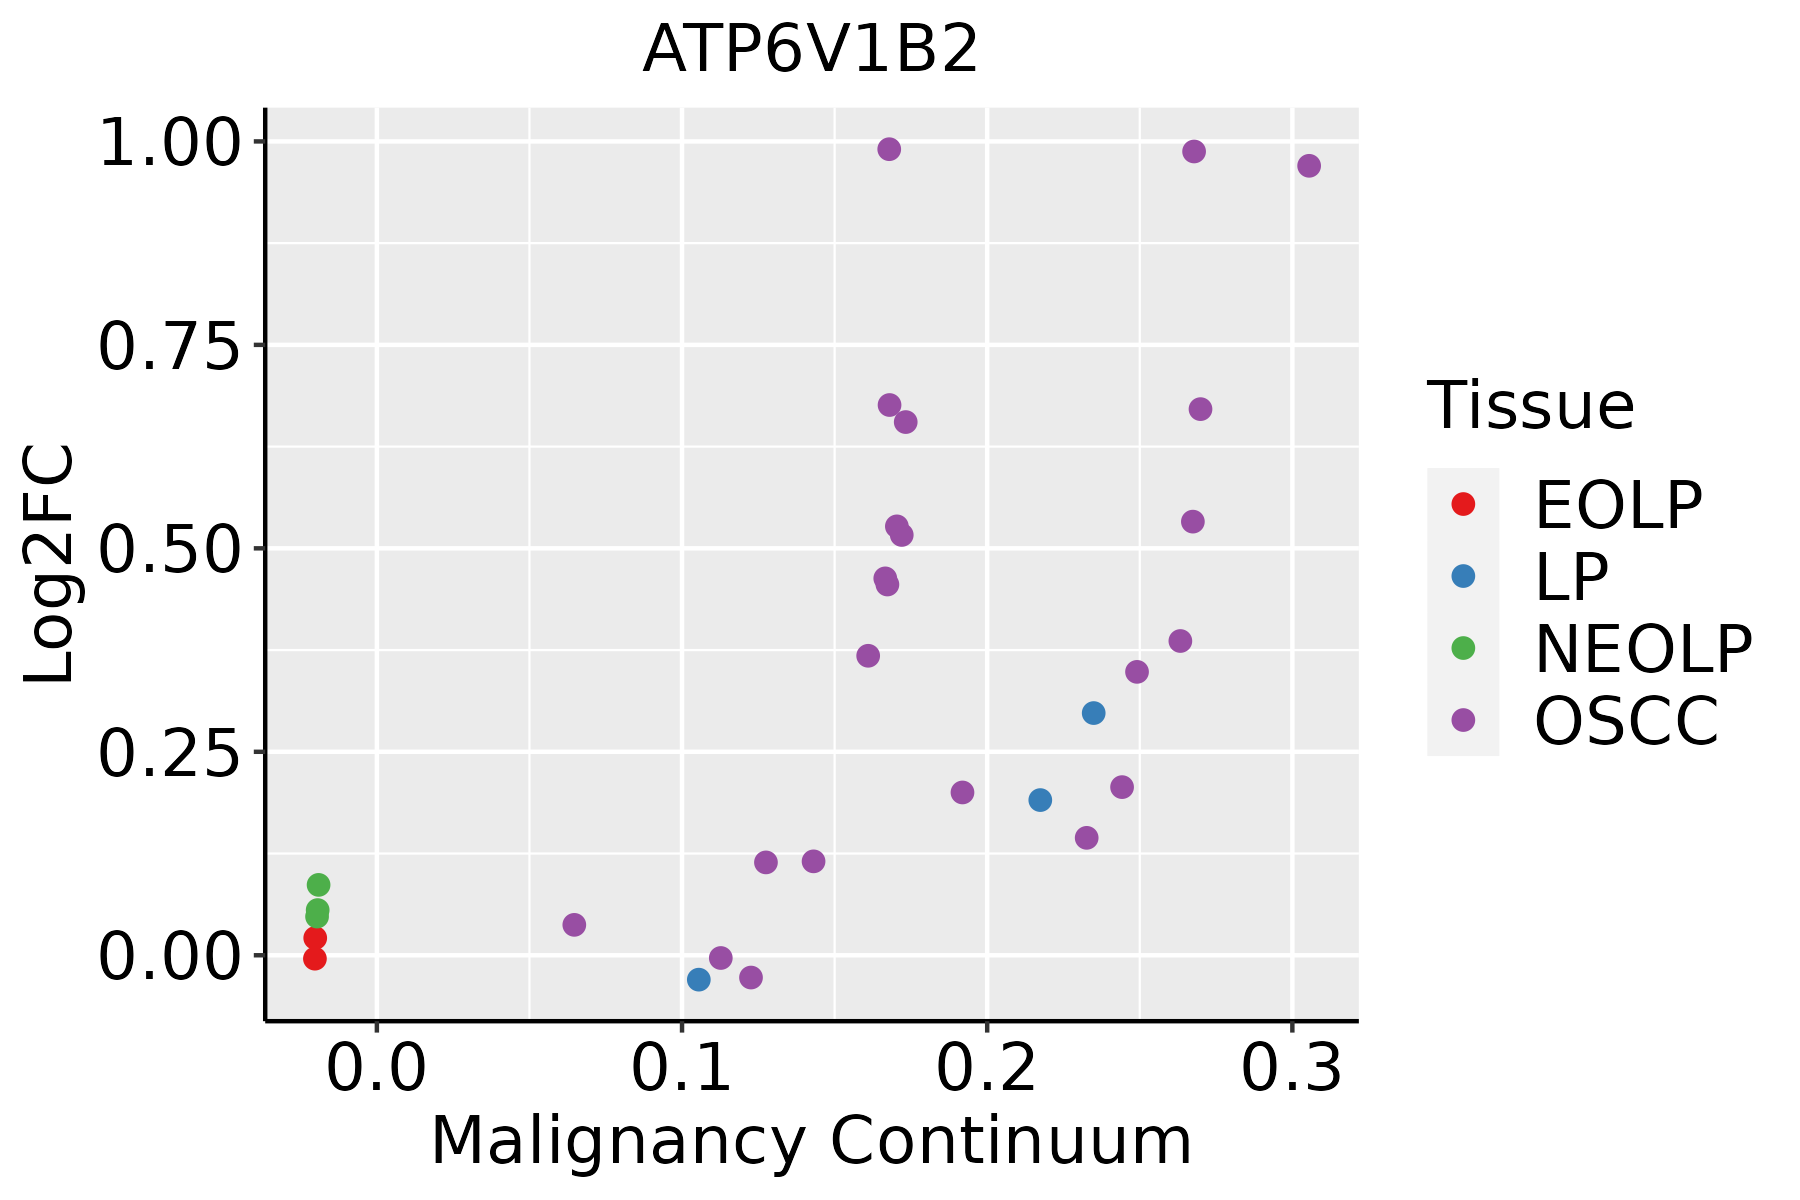 | EOLP: Erosive Oral lichen planus |
| LP: leukoplakia | ||
| NEOLP: Non-erosive oral lichen planus | ||
| OSCC: Oral squamous cell carcinoma | ||
| Skin | 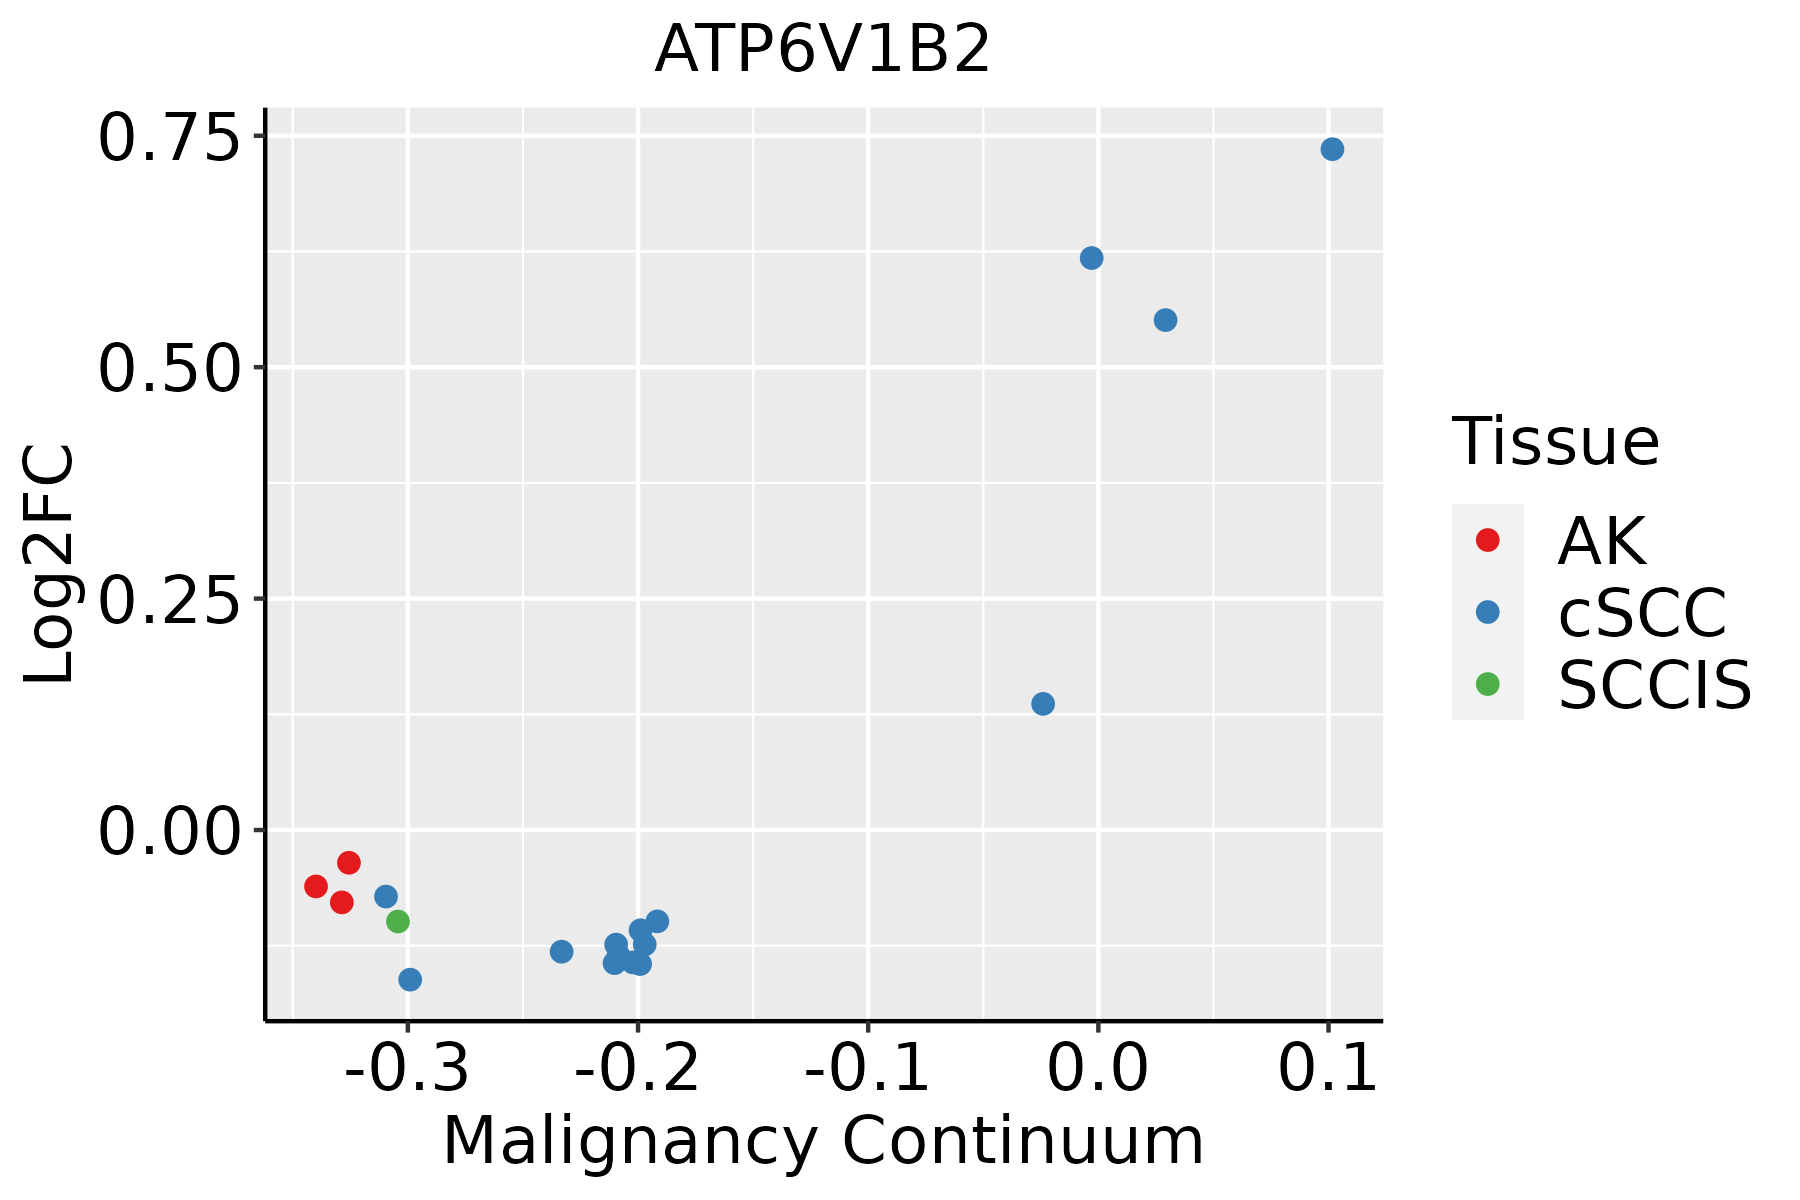 | AK: Actinic keratosis |
| cSCC: Cutaneous squamous cell carcinoma | ||
| SCCIS:squamous cell carcinoma in situ | ||
| Thyroid | 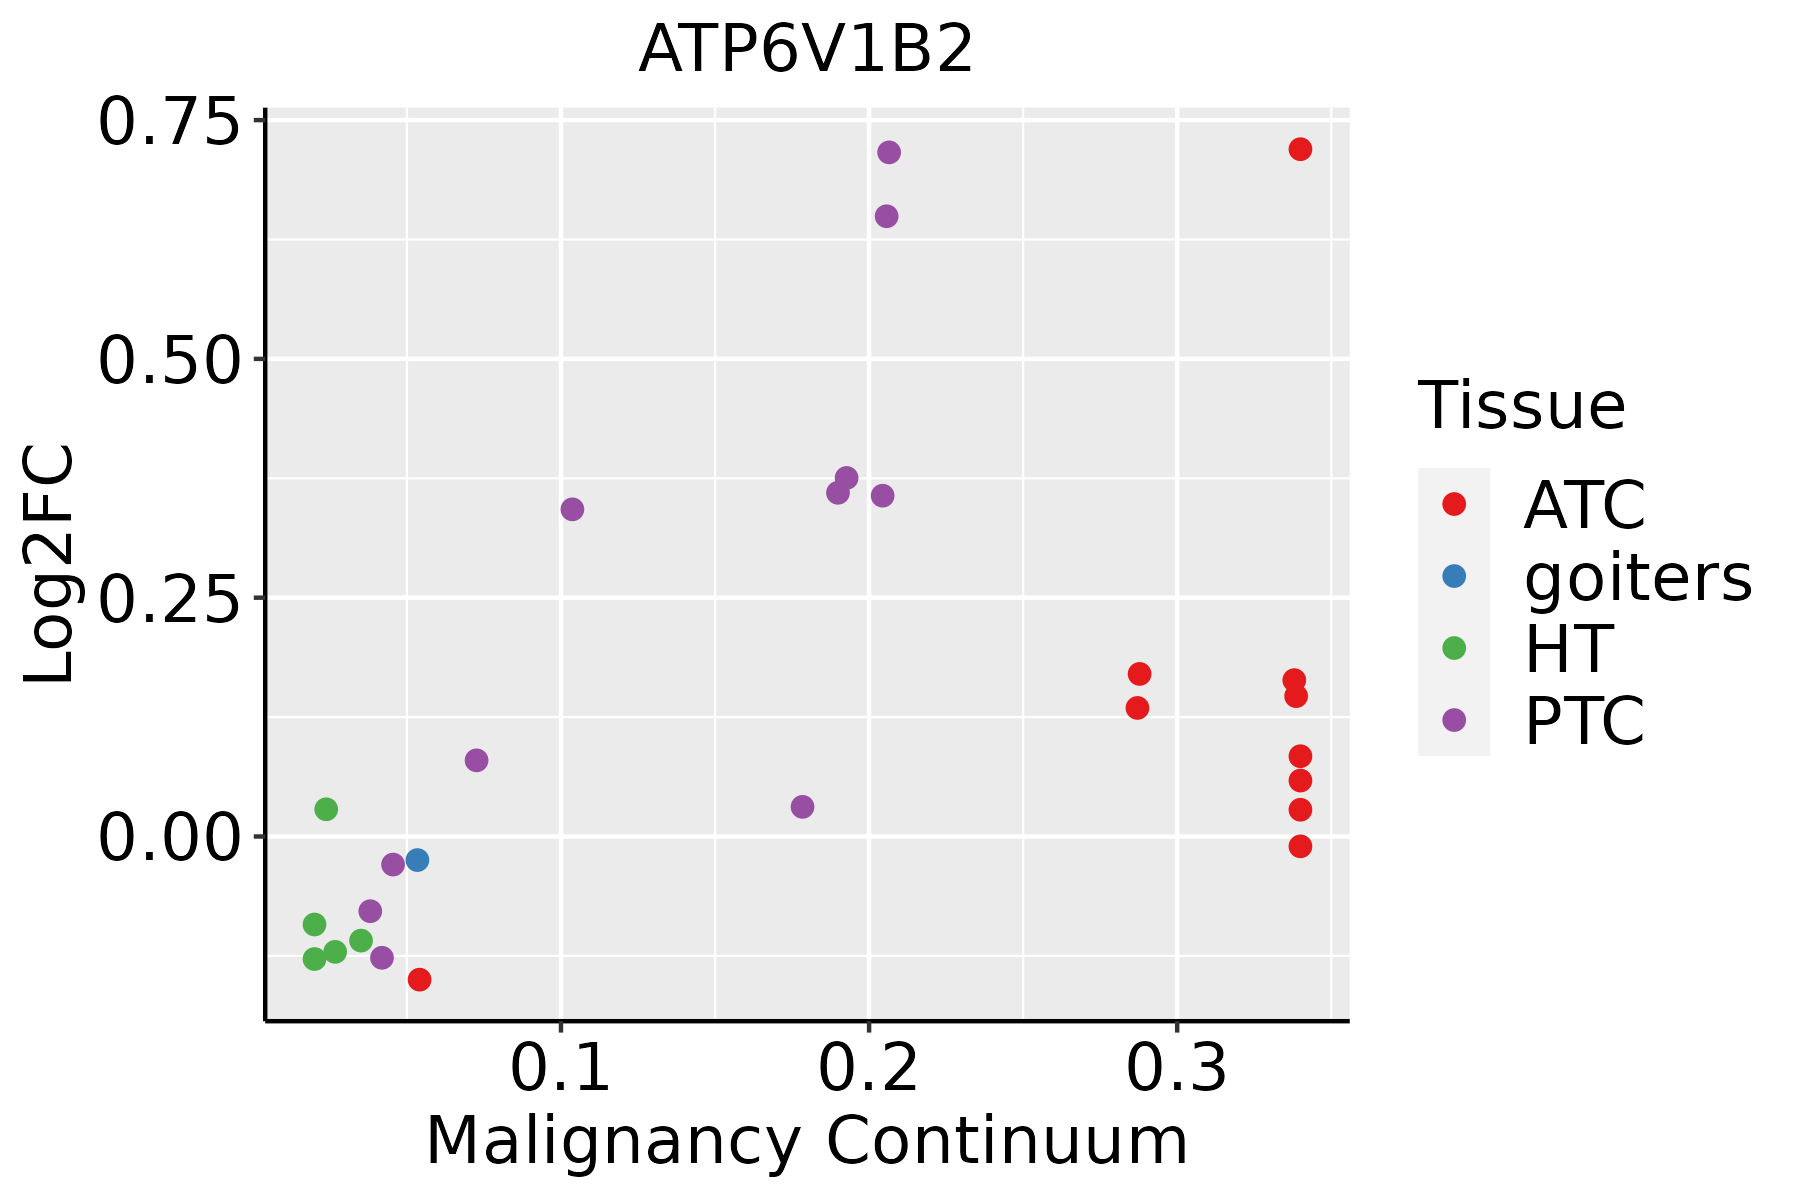 | ATC: Anaplastic thyroid cancer |
| HT: Hashimoto's thyroiditis | ||
| PTC: Papillary thyroid cancer |
| ∗log2FC in expression of this searched gene in stem-like cells from each diseased tissue sample relative to stem-like cells in normal samples in each tissue plotted against the malignancy continuum. Samples are colored based on if they are from different disease stage. |
Top |
Malignant transformation related pathway analysis |
| Find out the enriched GO biological processes and KEGG pathways involved in transition from healthy to precancer to cancer |
| Tissue | Disease Stage | Enriched GO biological Processes |
| Colorectum | AD |  |
| Colorectum | SER |  |
| Colorectum | MSS |  |
| Colorectum | MSI-H |  |
| Colorectum | FAP |  |
| ∗Top 15 enriched GO BP terms are showed in the bar plot of each disease state in each tissue. Each row represents a significant GO biological process which is colored according to the -log10(p.adjust). |
| Page: 1 2 3 4 5 6 7 8 9 |
| GO ID | Tissue | Disease Stage | Description | Gene Ratio | Bg Ratio | pvalue | p.adjust | Count |
| GO:0046034 | Colorectum | AD | ATP metabolic process | 142/3918 | 277/18723 | 2.64e-29 | 8.26e-26 | 142 |
| GO:1902600 | Colorectum | AD | proton transmembrane transport | 66/3918 | 157/18723 | 1.59e-09 | 1.17e-07 | 66 |
| GO:0010506 | Colorectum | AD | regulation of autophagy | 111/3918 | 317/18723 | 3.57e-09 | 2.35e-07 | 111 |
| GO:0016236 | Colorectum | AD | macroautophagy | 103/3918 | 291/18723 | 6.76e-09 | 4.15e-07 | 103 |
| GO:0016241 | Colorectum | AD | regulation of macroautophagy | 50/3918 | 141/18723 | 4.55e-05 | 7.92e-04 | 50 |
| GO:00460342 | Colorectum | MSS | ATP metabolic process | 125/3467 | 277/18723 | 1.38e-24 | 2.15e-21 | 125 |
| GO:00162362 | Colorectum | MSS | macroautophagy | 93/3467 | 291/18723 | 2.08e-08 | 1.17e-06 | 93 |
| GO:19026002 | Colorectum | MSS | proton transmembrane transport | 57/3467 | 157/18723 | 1.00e-07 | 4.81e-06 | 57 |
| GO:00105062 | Colorectum | MSS | regulation of autophagy | 95/3467 | 317/18723 | 4.36e-07 | 1.71e-05 | 95 |
| GO:00162412 | Colorectum | MSS | regulation of macroautophagy | 44/3467 | 141/18723 | 1.88e-04 | 2.64e-03 | 44 |
| GO:00460343 | Colorectum | MSI-H | ATP metabolic process | 71/1319 | 277/18723 | 3.18e-22 | 8.32e-19 | 71 |
| GO:19026003 | Colorectum | MSI-H | proton transmembrane transport | 29/1319 | 157/18723 | 1.49e-06 | 9.75e-05 | 29 |
| GO:001623617 | Esophagus | ESCC | macroautophagy | 216/8552 | 291/18723 | 1.94e-23 | 4.57e-21 | 216 |
| GO:001050617 | Esophagus | ESCC | regulation of autophagy | 220/8552 | 317/18723 | 6.72e-18 | 6.36e-16 | 220 |
| GO:0046034111 | Esophagus | ESCC | ATP metabolic process | 189/8552 | 277/18723 | 1.99e-14 | 1.04e-12 | 189 |
| GO:001624114 | Esophagus | ESCC | regulation of macroautophagy | 102/8552 | 141/18723 | 1.09e-10 | 3.27e-09 | 102 |
| GO:190260018 | Esophagus | ESCC | proton transmembrane transport | 88/8552 | 157/18723 | 5.62e-03 | 2.10e-02 | 88 |
| GO:001623610 | Oral cavity | OSCC | macroautophagy | 192/7305 | 291/18723 | 7.01e-21 | 1.14e-18 | 192 |
| GO:001050610 | Oral cavity | OSCC | regulation of autophagy | 198/7305 | 317/18723 | 1.63e-17 | 1.51e-15 | 198 |
| GO:004603420 | Oral cavity | OSCC | ATP metabolic process | 166/7305 | 277/18723 | 1.16e-12 | 5.12e-11 | 166 |
| Page: 1 2 |
| Pathway ID | Tissue | Disease Stage | Description | Gene Ratio | Bg Ratio | pvalue | p.adjust | qvalue | Count |
| hsa00190 | Colorectum | AD | Oxidative phosphorylation | 86/2092 | 134/8465 | 2.47e-22 | 2.76e-20 | 1.76e-20 | 86 |
| hsa05110 | Colorectum | AD | Vibrio cholerae infection | 29/2092 | 50/8465 | 5.10e-07 | 7.12e-06 | 4.54e-06 | 29 |
| hsa001901 | Colorectum | AD | Oxidative phosphorylation | 86/2092 | 134/8465 | 2.47e-22 | 2.76e-20 | 1.76e-20 | 86 |
| hsa051101 | Colorectum | AD | Vibrio cholerae infection | 29/2092 | 50/8465 | 5.10e-07 | 7.12e-06 | 4.54e-06 | 29 |
| hsa001904 | Colorectum | MSS | Oxidative phosphorylation | 79/1875 | 134/8465 | 1.89e-20 | 7.90e-19 | 4.84e-19 | 79 |
| hsa051104 | Colorectum | MSS | Vibrio cholerae infection | 27/1875 | 50/8465 | 8.58e-07 | 1.20e-05 | 7.34e-06 | 27 |
| hsa04150 | Colorectum | MSS | mTOR signaling pathway | 47/1875 | 156/8465 | 1.19e-02 | 3.99e-02 | 2.44e-02 | 47 |
| hsa001905 | Colorectum | MSS | Oxidative phosphorylation | 79/1875 | 134/8465 | 1.89e-20 | 7.90e-19 | 4.84e-19 | 79 |
| hsa051105 | Colorectum | MSS | Vibrio cholerae infection | 27/1875 | 50/8465 | 8.58e-07 | 1.20e-05 | 7.34e-06 | 27 |
| hsa041501 | Colorectum | MSS | mTOR signaling pathway | 47/1875 | 156/8465 | 1.19e-02 | 3.99e-02 | 2.44e-02 | 47 |
| hsa001906 | Colorectum | MSI-H | Oxidative phosphorylation | 47/797 | 134/8465 | 2.13e-16 | 6.27e-15 | 5.26e-15 | 47 |
| hsa051106 | Colorectum | MSI-H | Vibrio cholerae infection | 18/797 | 50/8465 | 2.77e-07 | 5.61e-06 | 4.70e-06 | 18 |
| hsa04145 | Colorectum | MSI-H | Phagosome | 27/797 | 152/8465 | 8.74e-04 | 1.01e-02 | 8.48e-03 | 27 |
| hsa001907 | Colorectum | MSI-H | Oxidative phosphorylation | 47/797 | 134/8465 | 2.13e-16 | 6.27e-15 | 5.26e-15 | 47 |
| hsa051107 | Colorectum | MSI-H | Vibrio cholerae infection | 18/797 | 50/8465 | 2.77e-07 | 5.61e-06 | 4.70e-06 | 18 |
| hsa041451 | Colorectum | MSI-H | Phagosome | 27/797 | 152/8465 | 8.74e-04 | 1.01e-02 | 8.48e-03 | 27 |
| hsa00190210 | Esophagus | ESCC | Oxidative phosphorylation | 104/4205 | 134/8465 | 2.04e-11 | 2.98e-10 | 1.53e-10 | 104 |
| hsa0516510 | Esophagus | ESCC | Human papillomavirus infection | 215/4205 | 331/8465 | 7.86e-09 | 7.12e-08 | 3.65e-08 | 215 |
| hsa0512018 | Esophagus | ESCC | Epithelial cell signaling in Helicobacter pylori infection | 52/4205 | 70/8465 | 2.17e-05 | 1.07e-04 | 5.47e-05 | 52 |
| hsa0414530 | Esophagus | ESCC | Phagosome | 100/4205 | 152/8465 | 3.81e-05 | 1.72e-04 | 8.82e-05 | 100 |
| Page: 1 2 3 |
Top |
Cell-cell communication analysis |
| Identification of potential cell-cell interactions between two cell types and their ligand-receptor pairs for different disease states |
| Ligand | Receptor | LRpair | Pathway | Tissue | Disease Stage |
| Page: 1 |
Top |
Single-cell gene regulatory network inference analysis |
| Find out the significant the regulons (TFs) and the target genes of each regulon across cell types for different disease states |
| TF | Cell Type | Tissue | Disease Stage | Target Gene | RSS | Regulon Activity |
| ∗The dot plots of a searched regulon are shown for all cell subpopulations in each disease state of each tissue based on the regulon specific score inferred using pySCENIC and by calculating the average expression. |
| Page: 1 |
Top |
Somatic mutation of malignant transformation related genes |
| Annotation of somatic variants for genes involved in malignant transformation |
| Hugo Symbol | Variant Class | Variant Classification | dbSNP RS | HGVSc | HGVSp | HGVSp Short | SWISSPROT | BIOTYPE | SIFT | PolyPhen | Tumor Sample Barcode | Tissue | Histology | Sex | Age | Stage | Therapy Types | Drugs | Outcome |
| ATP6V1B2 | SNV | Missense_Mutation | novel | c.445N>T | p.Asp149Tyr | p.D149Y | P21281 | protein_coding | deleterious(0) | possibly_damaging(0.873) | TCGA-AN-A046-01 | Breast | breast invasive carcinoma | Female | >=65 | I/II | Unknown | Unknown | SD |
| ATP6V1B2 | SNV | Missense_Mutation | novel | c.1504N>A | p.Glu502Lys | p.E502K | P21281 | protein_coding | tolerated(0.84) | benign(0.021) | TCGA-AN-A046-01 | Breast | breast invasive carcinoma | Female | >=65 | I/II | Unknown | Unknown | SD |
| ATP6V1B2 | SNV | Missense_Mutation | novel | c.194N>G | p.Phe65Cys | p.F65C | P21281 | protein_coding | tolerated(0.17) | benign(0.114) | TCGA-2W-A8YY-01 | Cervix | cervical & endocervical cancer | Female | <65 | I/II | Chemotherapy | cisplatin | CR |
| ATP6V1B2 | SNV | Missense_Mutation | rs776545761 | c.1012N>A | p.Ala338Thr | p.A338T | P21281 | protein_coding | deleterious(0) | probably_damaging(0.992) | TCGA-AA-3713-01 | Colorectum | colon adenocarcinoma | Male | >=65 | III/IV | Chemotherapy | 5-fluorouracil | PR |
| ATP6V1B2 | SNV | Missense_Mutation | c.243N>C | p.Lys81Asn | p.K81N | P21281 | protein_coding | tolerated(0.17) | benign(0.003) | TCGA-AZ-4614-01 | Colorectum | colon adenocarcinoma | Female | >=65 | I/II | Unknown | Unknown | PD | |
| ATP6V1B2 | SNV | Missense_Mutation | c.962N>A | p.Arg321Gln | p.R321Q | P21281 | protein_coding | deleterious(0.04) | possibly_damaging(0.663) | TCGA-CM-4744-01 | Colorectum | colon adenocarcinoma | Male | >=65 | I/II | Unknown | Unknown | SD | |
| ATP6V1B2 | SNV | Missense_Mutation | c.970C>T | p.Pro324Ser | p.P324S | P21281 | protein_coding | deleterious(0) | probably_damaging(0.998) | TCGA-G5-6572-02 | Colorectum | NA | NA | NA | NA | NA | NA | NA | |
| ATP6V1B2 | SNV | Missense_Mutation | novel | c.545G>T | p.Ser182Ile | p.S182I | P21281 | protein_coding | deleterious(0) | probably_damaging(0.998) | TCGA-A5-A0G2-01 | Endometrium | uterine corpus endometrioid carcinoma | Female | <65 | III/IV | Unknown | Unknown | SD |
| ATP6V1B2 | SNV | Missense_Mutation | novel | c.160A>G | p.Asn54Asp | p.N54D | P21281 | protein_coding | tolerated(0.07) | benign(0.114) | TCGA-AJ-A2QO-01 | Endometrium | uterine corpus endometrioid carcinoma | Female | >=65 | I/II | Unknown | Unknown | SD |
| ATP6V1B2 | SNV | Missense_Mutation | rs577956380 | c.1412N>A | p.Arg471His | p.R471H | P21281 | protein_coding | deleterious(0.03) | possibly_damaging(0.892) | TCGA-AJ-A3BH-01 | Endometrium | uterine corpus endometrioid carcinoma | Female | Unknown | I/II | Unknown | Unknown | SD |
| Page: 1 2 3 4 5 6 |
Top |
Related drugs of malignant transformation related genes |
| Identification of chemicals and drugs interact with genes involved in malignant transfromation |
| (DGIdb 4.0) |
| Entrez ID | Symbol | Category | Interaction Types | Drug Claim Name | Drug Name | PMIDs |
| 526 | ATP6V1B2 | ENZYME, TRANSPORTER | inhibitor | 252827539 | ENOXACIN |
| Page: 1 |

Copyright 2023-Present -The University of Texas Health Science Center at Houston |