
|
|||||
|
 | |
| |
| |
| |
| |
| |
|
Gene: ATP6V1A |
Gene summary for ATP6V1A |
| Gene information | Species | Human | Gene symbol | ATP6V1A | Gene ID | 523 |
| Gene name | ATPase H+ transporting V1 subunit A | |
| Gene Alias | ARCL2D | |
| Cytomap | 3q13.31 | |
| Gene Type | protein-coding | GO ID | GO:0006139 | UniProtAcc | P38606 |
Top |
Malignant transformation analysis |
| Identification of the aberrant gene expression in precancerous and cancerous lesions by comparing the gene expression of stem-like cells in diseased tissues with normal stem cells |
| Entrez ID | Symbol | Replicates | Species | Organ | Tissue | Adj P-value | Log2FC | Malignancy |
| 523 | ATP6V1A | HTA11_347_2000001011 | Human | Colorectum | AD | 7.72e-14 | 5.86e-01 | -0.1954 |
| 523 | ATP6V1A | HTA11_99999965104_69814 | Human | Colorectum | MSS | 9.98e-04 | 4.49e-01 | 0.281 |
| 523 | ATP6V1A | F007 | Human | Colorectum | FAP | 3.34e-02 | -2.86e-01 | 0.1176 |
| 523 | ATP6V1A | A015-C-203 | Human | Colorectum | FAP | 4.14e-11 | -2.98e-01 | -0.1294 |
| 523 | ATP6V1A | A015-C-204 | Human | Colorectum | FAP | 1.61e-02 | -2.54e-01 | -0.0228 |
| 523 | ATP6V1A | A002-C-201 | Human | Colorectum | FAP | 4.00e-05 | -2.35e-01 | 0.0324 |
| 523 | ATP6V1A | A002-C-203 | Human | Colorectum | FAP | 2.36e-02 | -1.73e-01 | 0.2786 |
| 523 | ATP6V1A | A001-C-119 | Human | Colorectum | FAP | 3.18e-02 | -2.46e-01 | -0.1557 |
| 523 | ATP6V1A | A001-C-108 | Human | Colorectum | FAP | 5.52e-11 | -3.30e-01 | -0.0272 |
| 523 | ATP6V1A | A002-C-205 | Human | Colorectum | FAP | 1.53e-08 | -2.85e-01 | -0.1236 |
| 523 | ATP6V1A | A015-C-005 | Human | Colorectum | FAP | 9.74e-03 | -2.61e-01 | -0.0336 |
| 523 | ATP6V1A | A015-C-006 | Human | Colorectum | FAP | 3.69e-10 | -4.04e-01 | -0.0994 |
| 523 | ATP6V1A | A015-C-106 | Human | Colorectum | FAP | 1.32e-05 | -2.88e-01 | -0.0511 |
| 523 | ATP6V1A | A002-C-114 | Human | Colorectum | FAP | 5.43e-07 | -3.08e-01 | -0.1561 |
| 523 | ATP6V1A | A015-C-104 | Human | Colorectum | FAP | 3.17e-14 | -3.24e-01 | -0.1899 |
| 523 | ATP6V1A | A001-C-014 | Human | Colorectum | FAP | 2.01e-05 | -2.68e-01 | 0.0135 |
| 523 | ATP6V1A | A002-C-016 | Human | Colorectum | FAP | 3.32e-08 | -2.64e-01 | 0.0521 |
| 523 | ATP6V1A | A015-C-002 | Human | Colorectum | FAP | 1.13e-04 | -3.27e-01 | -0.0763 |
| 523 | ATP6V1A | A001-C-203 | Human | Colorectum | FAP | 5.36e-05 | -2.79e-01 | -0.0481 |
| 523 | ATP6V1A | A002-C-116 | Human | Colorectum | FAP | 1.78e-10 | -2.70e-01 | -0.0452 |
| Page: 1 2 3 4 5 6 7 |
| Tissue | Expression Dynamics | Abbreviation |
| Colorectum (GSE201348) |  | FAP: Familial adenomatous polyposis |
| CRC: Colorectal cancer | ||
| Colorectum (HTA11) |  | AD: Adenomas |
| SER: Sessile serrated lesions | ||
| MSI-H: Microsatellite-high colorectal cancer | ||
| MSS: Microsatellite stable colorectal cancer | ||
| Esophagus | 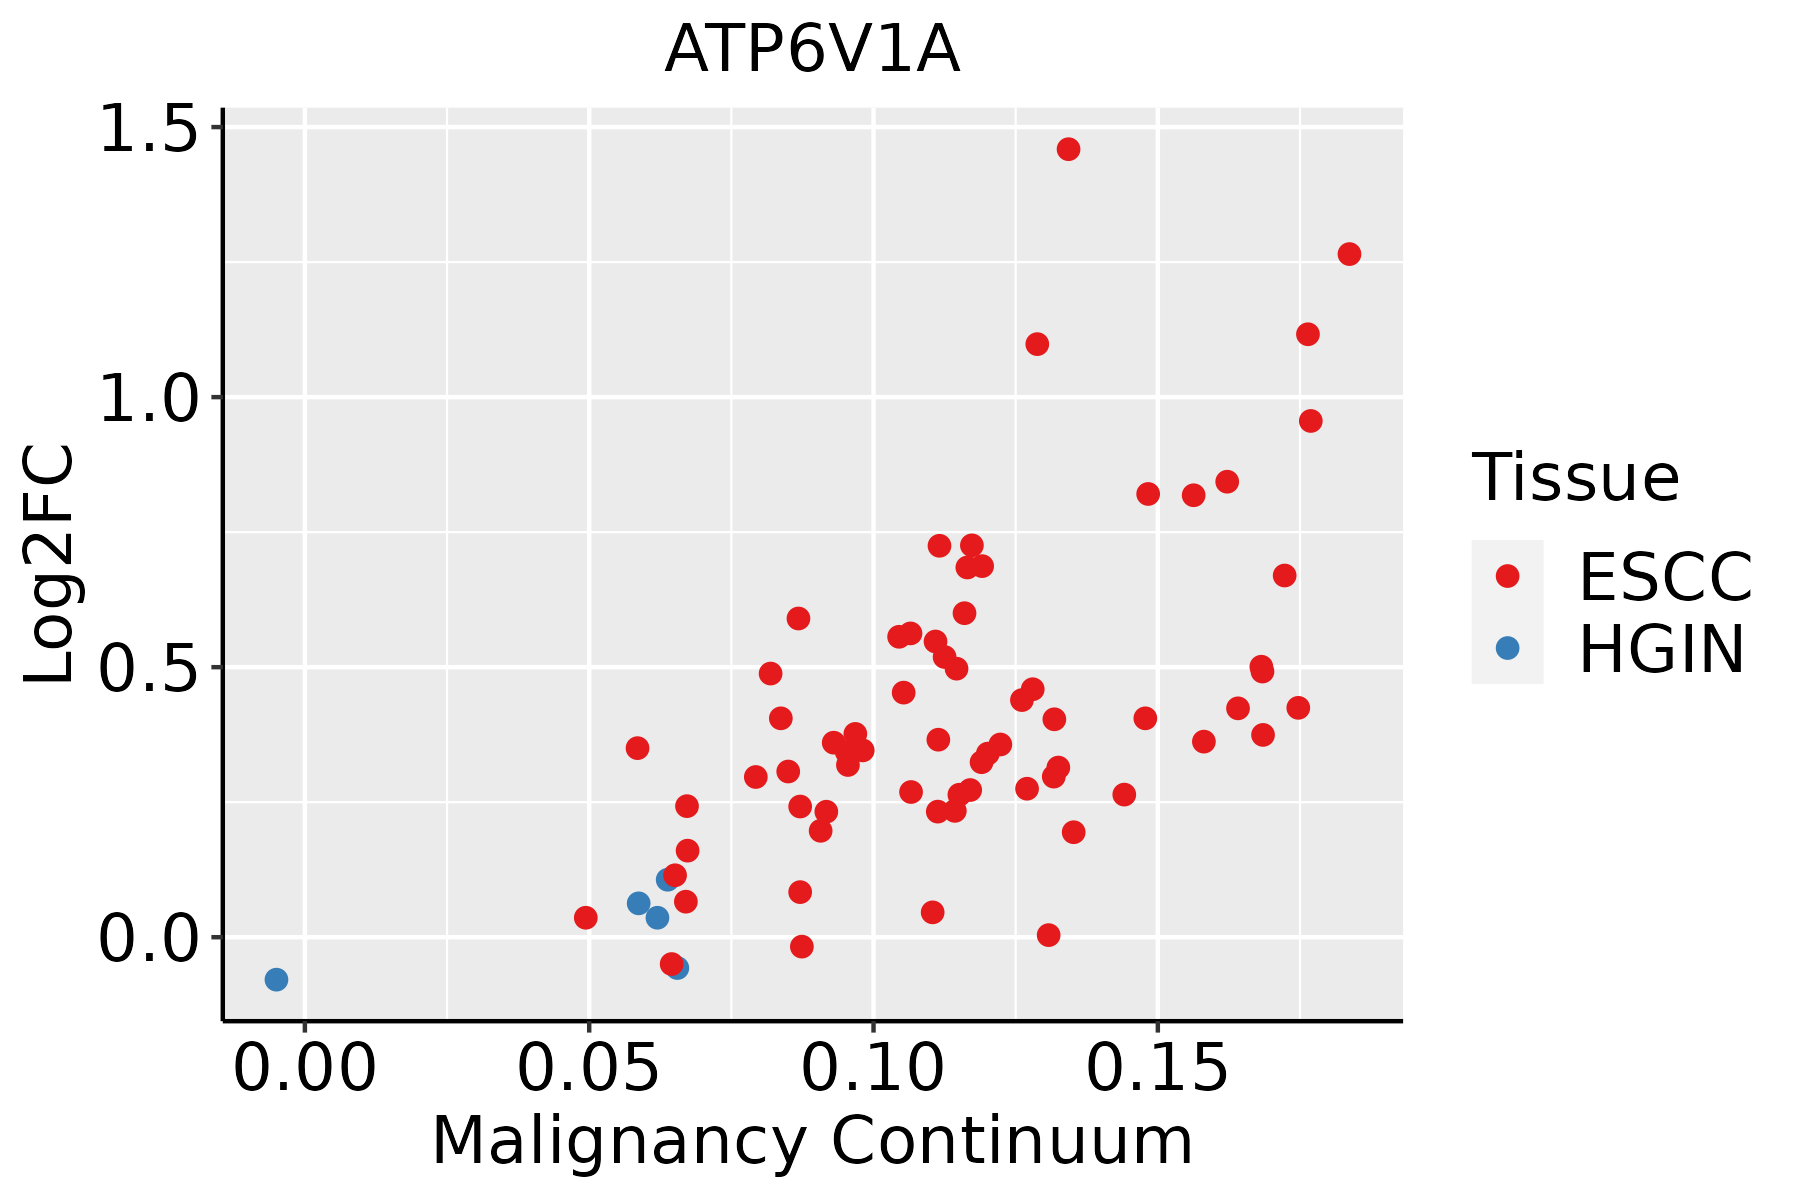 | ESCC: Esophageal squamous cell carcinoma |
| HGIN: High-grade intraepithelial neoplasias | ||
| LGIN: Low-grade intraepithelial neoplasias | ||
| Liver | 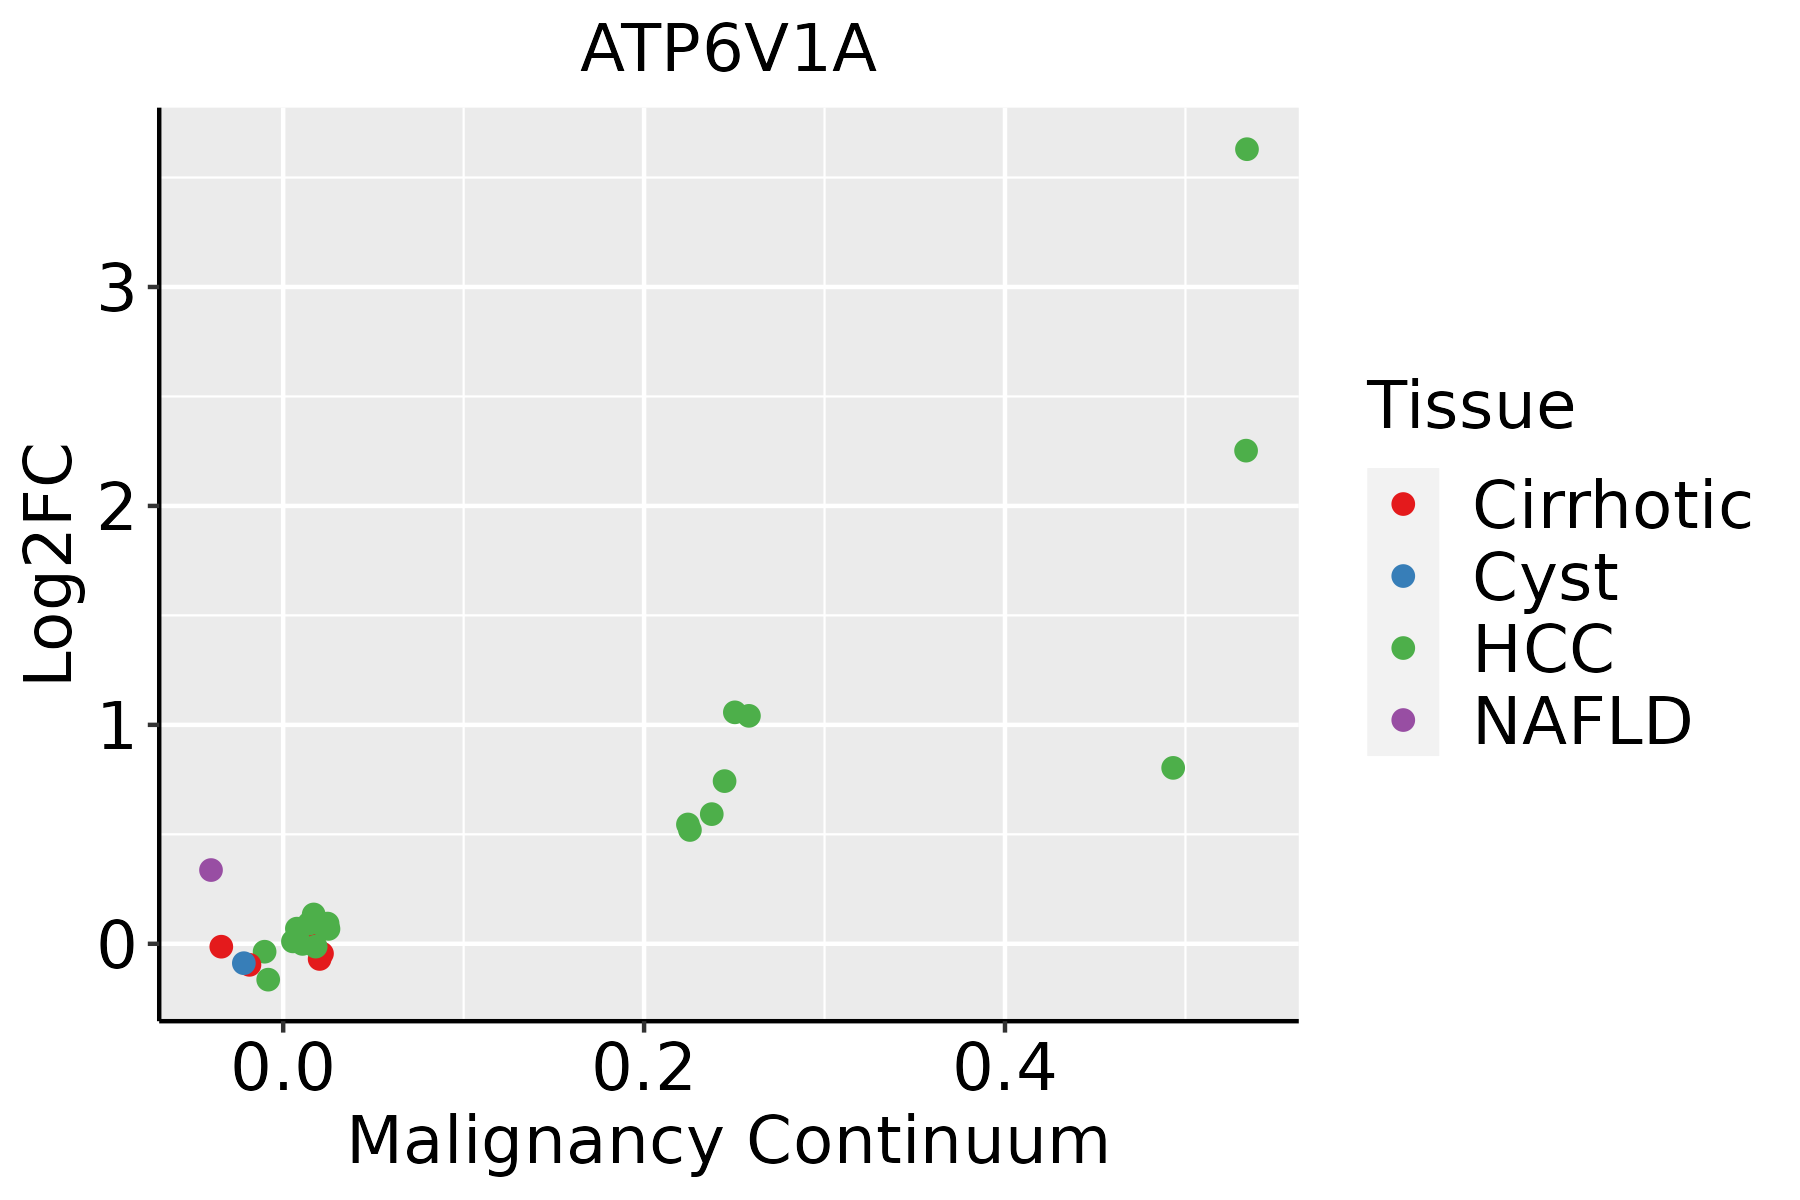 | HCC: Hepatocellular carcinoma |
| NAFLD: Non-alcoholic fatty liver disease | ||
| Oral Cavity | 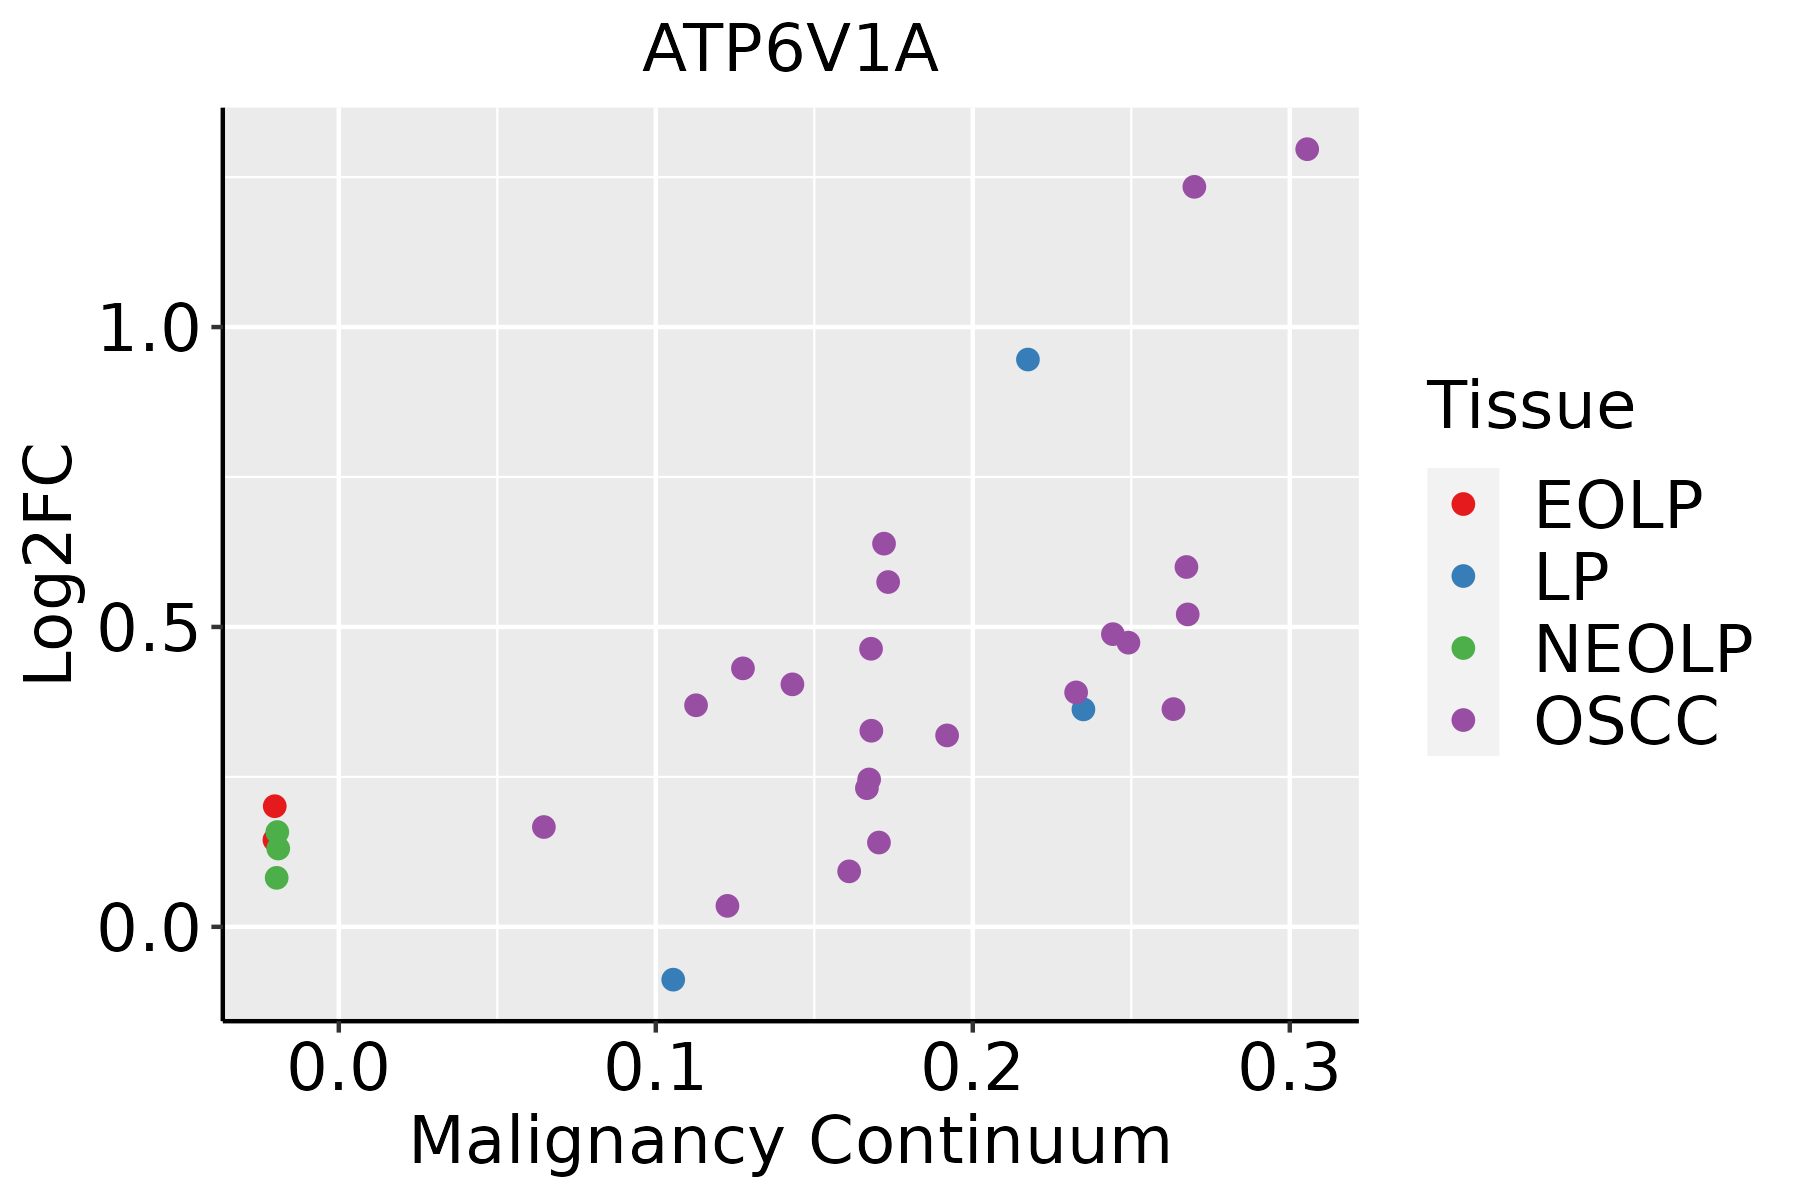 | EOLP: Erosive Oral lichen planus |
| LP: leukoplakia | ||
| NEOLP: Non-erosive oral lichen planus | ||
| OSCC: Oral squamous cell carcinoma | ||
| Skin | 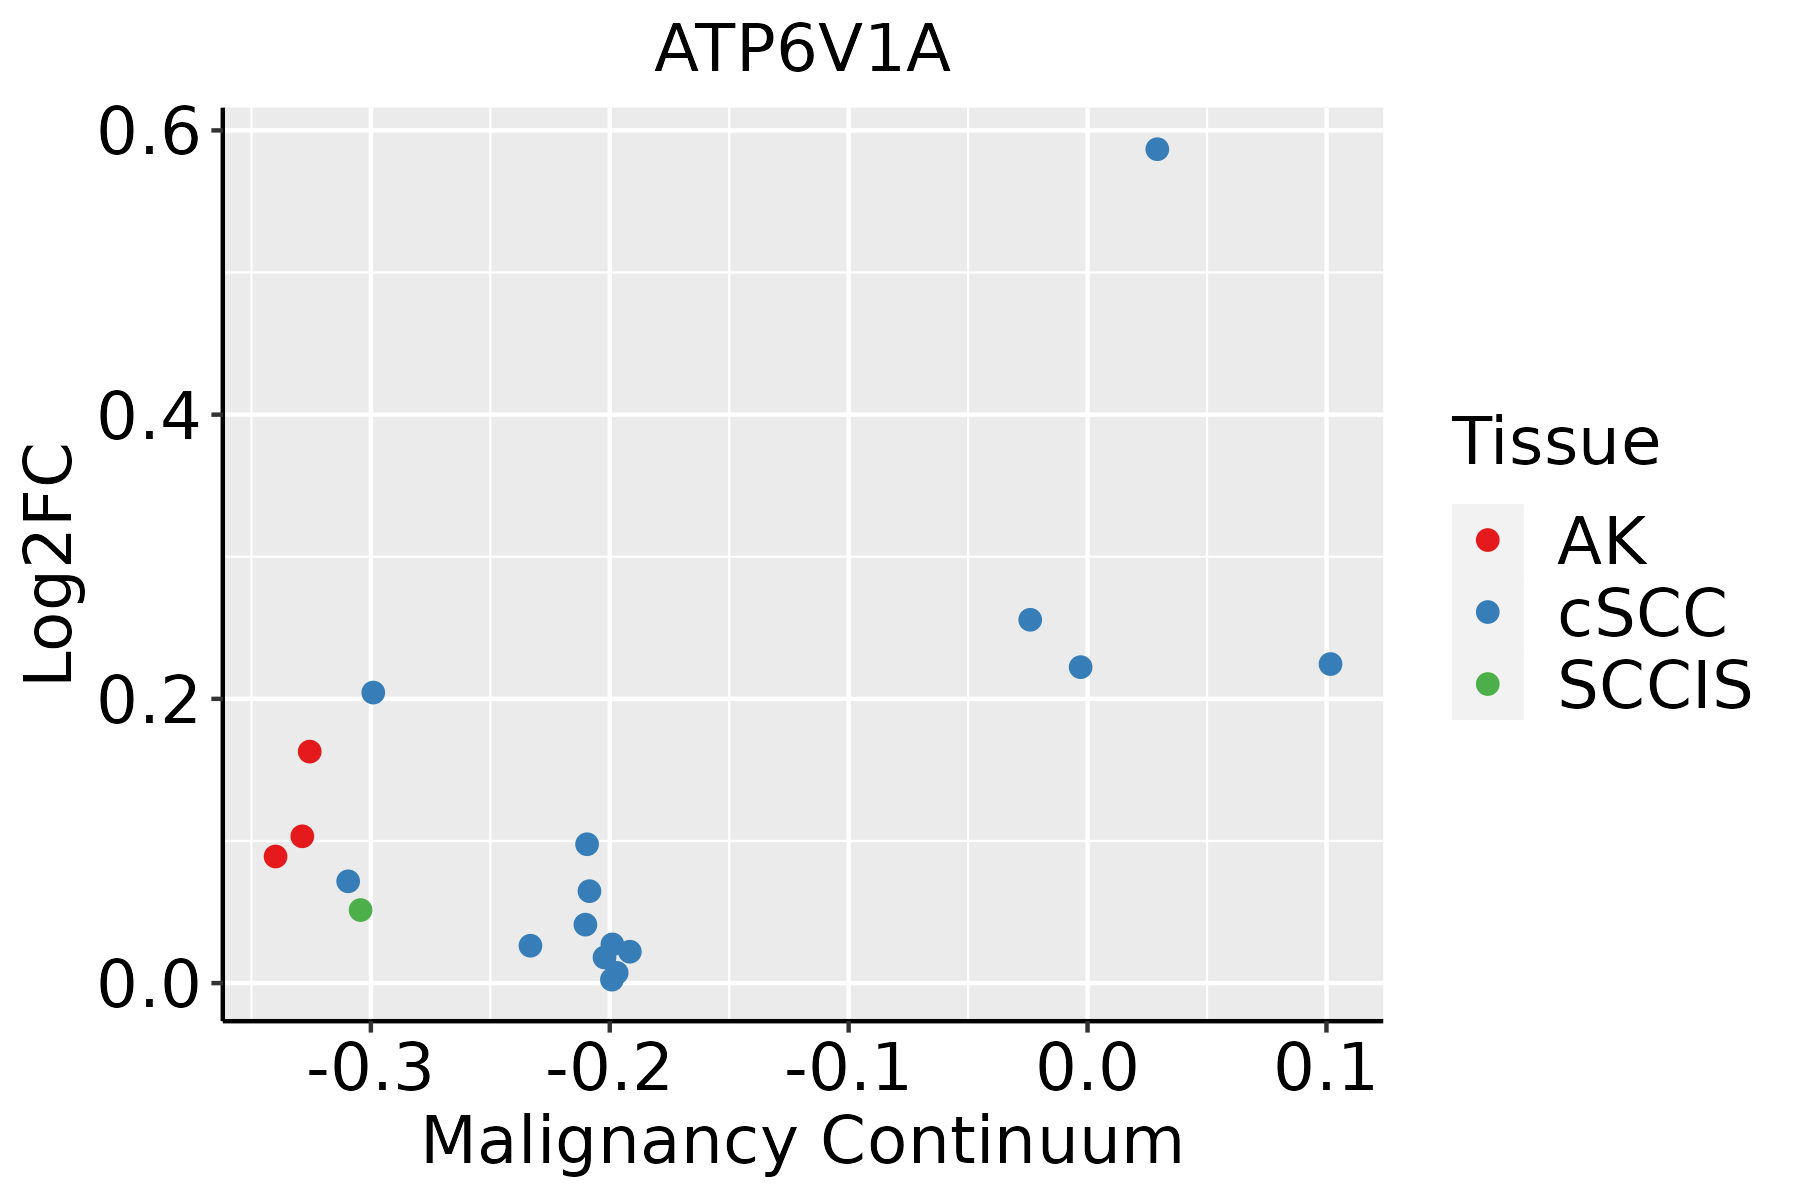 | AK: Actinic keratosis |
| cSCC: Cutaneous squamous cell carcinoma | ||
| SCCIS:squamous cell carcinoma in situ | ||
| Thyroid | 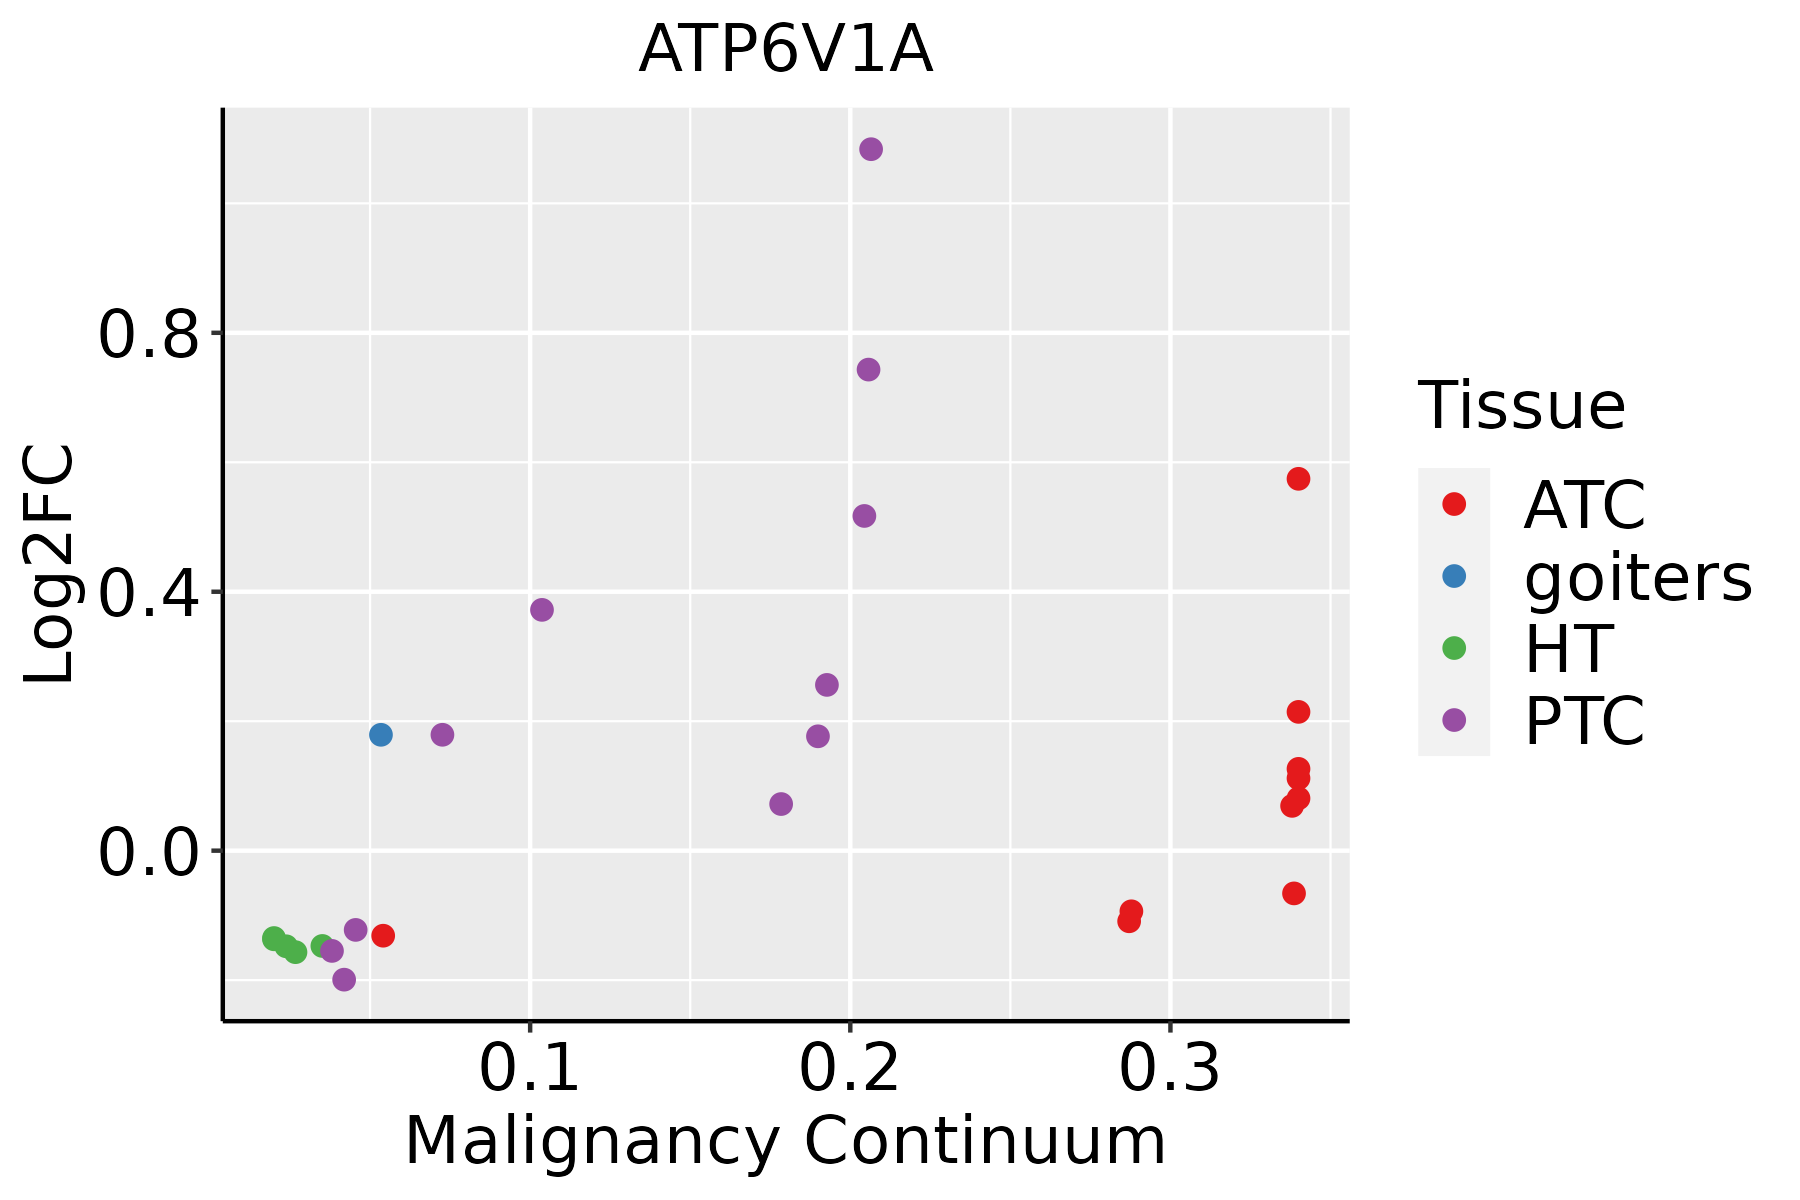 | ATC: Anaplastic thyroid cancer |
| HT: Hashimoto's thyroiditis | ||
| PTC: Papillary thyroid cancer |
| ∗log2FC in expression of this searched gene in stem-like cells from each diseased tissue sample relative to stem-like cells in normal samples in each tissue plotted against the malignancy continuum. Samples are colored based on if they are from different disease stage. |
Top |
Malignant transformation related pathway analysis |
| Find out the enriched GO biological processes and KEGG pathways involved in transition from healthy to precancer to cancer |
| Tissue | Disease Stage | Enriched GO biological Processes |
| Colorectum | AD |  |
| Colorectum | SER |  |
| Colorectum | MSS |  |
| Colorectum | MSI-H |  |
| Colorectum | FAP |  |
| ∗Top 15 enriched GO BP terms are showed in the bar plot of each disease state in each tissue. Each row represents a significant GO biological process which is colored according to the -log10(p.adjust). |
| Page: 1 2 3 4 5 6 7 8 9 |
| GO ID | Tissue | Disease Stage | Description | Gene Ratio | Bg Ratio | pvalue | p.adjust | Count |
| GO:0046034 | Colorectum | AD | ATP metabolic process | 142/3918 | 277/18723 | 2.64e-29 | 8.26e-26 | 142 |
| GO:0009150 | Colorectum | AD | purine ribonucleotide metabolic process | 142/3918 | 368/18723 | 4.29e-15 | 1.17e-12 | 142 |
| GO:0006163 | Colorectum | AD | purine nucleotide metabolic process | 149/3918 | 396/18723 | 1.08e-14 | 2.80e-12 | 149 |
| GO:0072521 | Colorectum | AD | purine-containing compound metabolic process | 153/3918 | 416/18723 | 4.34e-14 | 1.01e-11 | 153 |
| GO:0009259 | Colorectum | AD | ribonucleotide metabolic process | 144/3918 | 385/18723 | 5.25e-14 | 1.13e-11 | 144 |
| GO:0019693 | Colorectum | AD | ribose phosphate metabolic process | 145/3918 | 396/18723 | 3.01e-13 | 5.71e-11 | 145 |
| GO:0009117 | Colorectum | AD | nucleotide metabolic process | 168/3918 | 489/18723 | 2.20e-12 | 3.36e-10 | 168 |
| GO:0006753 | Colorectum | AD | nucleoside phosphate metabolic process | 169/3918 | 497/18723 | 4.99e-12 | 6.98e-10 | 169 |
| GO:1902600 | Colorectum | AD | proton transmembrane transport | 66/3918 | 157/18723 | 1.59e-09 | 1.17e-07 | 66 |
| GO:0010506 | Colorectum | AD | regulation of autophagy | 111/3918 | 317/18723 | 3.57e-09 | 2.35e-07 | 111 |
| GO:0009144 | Colorectum | AD | purine nucleoside triphosphate metabolic process | 43/3918 | 88/18723 | 5.05e-09 | 3.19e-07 | 43 |
| GO:0016236 | Colorectum | AD | macroautophagy | 103/3918 | 291/18723 | 6.76e-09 | 4.15e-07 | 103 |
| GO:0009205 | Colorectum | AD | purine ribonucleoside triphosphate metabolic process | 39/3918 | 82/18723 | 6.58e-08 | 3.40e-06 | 39 |
| GO:0009141 | Colorectum | AD | nucleoside triphosphate metabolic process | 48/3918 | 112/18723 | 1.27e-07 | 6.02e-06 | 48 |
| GO:0006754 | Colorectum | AD | ATP biosynthetic process | 30/3918 | 57/18723 | 1.27e-07 | 6.02e-06 | 30 |
| GO:0009145 | Colorectum | AD | purine nucleoside triphosphate biosynthetic process | 34/3918 | 69/18723 | 1.54e-07 | 6.78e-06 | 34 |
| GO:0015985 | Colorectum | AD | energy coupled proton transport, down electrochemical gradient | 18/3918 | 26/18723 | 1.55e-07 | 6.78e-06 | 18 |
| GO:0015986 | Colorectum | AD | ATP synthesis coupled proton transport | 18/3918 | 26/18723 | 1.55e-07 | 6.78e-06 | 18 |
| GO:0009199 | Colorectum | AD | ribonucleoside triphosphate metabolic process | 40/3918 | 89/18723 | 3.04e-07 | 1.21e-05 | 40 |
| GO:0009152 | Colorectum | AD | purine ribonucleotide biosynthetic process | 64/3918 | 169/18723 | 3.09e-07 | 1.22e-05 | 64 |
| Page: 1 2 3 4 5 6 7 8 9 10 11 12 13 14 15 16 17 18 19 |
| Pathway ID | Tissue | Disease Stage | Description | Gene Ratio | Bg Ratio | pvalue | p.adjust | qvalue | Count |
| hsa00190 | Colorectum | AD | Oxidative phosphorylation | 86/2092 | 134/8465 | 2.47e-22 | 2.76e-20 | 1.76e-20 | 86 |
| hsa001901 | Colorectum | AD | Oxidative phosphorylation | 86/2092 | 134/8465 | 2.47e-22 | 2.76e-20 | 1.76e-20 | 86 |
| hsa001904 | Colorectum | MSS | Oxidative phosphorylation | 79/1875 | 134/8465 | 1.89e-20 | 7.90e-19 | 4.84e-19 | 79 |
| hsa051104 | Colorectum | MSS | Vibrio cholerae infection | 27/1875 | 50/8465 | 8.58e-07 | 1.20e-05 | 7.34e-06 | 27 |
| hsa04150 | Colorectum | MSS | mTOR signaling pathway | 47/1875 | 156/8465 | 1.19e-02 | 3.99e-02 | 2.44e-02 | 47 |
| hsa001905 | Colorectum | MSS | Oxidative phosphorylation | 79/1875 | 134/8465 | 1.89e-20 | 7.90e-19 | 4.84e-19 | 79 |
| hsa051105 | Colorectum | MSS | Vibrio cholerae infection | 27/1875 | 50/8465 | 8.58e-07 | 1.20e-05 | 7.34e-06 | 27 |
| hsa041501 | Colorectum | MSS | mTOR signaling pathway | 47/1875 | 156/8465 | 1.19e-02 | 3.99e-02 | 2.44e-02 | 47 |
| hsa001908 | Colorectum | FAP | Oxidative phosphorylation | 44/1404 | 134/8465 | 2.56e-06 | 4.28e-05 | 2.60e-05 | 44 |
| hsa051108 | Colorectum | FAP | Vibrio cholerae infection | 19/1404 | 50/8465 | 2.24e-04 | 1.92e-03 | 1.17e-03 | 19 |
| hsa001909 | Colorectum | FAP | Oxidative phosphorylation | 44/1404 | 134/8465 | 2.56e-06 | 4.28e-05 | 2.60e-05 | 44 |
| hsa051109 | Colorectum | FAP | Vibrio cholerae infection | 19/1404 | 50/8465 | 2.24e-04 | 1.92e-03 | 1.17e-03 | 19 |
| hsa00190210 | Esophagus | ESCC | Oxidative phosphorylation | 104/4205 | 134/8465 | 2.04e-11 | 2.98e-10 | 1.53e-10 | 104 |
| hsa0516510 | Esophagus | ESCC | Human papillomavirus infection | 215/4205 | 331/8465 | 7.86e-09 | 7.12e-08 | 3.65e-08 | 215 |
| hsa0512018 | Esophagus | ESCC | Epithelial cell signaling in Helicobacter pylori infection | 52/4205 | 70/8465 | 2.17e-05 | 1.07e-04 | 5.47e-05 | 52 |
| hsa0414530 | Esophagus | ESCC | Phagosome | 100/4205 | 152/8465 | 3.81e-05 | 1.72e-04 | 8.82e-05 | 100 |
| hsa041505 | Esophagus | ESCC | mTOR signaling pathway | 98/4205 | 156/8465 | 5.81e-04 | 1.95e-03 | 9.97e-04 | 98 |
| hsa0532320 | Esophagus | ESCC | Rheumatoid arthritis | 59/4205 | 93/8465 | 4.98e-03 | 1.27e-02 | 6.52e-03 | 59 |
| hsa0511028 | Esophagus | ESCC | Vibrio cholerae infection | 34/4205 | 50/8465 | 6.62e-03 | 1.62e-02 | 8.30e-03 | 34 |
| hsa0019038 | Esophagus | ESCC | Oxidative phosphorylation | 104/4205 | 134/8465 | 2.04e-11 | 2.98e-10 | 1.53e-10 | 104 |
| Page: 1 2 3 4 5 |
Top |
Cell-cell communication analysis |
| Identification of potential cell-cell interactions between two cell types and their ligand-receptor pairs for different disease states |
| Ligand | Receptor | LRpair | Pathway | Tissue | Disease Stage |
| Page: 1 |
Top |
Single-cell gene regulatory network inference analysis |
| Find out the significant the regulons (TFs) and the target genes of each regulon across cell types for different disease states |
| TF | Cell Type | Tissue | Disease Stage | Target Gene | RSS | Regulon Activity |
| ∗The dot plots of a searched regulon are shown for all cell subpopulations in each disease state of each tissue based on the regulon specific score inferred using pySCENIC and by calculating the average expression. |
| Page: 1 |
Top |
Somatic mutation of malignant transformation related genes |
| Annotation of somatic variants for genes involved in malignant transformation |
| Hugo Symbol | Variant Class | Variant Classification | dbSNP RS | HGVSc | HGVSp | HGVSp Short | SWISSPROT | BIOTYPE | SIFT | PolyPhen | Tumor Sample Barcode | Tissue | Histology | Sex | Age | Stage | Therapy Types | Drugs | Outcome |
| ATP6V1A | SNV | Missense_Mutation | c.806N>C | p.Ser269Thr | p.S269T | P38606 | protein_coding | tolerated(0.12) | benign(0.248) | TCGA-A2-A0YT-01 | Breast | breast invasive carcinoma | Female | <65 | III/IV | Hormone Therapy | arimidex | SD | |
| ATP6V1A | SNV | Missense_Mutation | c.260N>T | p.Ser87Phe | p.S87F | P38606 | protein_coding | deleterious(0) | probably_damaging(0.966) | TCGA-AC-A23H-01 | Breast | breast invasive carcinoma | Female | >=65 | I/II | Unknown | Unknown | PD | |
| ATP6V1A | SNV | Missense_Mutation | c.1306N>C | p.Asp436His | p.D436H | P38606 | protein_coding | deleterious(0) | probably_damaging(0.999) | TCGA-C8-A27B-01 | Breast | breast invasive carcinoma | Female | <65 | I/II | Chemotherapy | 5-fluorouracil | CR | |
| ATP6V1A | SNV | Missense_Mutation | rs367827756 | c.104N>T | p.Ala35Val | p.A35V | P38606 | protein_coding | tolerated(0.16) | benign(0.311) | TCGA-E2-A1IH-01 | Breast | breast invasive carcinoma | Female | >=65 | I/II | Hormone Therapy | aromasin | SD |
| ATP6V1A | SNV | Missense_Mutation | novel | c.1711C>T | p.Arg571Cys | p.R571C | P38606 | protein_coding | deleterious(0) | probably_damaging(0.922) | TCGA-E9-A1RF-01 | Breast | breast invasive carcinoma | Female | >=65 | III/IV | Hormone Therapy | tamoxiphen | SD |
| ATP6V1A | SNV | Missense_Mutation | c.1049N>G | p.Ser350Cys | p.S350C | P38606 | protein_coding | deleterious(0) | probably_damaging(1) | TCGA-IR-A3LL-01 | Cervix | cervical & endocervical cancer | Female | <65 | I/II | Chemotherapy | cisplatin | CR | |
| ATP6V1A | SNV | Missense_Mutation | novel | c.1708N>G | p.Ile570Val | p.I570V | P38606 | protein_coding | tolerated(0.43) | benign(0.251) | TCGA-UC-A7PG-06 | Cervix | cervical & endocervical cancer | Female | <65 | III/IV | Chemotherapy | cisplatin | PD |
| ATP6V1A | SNV | Missense_Mutation | novel | c.1849N>A | p.Asp617Asn | p.D617N | P38606 | protein_coding | deleterious(0.03) | benign(0.163) | TCGA-VS-A954-01 | Cervix | cervical & endocervical cancer | Female | >=65 | III/IV | Chemotherapy | cisplatin | CR |
| ATP6V1A | SNV | Missense_Mutation | rs769264993 | c.1375N>T | p.Arg459Cys | p.R459C | P38606 | protein_coding | deleterious(0.01) | possibly_damaging(0.772) | TCGA-AA-3811-01 | Colorectum | colon adenocarcinoma | Female | >=65 | III/IV | Unknown | Unknown | PD |
| ATP6V1A | SNV | Missense_Mutation | c.787N>A | p.Leu263Ile | p.L263I | P38606 | protein_coding | tolerated(0.07) | benign(0.321) | TCGA-AA-3977-01 | Colorectum | colon adenocarcinoma | Male | >=65 | I/II | Unknown | Unknown | SD |
| Page: 1 2 3 4 5 6 7 |
Top |
Related drugs of malignant transformation related genes |
| Identification of chemicals and drugs interact with genes involved in malignant transfromation |
| (DGIdb 4.0) |
| Entrez ID | Symbol | Category | Interaction Types | Drug Claim Name | Drug Name | PMIDs |
| Page: 1 |

Copyright 2023-Present -The University of Texas Health Science Center at Houston |