| Tissue | Expression Dynamics | Abbreviation |
| Breast |  | IDC: Invasive ductal carcinoma |
| DCIS: Ductal carcinoma in situ |
| Precancer(BRCA1-mut): Precancerous lesion from BRCA1 mutation carriers |
| Esophagus | 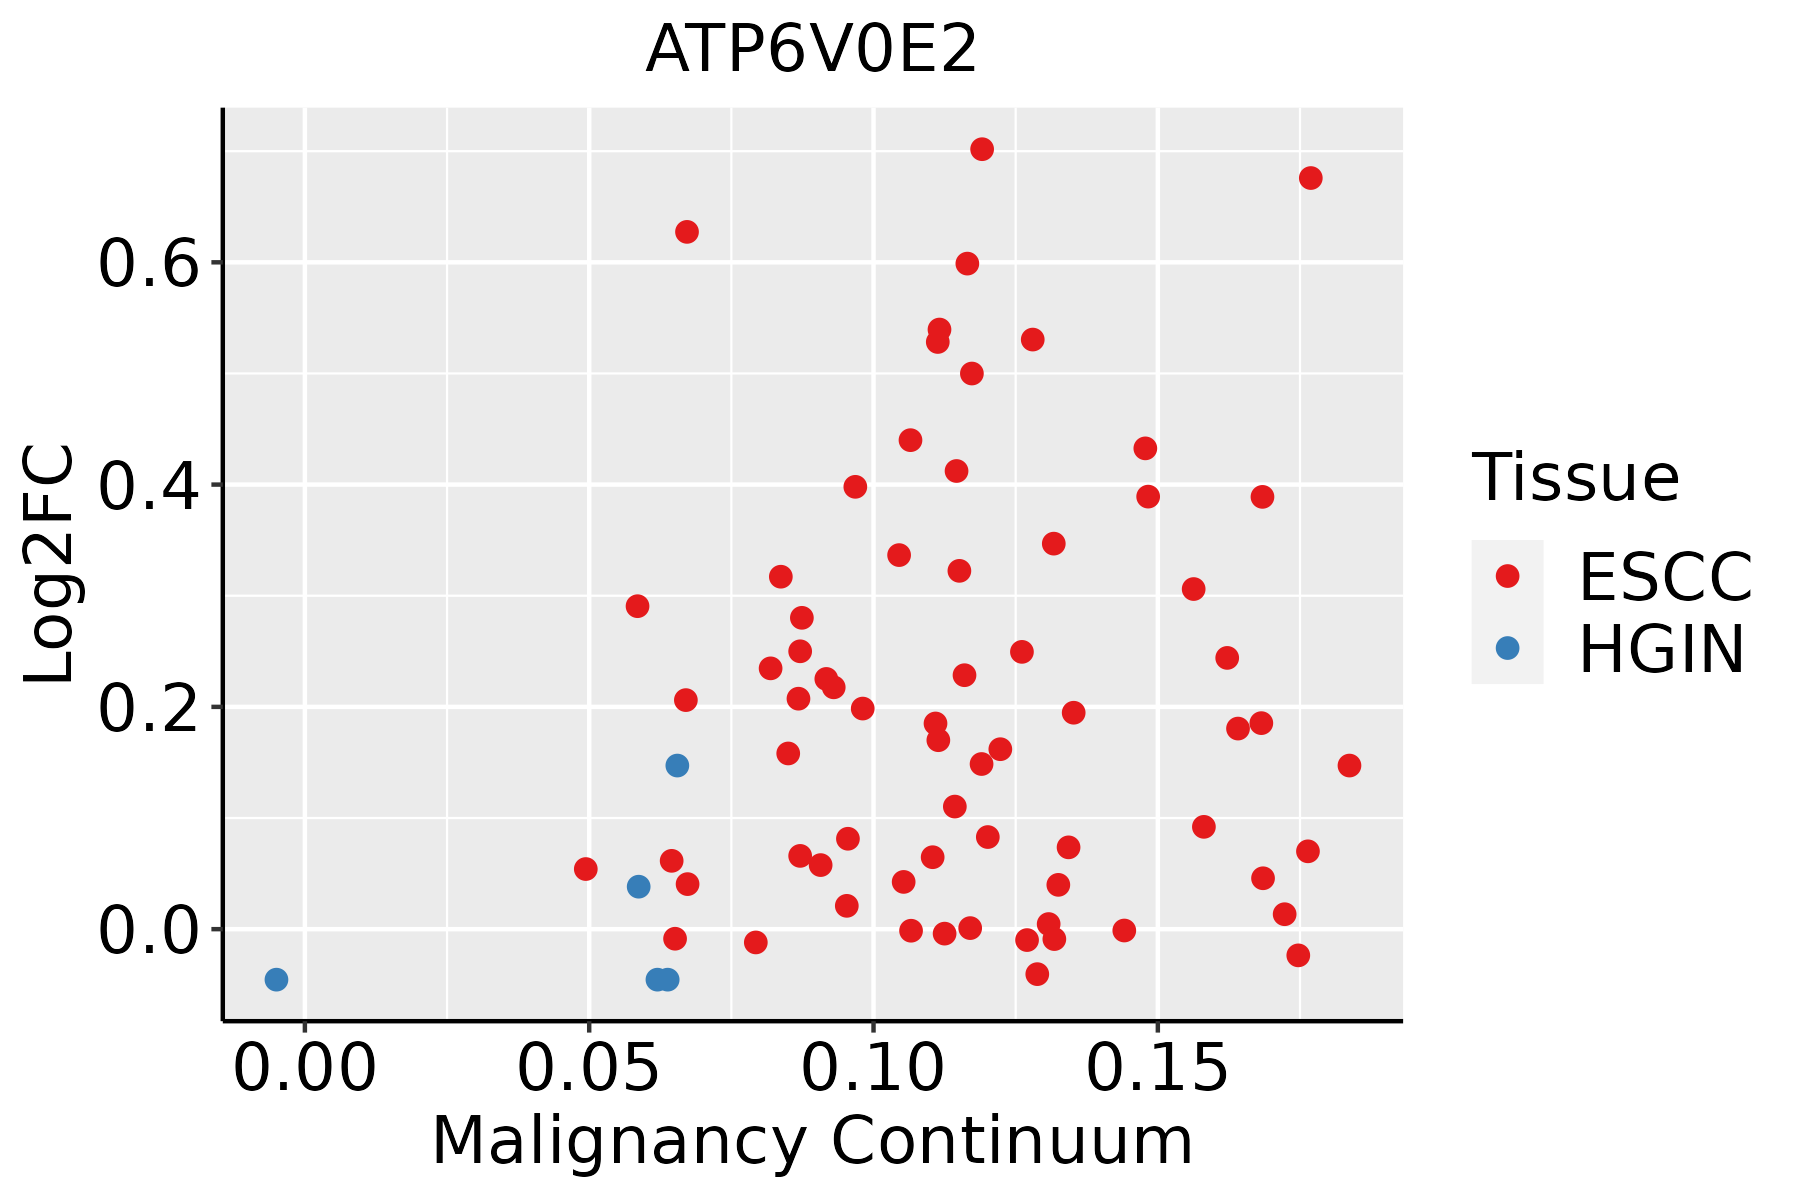 | ESCC: Esophageal squamous cell carcinoma |
| HGIN: High-grade intraepithelial neoplasias |
| LGIN: Low-grade intraepithelial neoplasias |
| Liver |  | HCC: Hepatocellular carcinoma |
| NAFLD: Non-alcoholic fatty liver disease |
| Prostate | 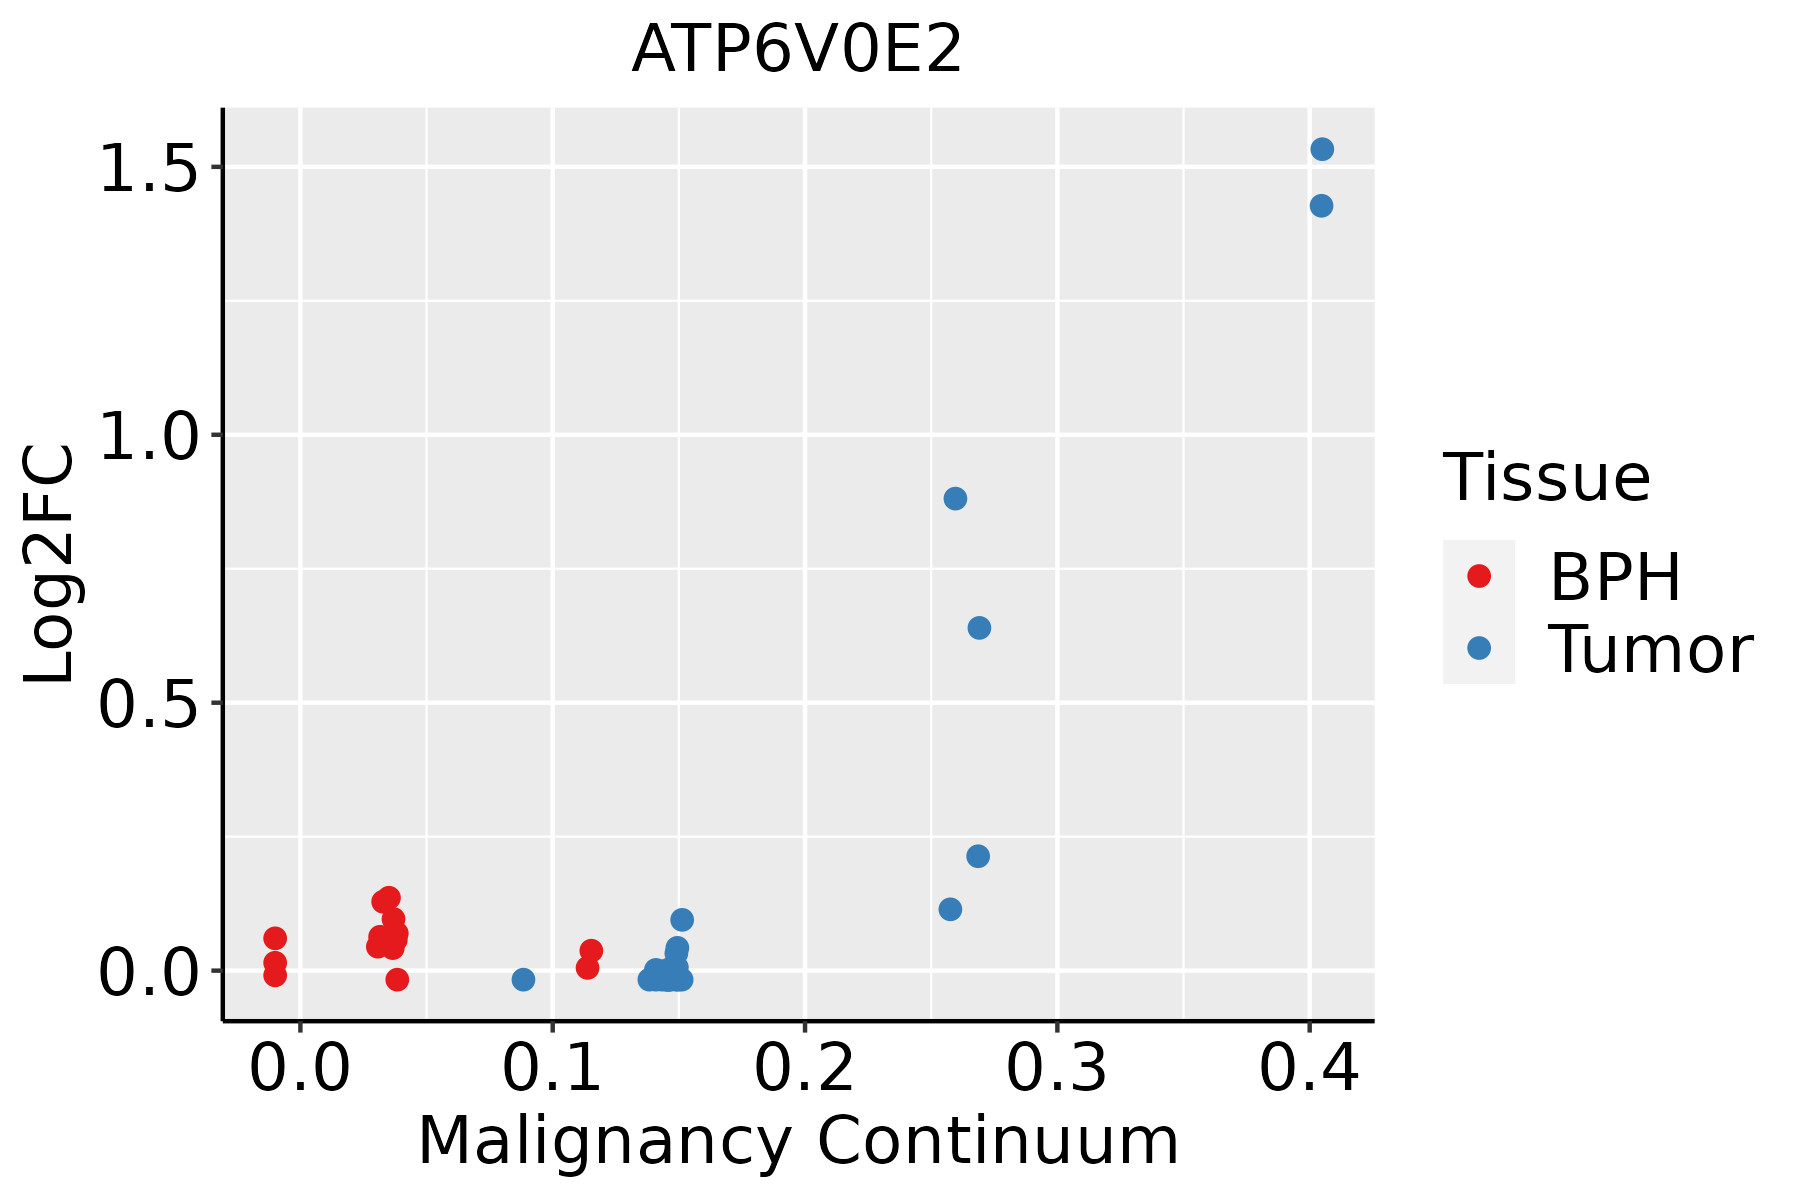 | BPH: Benign Prostatic Hyperplasia |
| Thyroid |  | ATC: Anaplastic thyroid cancer |
| HT: Hashimoto's thyroiditis |
| PTC: Papillary thyroid cancer |
| GO ID | Tissue | Disease Stage | Description | Gene Ratio | Bg Ratio | pvalue | p.adjust | Count |
| GO:190260012 | Breast | IDC | proton transmembrane transport | 40/1434 | 157/18723 | 7.34e-12 | 1.34e-09 | 40 |
| GO:190260022 | Breast | DCIS | proton transmembrane transport | 40/1390 | 157/18723 | 2.77e-12 | 5.80e-10 | 40 |
| GO:001623617 | Esophagus | ESCC | macroautophagy | 216/8552 | 291/18723 | 1.94e-23 | 4.57e-21 | 216 |
| GO:001050617 | Esophagus | ESCC | regulation of autophagy | 220/8552 | 317/18723 | 6.72e-18 | 6.36e-16 | 220 |
| GO:001624114 | Esophagus | ESCC | regulation of macroautophagy | 102/8552 | 141/18723 | 1.09e-10 | 3.27e-09 | 102 |
| GO:00070353 | Esophagus | ESCC | vacuolar acidification | 20/8552 | 24/18723 | 1.69e-04 | 1.11e-03 | 20 |
| GO:00514521 | Esophagus | ESCC | intracellular pH reduction | 29/8552 | 42/18723 | 1.87e-03 | 8.46e-03 | 29 |
| GO:00458511 | Esophagus | ESCC | pH reduction | 31/8552 | 46/18723 | 2.42e-03 | 1.06e-02 | 31 |
| GO:190260018 | Esophagus | ESCC | proton transmembrane transport | 88/8552 | 157/18723 | 5.62e-03 | 2.10e-02 | 88 |
| GO:001623611 | Liver | Cirrhotic | macroautophagy | 129/4634 | 291/18723 | 1.75e-13 | 1.41e-11 | 129 |
| GO:001050611 | Liver | Cirrhotic | regulation of autophagy | 132/4634 | 317/18723 | 2.17e-11 | 1.33e-09 | 132 |
| GO:00162414 | Liver | Cirrhotic | regulation of macroautophagy | 60/4634 | 141/18723 | 2.57e-06 | 4.63e-05 | 60 |
| GO:0007035 | Liver | Cirrhotic | vacuolar acidification | 15/4634 | 24/18723 | 9.76e-05 | 1.03e-03 | 15 |
| GO:0051452 | Liver | Cirrhotic | intracellular pH reduction | 21/4634 | 42/18723 | 3.57e-04 | 3.03e-03 | 21 |
| GO:0045851 | Liver | Cirrhotic | pH reduction | 22/4634 | 46/18723 | 5.75e-04 | 4.48e-03 | 22 |
| GO:00300045 | Liver | Cirrhotic | cellular monovalent inorganic cation homeostasis | 38/4634 | 103/18723 | 4.02e-03 | 2.17e-02 | 38 |
| GO:00306415 | Liver | Cirrhotic | regulation of cellular pH | 31/4634 | 81/18723 | 4.76e-03 | 2.50e-02 | 31 |
| GO:00068853 | Liver | Cirrhotic | regulation of pH | 33/4634 | 91/18723 | 9.39e-03 | 4.29e-02 | 33 |
| GO:001623621 | Liver | HCC | macroautophagy | 204/7958 | 291/18723 | 8.66e-22 | 1.41e-19 | 204 |
| GO:001050621 | Liver | HCC | regulation of autophagy | 210/7958 | 317/18723 | 7.59e-18 | 8.45e-16 | 210 |
| Pathway ID | Tissue | Disease Stage | Description | Gene Ratio | Bg Ratio | pvalue | p.adjust | qvalue | Count |
| hsa0019023 | Breast | IDC | Oxidative phosphorylation | 62/867 | 134/8465 | 4.78e-27 | 2.59e-25 | 1.94e-25 | 62 |
| hsa0511022 | Breast | IDC | Vibrio cholerae infection | 17/867 | 50/8465 | 4.82e-06 | 6.82e-05 | 5.10e-05 | 17 |
| hsa0414522 | Breast | IDC | Phagosome | 34/867 | 152/8465 | 8.00e-06 | 9.99e-05 | 7.48e-05 | 34 |
| hsa0532321 | Breast | IDC | Rheumatoid arthritis | 21/867 | 93/8465 | 3.69e-04 | 3.15e-03 | 2.36e-03 | 21 |
| hsa0512022 | Breast | IDC | Epithelial cell signaling in Helicobacter pylori infection | 16/867 | 70/8465 | 1.56e-03 | 1.13e-02 | 8.42e-03 | 16 |
| hsa0019033 | Breast | IDC | Oxidative phosphorylation | 62/867 | 134/8465 | 4.78e-27 | 2.59e-25 | 1.94e-25 | 62 |
| hsa0511032 | Breast | IDC | Vibrio cholerae infection | 17/867 | 50/8465 | 4.82e-06 | 6.82e-05 | 5.10e-05 | 17 |
| hsa0414532 | Breast | IDC | Phagosome | 34/867 | 152/8465 | 8.00e-06 | 9.99e-05 | 7.48e-05 | 34 |
| hsa0532331 | Breast | IDC | Rheumatoid arthritis | 21/867 | 93/8465 | 3.69e-04 | 3.15e-03 | 2.36e-03 | 21 |
| hsa0512032 | Breast | IDC | Epithelial cell signaling in Helicobacter pylori infection | 16/867 | 70/8465 | 1.56e-03 | 1.13e-02 | 8.42e-03 | 16 |
| hsa0512041 | Breast | DCIS | Epithelial cell signaling in Helicobacter pylori infection | 15/846 | 70/8465 | 3.31e-03 | 1.98e-02 | 1.46e-02 | 15 |
| hsa0512051 | Breast | DCIS | Epithelial cell signaling in Helicobacter pylori infection | 15/846 | 70/8465 | 3.31e-03 | 1.98e-02 | 1.46e-02 | 15 |
| hsa00190210 | Esophagus | ESCC | Oxidative phosphorylation | 104/4205 | 134/8465 | 2.04e-11 | 2.98e-10 | 1.53e-10 | 104 |
| hsa0516510 | Esophagus | ESCC | Human papillomavirus infection | 215/4205 | 331/8465 | 7.86e-09 | 7.12e-08 | 3.65e-08 | 215 |
| hsa0512018 | Esophagus | ESCC | Epithelial cell signaling in Helicobacter pylori infection | 52/4205 | 70/8465 | 2.17e-05 | 1.07e-04 | 5.47e-05 | 52 |
| hsa0414530 | Esophagus | ESCC | Phagosome | 100/4205 | 152/8465 | 3.81e-05 | 1.72e-04 | 8.82e-05 | 100 |
| hsa0532320 | Esophagus | ESCC | Rheumatoid arthritis | 59/4205 | 93/8465 | 4.98e-03 | 1.27e-02 | 6.52e-03 | 59 |
| hsa0511028 | Esophagus | ESCC | Vibrio cholerae infection | 34/4205 | 50/8465 | 6.62e-03 | 1.62e-02 | 8.30e-03 | 34 |
| hsa0019038 | Esophagus | ESCC | Oxidative phosphorylation | 104/4205 | 134/8465 | 2.04e-11 | 2.98e-10 | 1.53e-10 | 104 |
| hsa0516515 | Esophagus | ESCC | Human papillomavirus infection | 215/4205 | 331/8465 | 7.86e-09 | 7.12e-08 | 3.65e-08 | 215 |
| Hugo Symbol | Variant Class | Variant Classification | dbSNP RS | HGVSc | HGVSp | HGVSp Short | SWISSPROT | BIOTYPE | SIFT | PolyPhen | Tumor Sample Barcode | Tissue | Histology | Sex | Age | Stage | Therapy Types | Drugs | Outcome |
| ATP6V0E2 | SNV | Missense_Mutation | | c.553N>G | p.Leu185Val | p.L185V | | protein_coding | deleterious_low_confidence(0) | benign(0.036) | TCGA-AC-A23H-01 | Breast | breast invasive carcinoma | Female | >=65 | I/II | Unknown | Unknown | PD |
| ATP6V0E2 | SNV | Missense_Mutation | rs762511980 | c.280G>A | p.Ala94Thr | p.A94T | | protein_coding | deleterious_low_confidence(0.01) | probably_damaging(1) | TCGA-2W-A8YY-01 | Cervix | cervical & endocervical cancer | Female | <65 | I/II | Chemotherapy | cisplatin | CR |
| ATP6V0E2 | SNV | Missense_Mutation | rs764371935 | c.416N>T | p.Pro139Leu | p.P139L | | protein_coding | deleterious_low_confidence(0.01) | benign(0.025) | TCGA-CK-4952-01 | Colorectum | colon adenocarcinoma | Female | <65 | III/IV | Unknown | Unknown | SD |
| ATP6V0E2 | SNV | Missense_Mutation | novel | c.412G>A | p.Asp138Asn | p.D138N | | protein_coding | tolerated_low_confidence(0.05) | benign(0.001) | TCGA-F5-6814-01 | Colorectum | rectum adenocarcinoma | Male | <65 | I/II | Unknown | Unknown | SD |
| ATP6V0E2 | SNV | Missense_Mutation | rs762511980 | c.280G>A | p.Ala94Thr | p.A94T | | protein_coding | deleterious_low_confidence(0.01) | probably_damaging(1) | TCGA-AP-A051-01 | Endometrium | uterine corpus endometrioid carcinoma | Female | >=65 | I/II | Unknown | Unknown | SD |
| ATP6V0E2 | SNV | Missense_Mutation | rs763116358 | c.502N>A | p.Gly168Ser | p.G168S | | protein_coding | deleterious_low_confidence(0) | benign(0.159) | TCGA-EO-A22U-01 | Endometrium | uterine corpus endometrioid carcinoma | Female | >=65 | I/II | Unknown | Unknown | SD |
| ATP6V0E2 | SNV | Missense_Mutation | novel | c.394N>T | p.Leu132Phe | p.L132F | | protein_coding | deleterious_low_confidence(0) | benign(0) | TCGA-PG-A914-01 | Endometrium | uterine corpus endometrioid carcinoma | Female | >=65 | I/II | Unknown | Unknown | SD |
| ATP6V0E2 | insertion | Frame_Shift_Ins | novel | c.577dupG | p.Glu193GlyfsTer61 | p.E193Gfs*61 | | protein_coding | | | TCGA-BG-A222-01 | Endometrium | uterine corpus endometrioid carcinoma | Female | <65 | I/II | Unknown | Unknown | SD |
| ATP6V0E2 | SNV | Missense_Mutation | novel | c.158N>G | p.His53Arg | p.H53R | | protein_coding | deleterious_low_confidence(0.01) | probably_damaging(0.963) | TCGA-LG-A9QC-01 | Liver | liver hepatocellular carcinoma | Male | <65 | I/II | Unknown | Unknown | SD |
| ATP6V0E2 | SNV | Missense_Mutation | rs762241479 | c.509G>T | p.Gly170Val | p.G170V | | protein_coding | deleterious_low_confidence(0) | possibly_damaging(0.722) | TCGA-VQ-A8E3-01 | Stomach | stomach adenocarcinoma | Male | >=65 | I/II | Unknown | Unknown | PD |


