
|
|||||
|
 | |
| |
| |
| |
| |
| |
|
Gene: ATP6V0C |
Gene summary for ATP6V0C |
| Gene information | Species | Human | Gene symbol | ATP6V0C | Gene ID | 527 |
| Gene name | ATPase H+ transporting V0 subunit c | |
| Gene Alias | ATP6C | |
| Cytomap | 16p13.3 | |
| Gene Type | protein-coding | GO ID | GO:0006139 | UniProtAcc | P27449 |
Top |
Malignant transformation analysis |
| Identification of the aberrant gene expression in precancerous and cancerous lesions by comparing the gene expression of stem-like cells in diseased tissues with normal stem cells |
| Entrez ID | Symbol | Replicates | Species | Organ | Tissue | Adj P-value | Log2FC | Malignancy |
| 527 | ATP6V0C | sample1 | Human | Cervix | CC | 5.28e-25 | 7.92e-01 | 0.0959 |
| 527 | ATP6V0C | sample3 | Human | Cervix | CC | 1.21e-94 | 1.01e+00 | 0.1387 |
| 527 | ATP6V0C | H2 | Human | Cervix | HSIL_HPV | 3.01e-65 | 9.92e-01 | 0.0632 |
| 527 | ATP6V0C | L1 | Human | Cervix | CC | 1.64e-13 | 6.70e-01 | 0.0802 |
| 527 | ATP6V0C | T1 | Human | Cervix | CC | 2.85e-27 | 6.39e-01 | 0.0918 |
| 527 | ATP6V0C | T2 | Human | Cervix | CC | 1.09e-24 | 8.84e-01 | 0.0709 |
| 527 | ATP6V0C | T3 | Human | Cervix | CC | 7.82e-88 | 1.04e+00 | 0.1389 |
| 527 | ATP6V0C | AEH-subject1 | Human | Endometrium | AEH | 9.30e-53 | 7.89e-01 | -0.3059 |
| 527 | ATP6V0C | AEH-subject2 | Human | Endometrium | AEH | 1.12e-27 | 6.16e-01 | -0.2525 |
| 527 | ATP6V0C | AEH-subject3 | Human | Endometrium | AEH | 8.01e-32 | 5.75e-01 | -0.2576 |
| 527 | ATP6V0C | AEH-subject4 | Human | Endometrium | AEH | 1.79e-14 | 4.60e-01 | -0.2657 |
| 527 | ATP6V0C | AEH-subject5 | Human | Endometrium | AEH | 3.46e-25 | 4.21e-01 | -0.2953 |
| 527 | ATP6V0C | EEC-subject1 | Human | Endometrium | EEC | 1.05e-20 | 4.29e-01 | -0.2682 |
| 527 | ATP6V0C | EEC-subject2 | Human | Endometrium | EEC | 3.14e-30 | 5.08e-01 | -0.2607 |
| 527 | ATP6V0C | EEC-subject3 | Human | Endometrium | EEC | 1.43e-07 | 3.61e-01 | -0.2525 |
| 527 | ATP6V0C | EEC-subject4 | Human | Endometrium | EEC | 6.60e-30 | 5.88e-01 | -0.2571 |
| 527 | ATP6V0C | EEC-subject5 | Human | Endometrium | EEC | 3.55e-34 | 6.93e-01 | -0.249 |
| 527 | ATP6V0C | LZE11D | Human | Esophagus | HGIN | 7.70e-05 | 4.64e-01 | -0.005 |
| 527 | ATP6V0C | LZE2D | Human | Esophagus | HGIN | 6.44e-06 | 9.16e-01 | 0.0642 |
| 527 | ATP6V0C | LZE2T | Human | Esophagus | ESCC | 3.55e-16 | 1.86e+00 | 0.082 |
| Page: 1 2 3 4 5 6 7 8 9 10 |
| Tissue | Expression Dynamics | Abbreviation |
| Cervix | 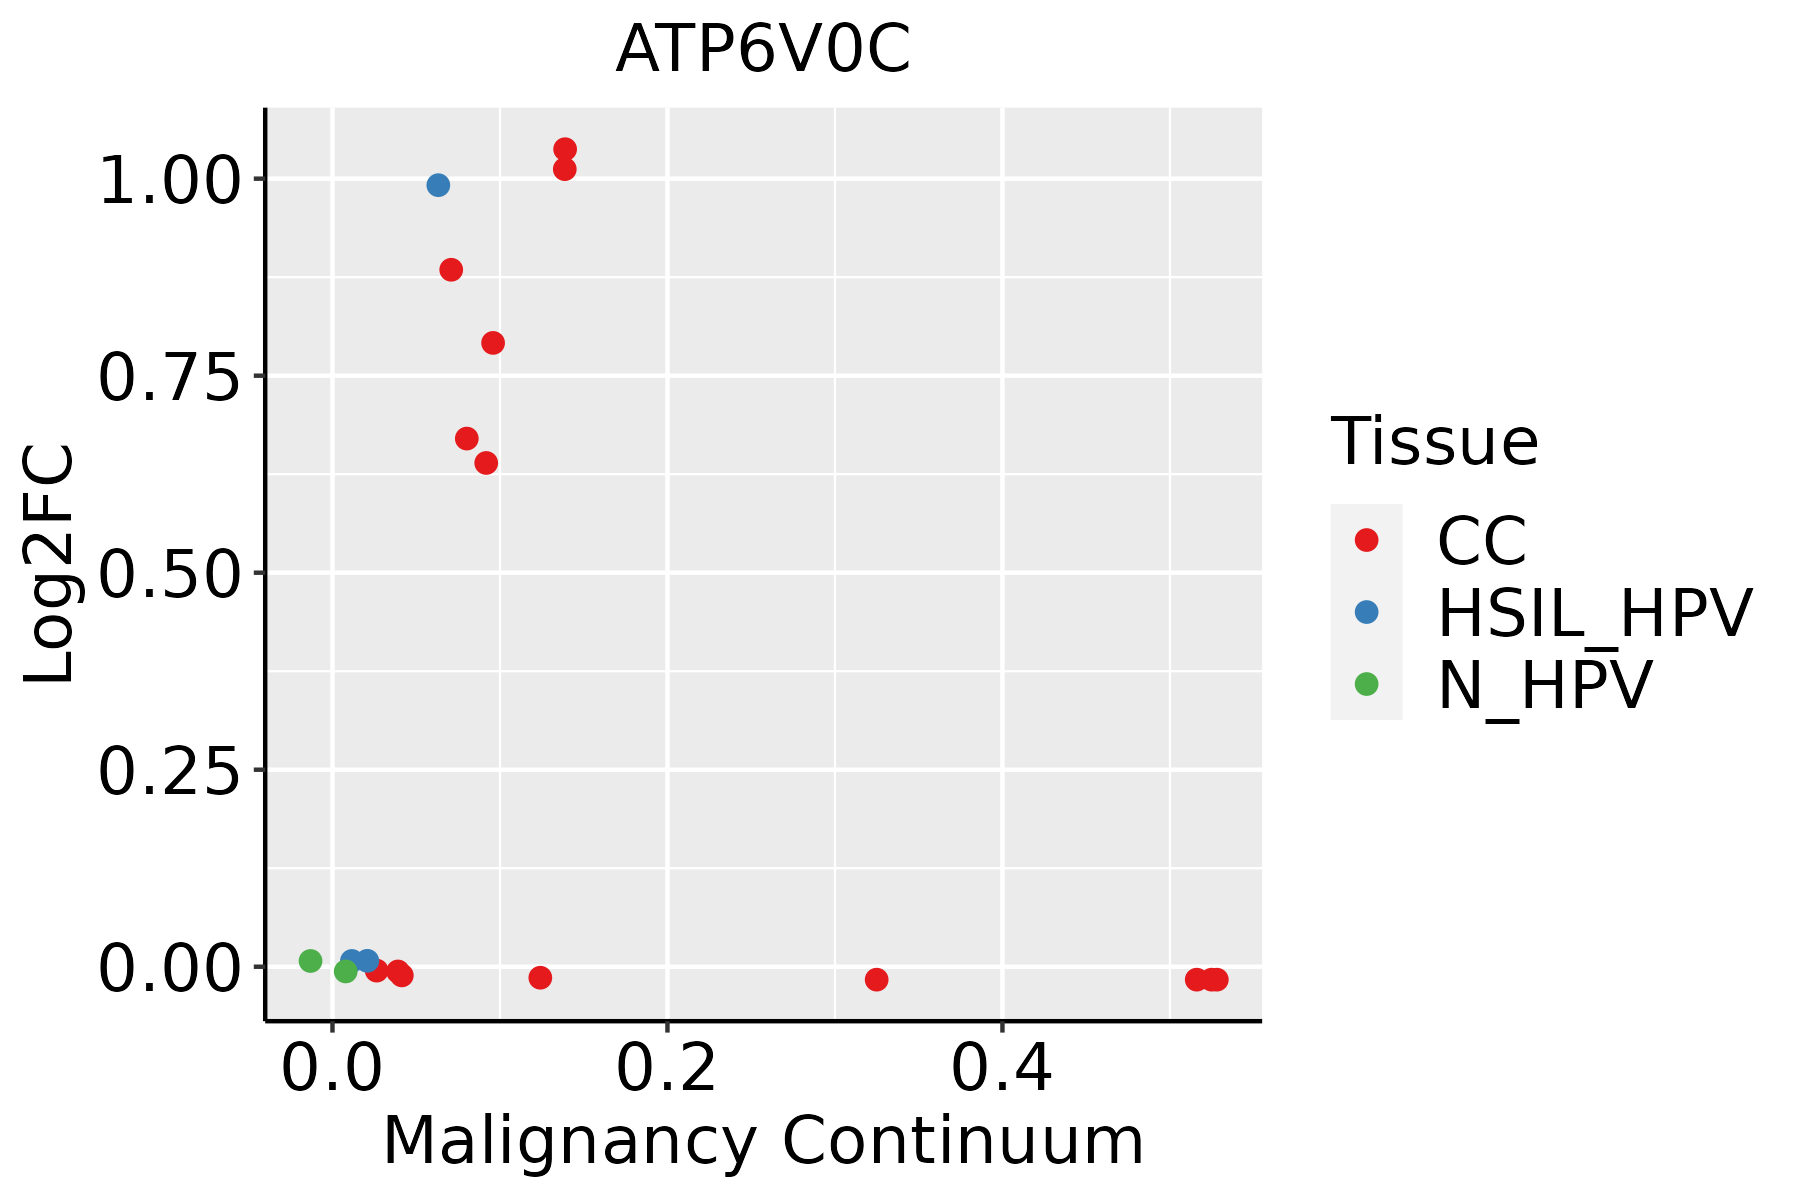 | CC: Cervix cancer |
| HSIL_HPV: HPV-infected high-grade squamous intraepithelial lesions | ||
| N_HPV: HPV-infected normal cervix | ||
| Endometrium | 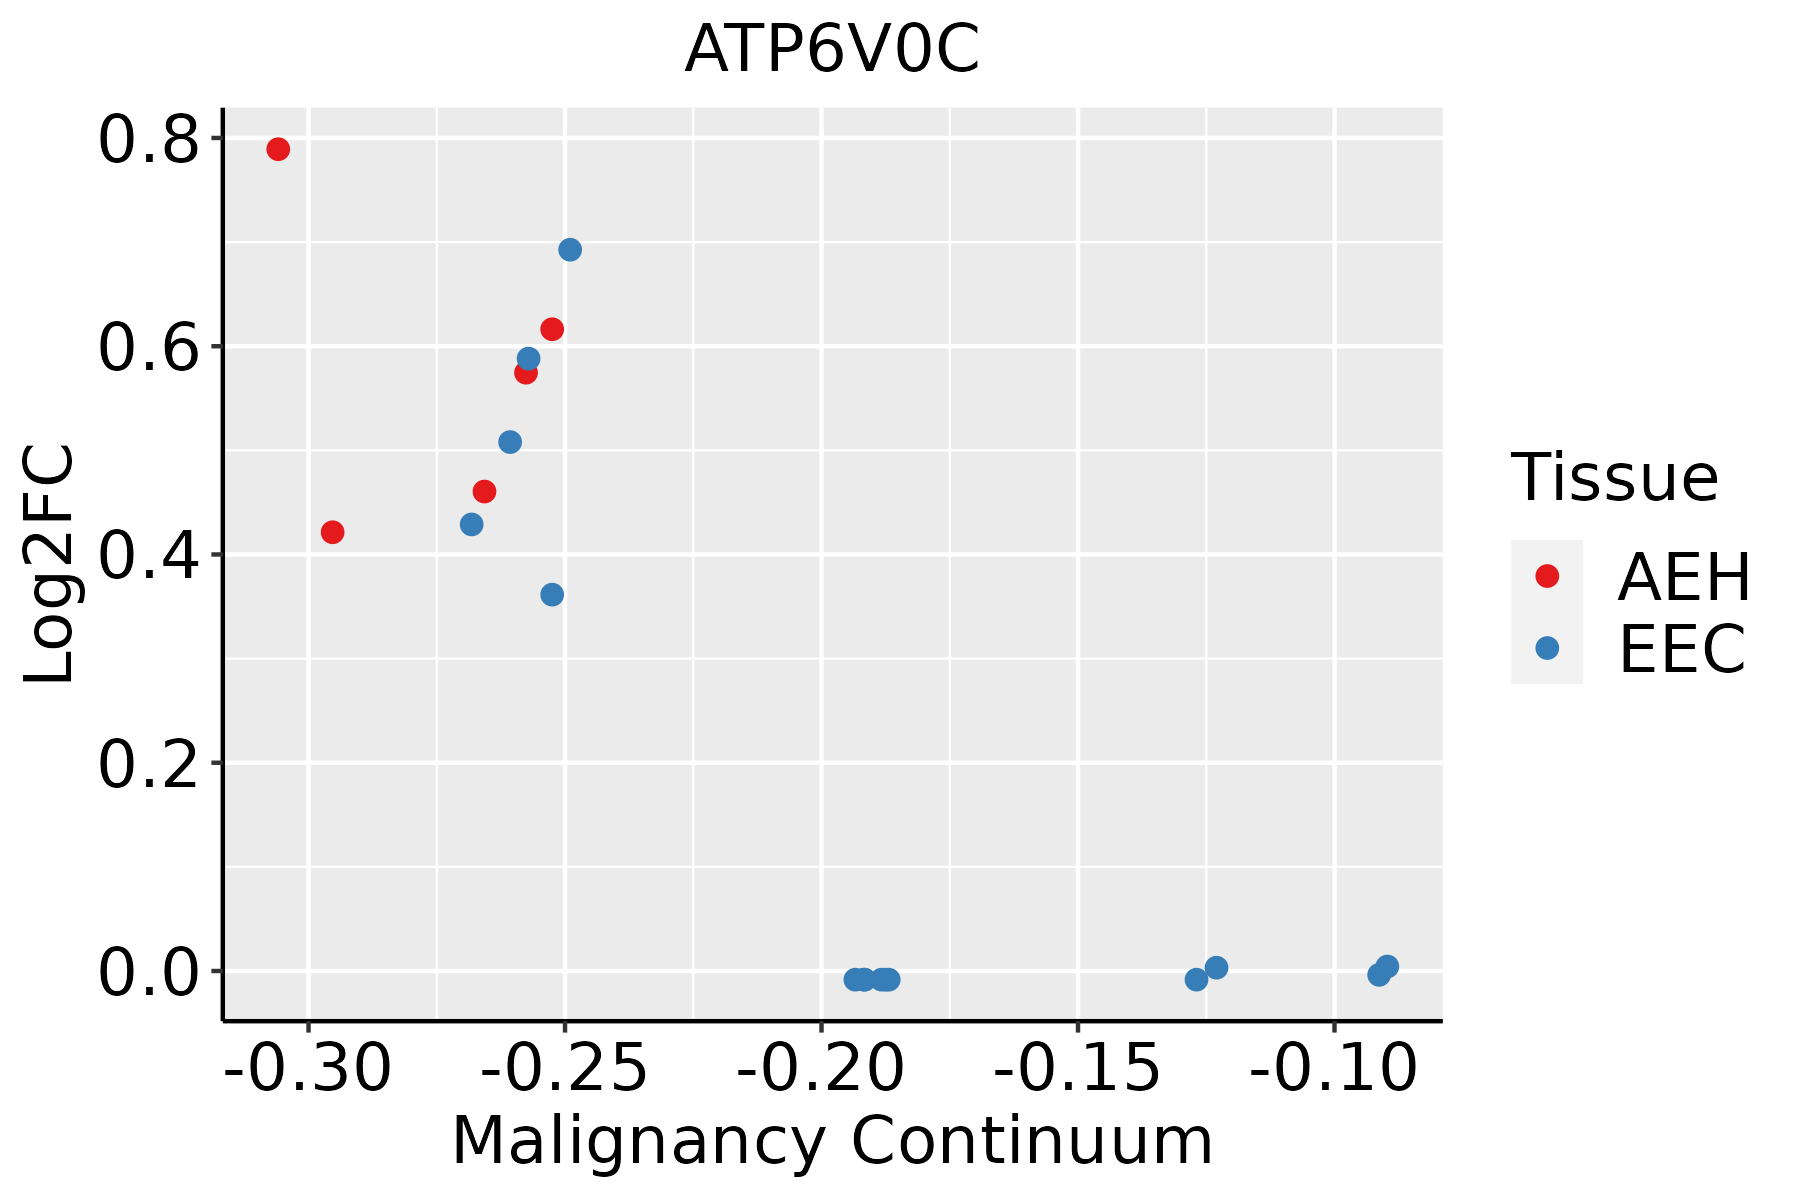 | AEH: Atypical endometrial hyperplasia |
| EEC: Endometrioid Cancer | ||
| Esophagus | 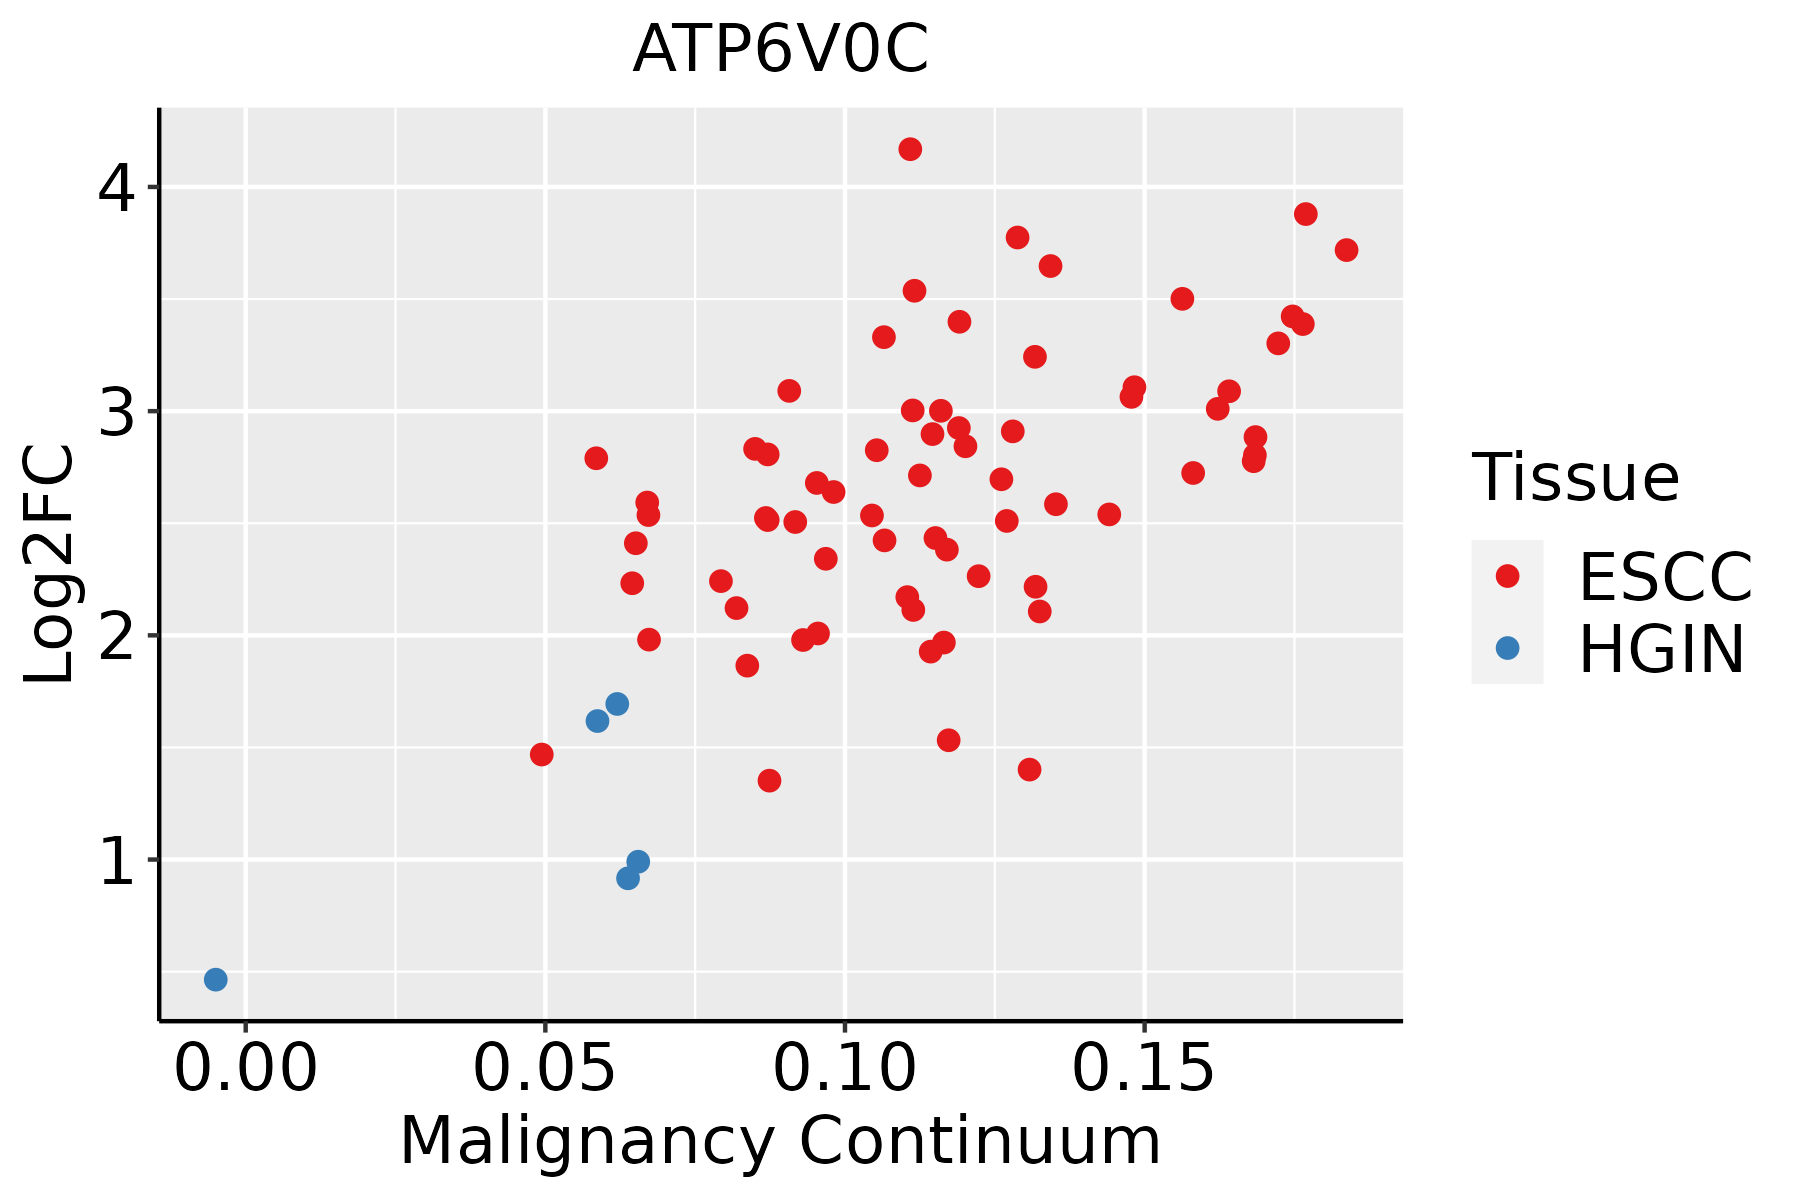 | ESCC: Esophageal squamous cell carcinoma |
| HGIN: High-grade intraepithelial neoplasias | ||
| LGIN: Low-grade intraepithelial neoplasias | ||
| GC | 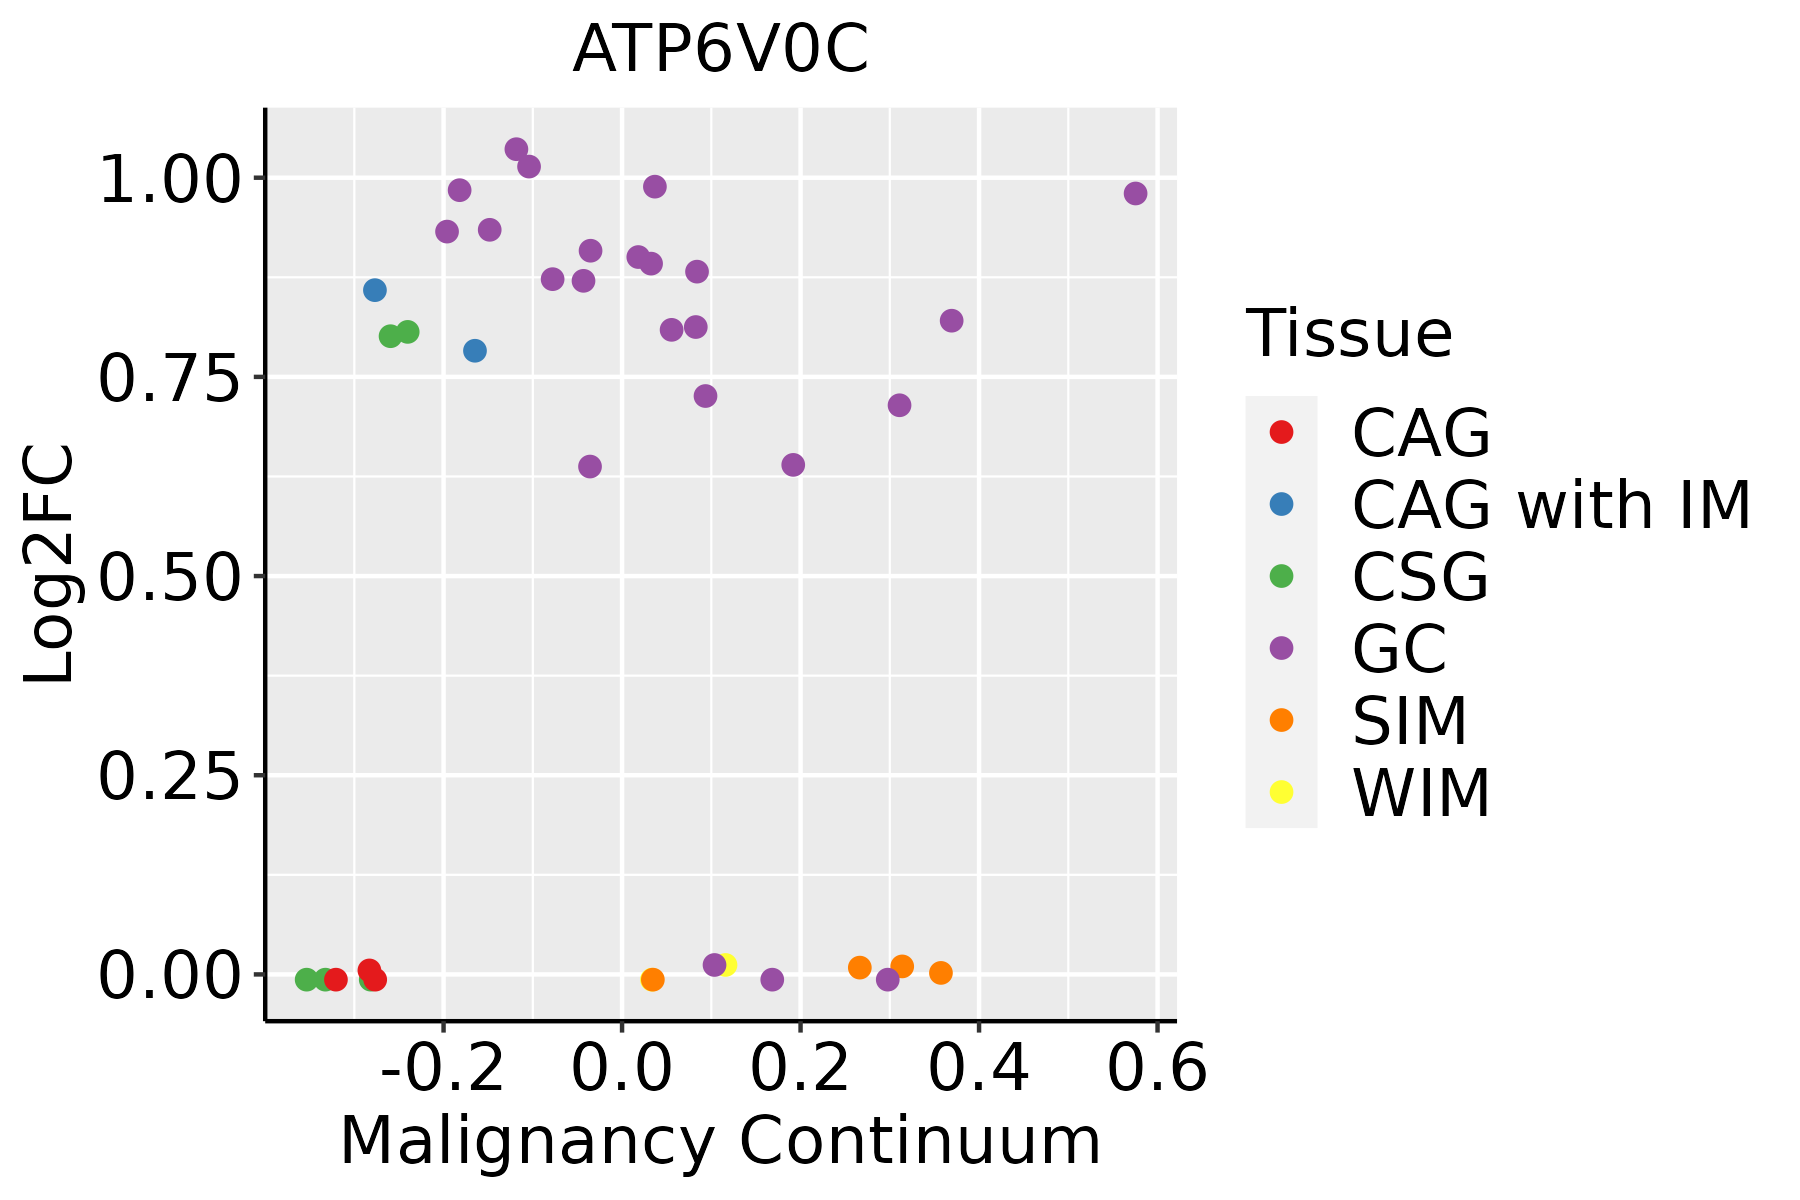 | CAG: Chronic atrophic gastritis |
| CAG with IM: Chronic atrophic gastritis with intestinal metaplasia | ||
| CSG: Chronic superficial gastritis | ||
| GC: Gastric cancer | ||
| SIM: Severe intestinal metaplasia | ||
| WIM: Wild intestinal metaplasia | ||
| Liver |  | HCC: Hepatocellular carcinoma |
| NAFLD: Non-alcoholic fatty liver disease | ||
| Lung | 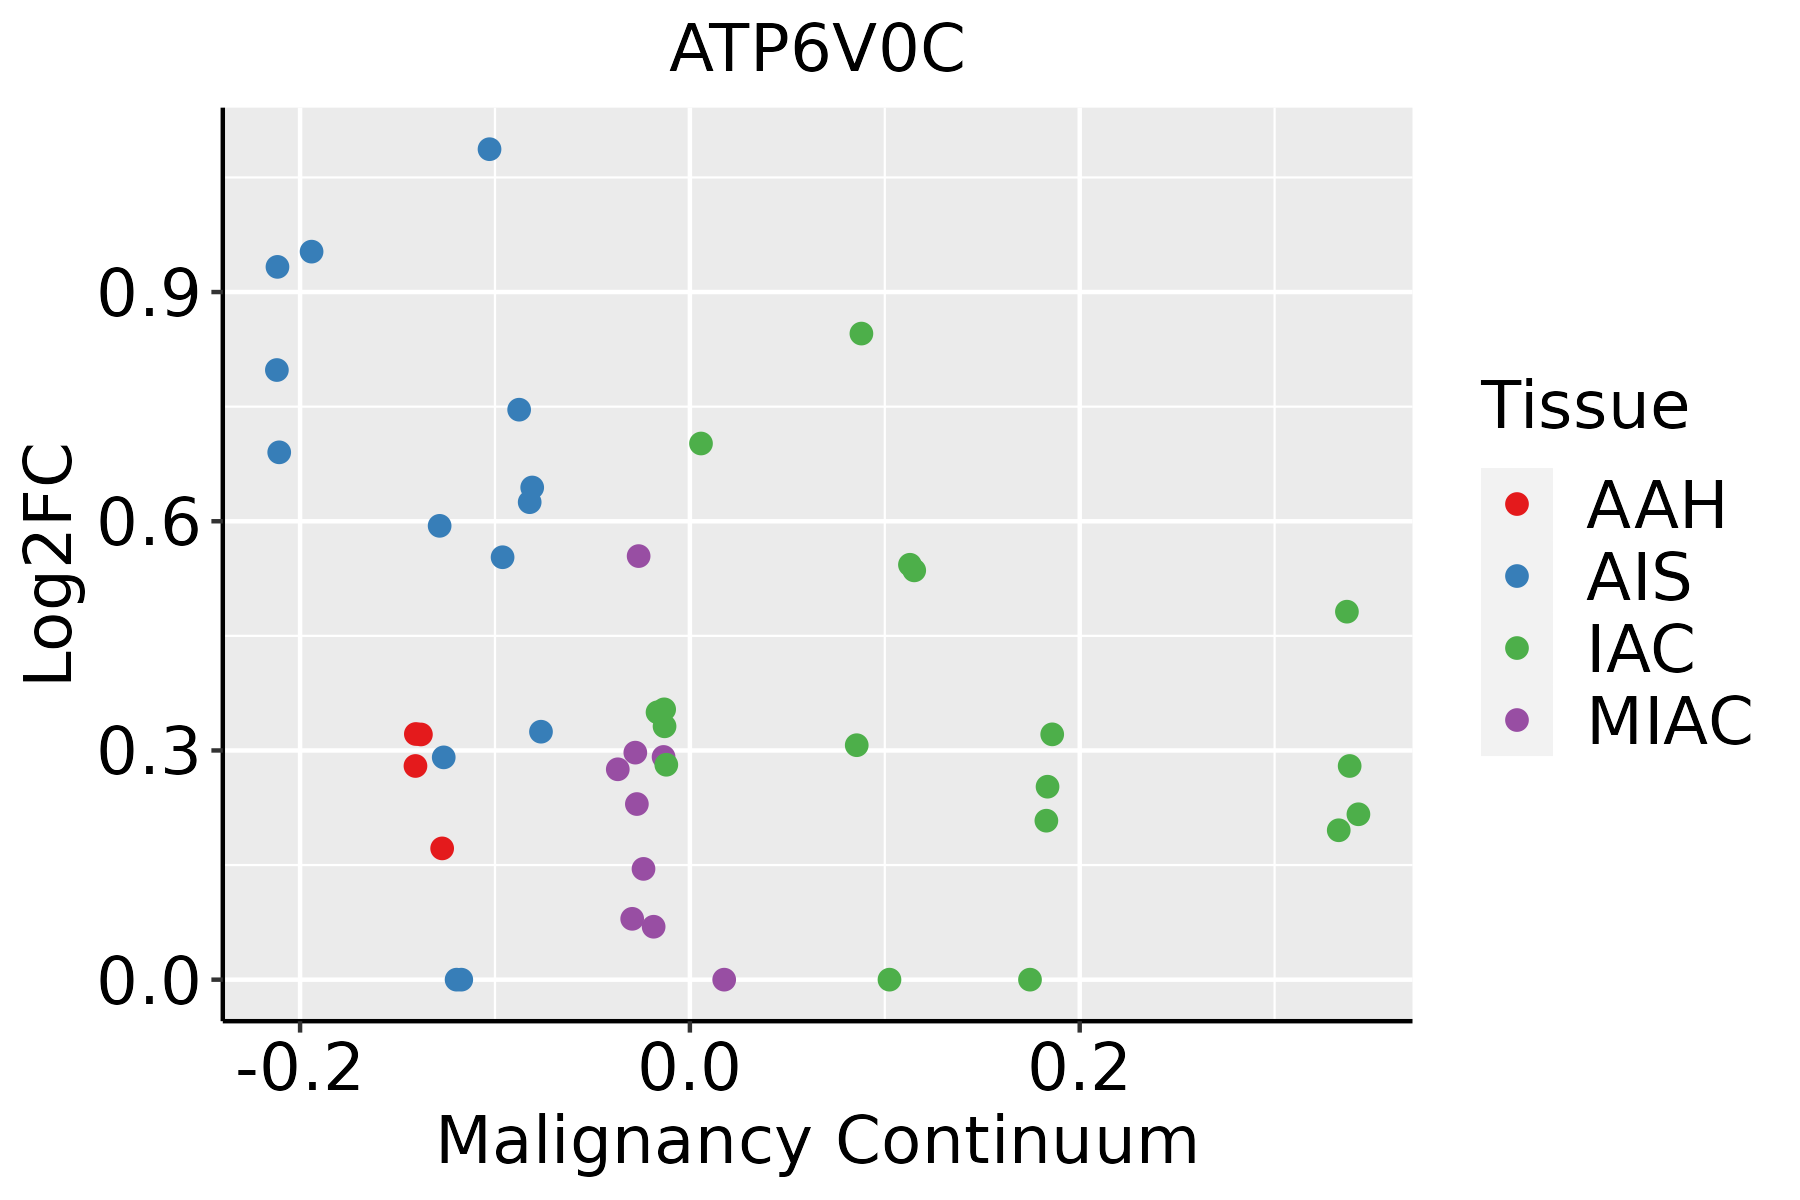 | AAH: Atypical adenomatous hyperplasia |
| AIS: Adenocarcinoma in situ | ||
| IAC: Invasive lung adenocarcinoma | ||
| MIA: Minimally invasive adenocarcinoma | ||
| Prostate | 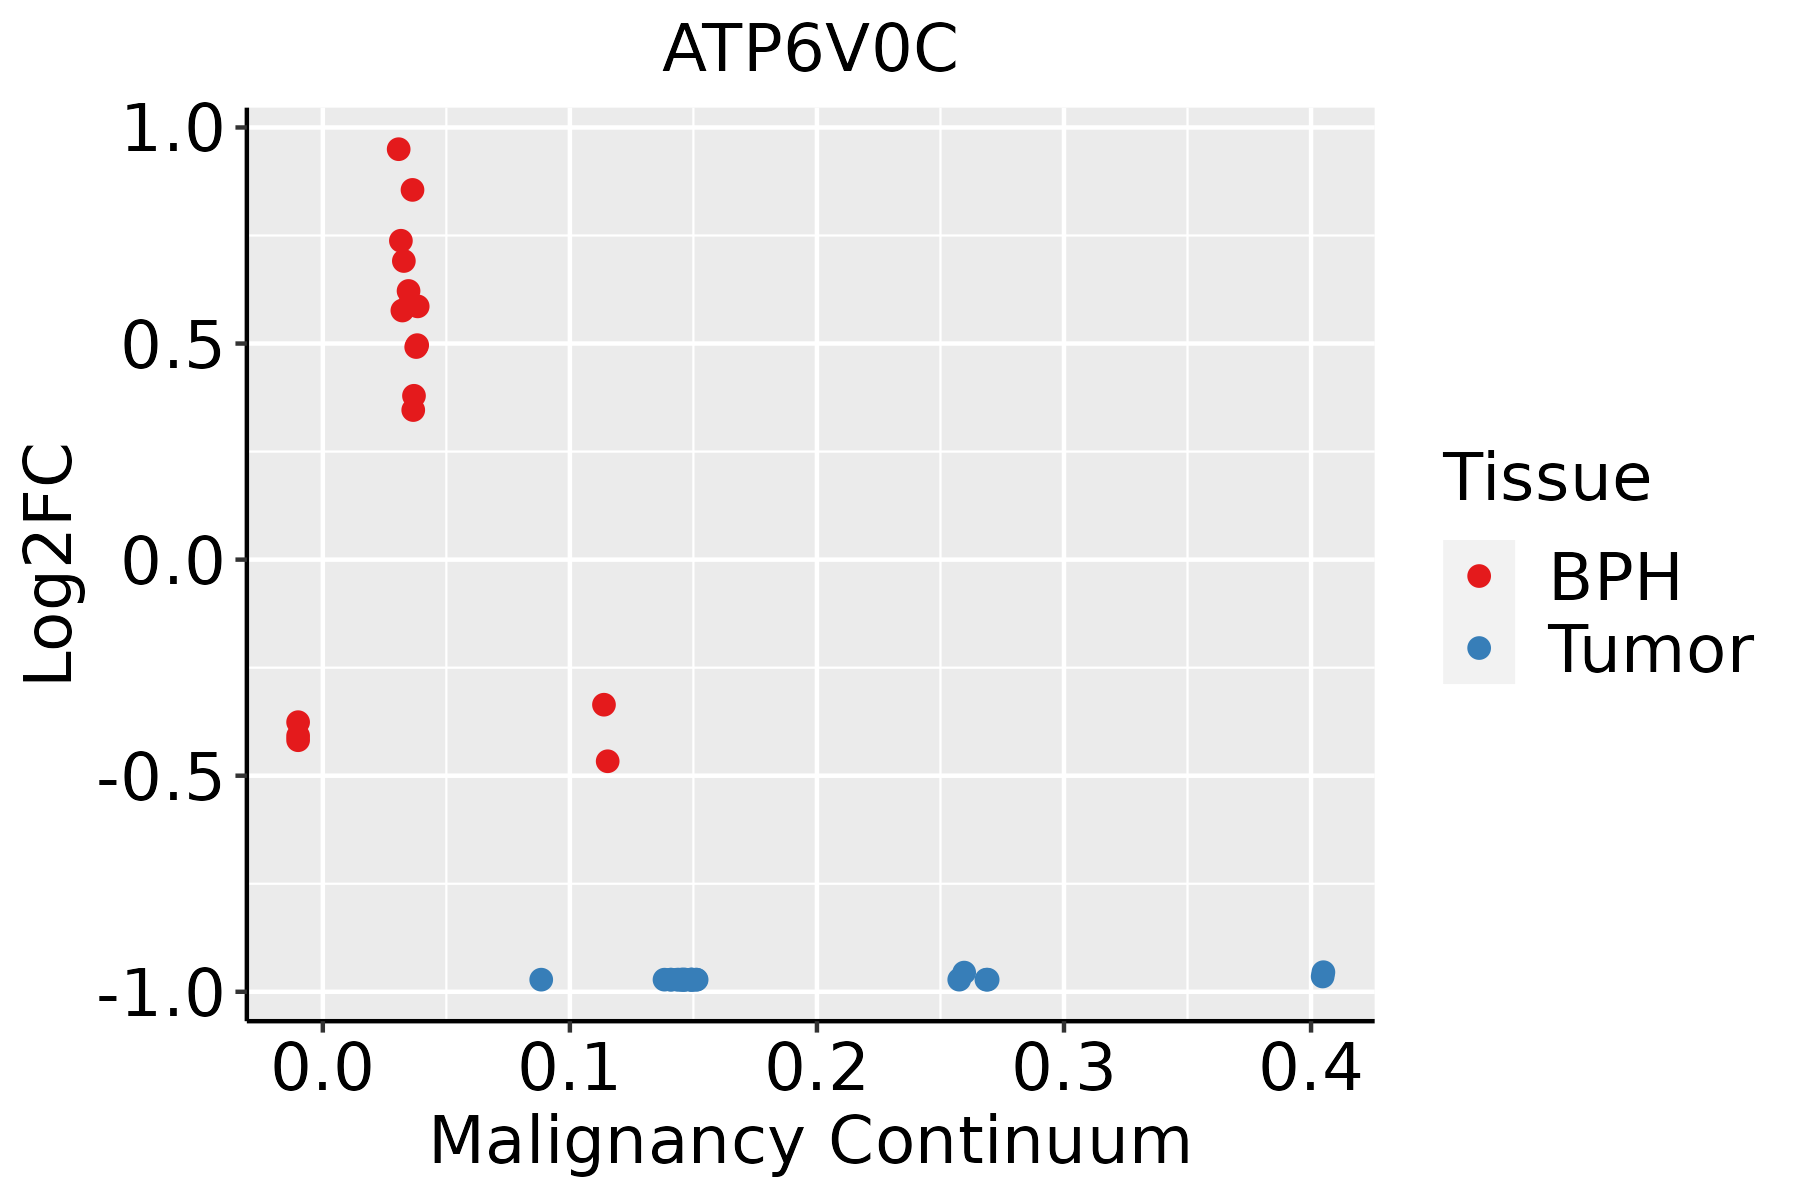 | BPH: Benign Prostatic Hyperplasia |
| Skin | 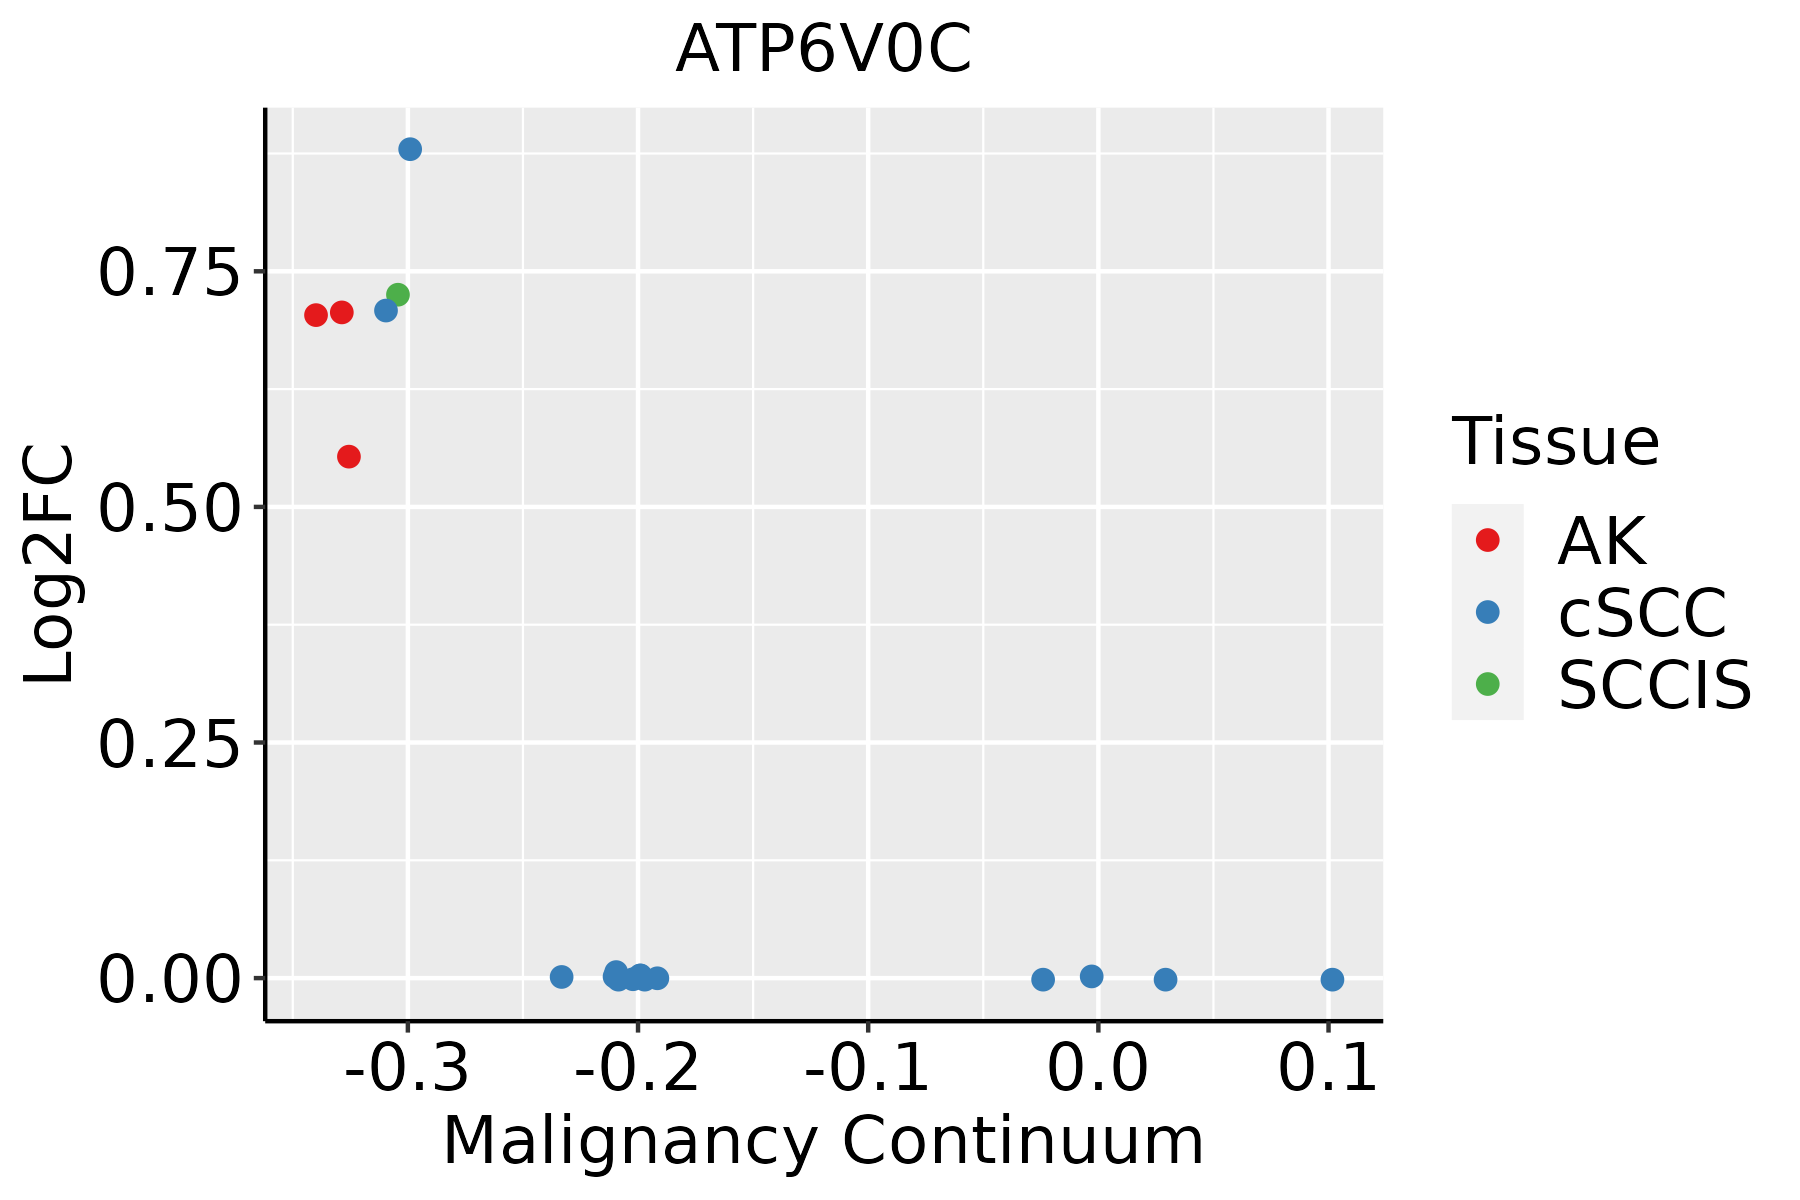 | AK: Actinic keratosis |
| cSCC: Cutaneous squamous cell carcinoma | ||
| SCCIS:squamous cell carcinoma in situ |
| ∗log2FC in expression of this searched gene in stem-like cells from each diseased tissue sample relative to stem-like cells in normal samples in each tissue plotted against the malignancy continuum. Samples are colored based on if they are from different disease stage. |
Top |
Malignant transformation related pathway analysis |
| Find out the enriched GO biological processes and KEGG pathways involved in transition from healthy to precancer to cancer |
| Tissue | Disease Stage | Enriched GO biological Processes |
| Colorectum | AD |  |
| Colorectum | SER |  |
| Colorectum | MSS |  |
| Colorectum | MSI-H |  |
| Colorectum | FAP |  |
| ∗Top 15 enriched GO BP terms are showed in the bar plot of each disease state in each tissue. Each row represents a significant GO biological process which is colored according to the -log10(p.adjust). |
| Page: 1 2 3 4 5 6 7 8 9 |
| GO ID | Tissue | Disease Stage | Description | Gene Ratio | Bg Ratio | pvalue | p.adjust | Count |
| GO:004603410 | Cervix | CC | ATP metabolic process | 90/2311 | 277/18723 | 7.90e-19 | 2.36e-15 | 90 |
| GO:00159858 | Cervix | CC | energy coupled proton transport, down electrochemical gradient | 16/2311 | 26/18723 | 4.33e-09 | 4.32e-07 | 16 |
| GO:00159868 | Cervix | CC | ATP synthesis coupled proton transport | 16/2311 | 26/18723 | 4.33e-09 | 4.32e-07 | 16 |
| GO:00160557 | Cervix | CC | Wnt signaling pathway | 98/2311 | 444/18723 | 4.82e-09 | 4.65e-07 | 98 |
| GO:01987387 | Cervix | CC | cell-cell signaling by wnt | 98/2311 | 446/18723 | 6.16e-09 | 5.58e-07 | 98 |
| GO:00301117 | Cervix | CC | regulation of Wnt signaling pathway | 76/2311 | 328/18723 | 3.05e-08 | 2.08e-06 | 76 |
| GO:00091449 | Cervix | CC | purine nucleoside triphosphate metabolic process | 29/2311 | 88/18723 | 3.62e-07 | 1.45e-05 | 29 |
| GO:00092058 | Cervix | CC | purine ribonucleoside triphosphate metabolic process | 27/2311 | 82/18723 | 9.24e-07 | 3.25e-05 | 27 |
| GO:00091458 | Cervix | CC | purine nucleoside triphosphate biosynthetic process | 24/2311 | 69/18723 | 1.21e-06 | 4.15e-05 | 24 |
| GO:00091998 | Cervix | CC | ribonucleoside triphosphate metabolic process | 28/2311 | 89/18723 | 1.65e-06 | 5.44e-05 | 28 |
| GO:00067548 | Cervix | CC | ATP biosynthetic process | 21/2311 | 57/18723 | 1.91e-06 | 5.97e-05 | 21 |
| GO:00092068 | Cervix | CC | purine ribonucleoside triphosphate biosynthetic process | 23/2311 | 68/18723 | 3.47e-06 | 9.26e-05 | 23 |
| GO:00092018 | Cervix | CC | ribonucleoside triphosphate biosynthetic process | 24/2311 | 74/18723 | 4.95e-06 | 1.24e-04 | 24 |
| GO:00091419 | Cervix | CC | nucleoside triphosphate metabolic process | 31/2311 | 112/18723 | 9.38e-06 | 2.11e-04 | 31 |
| GO:19026009 | Cervix | CC | proton transmembrane transport | 39/2311 | 157/18723 | 1.23e-05 | 2.57e-04 | 39 |
| GO:00091428 | Cervix | CC | nucleoside triphosphate biosynthetic process | 25/2311 | 85/18723 | 2.17e-05 | 3.89e-04 | 25 |
| GO:00162367 | Cervix | CC | macroautophagy | 58/2311 | 291/18723 | 1.40e-04 | 1.70e-03 | 58 |
| GO:00105067 | Cervix | CC | regulation of autophagy | 61/2311 | 317/18723 | 2.61e-04 | 2.87e-03 | 61 |
| GO:00196939 | Cervix | CC | ribose phosphate metabolic process | 72/2311 | 396/18723 | 4.49e-04 | 4.48e-03 | 72 |
| GO:00092599 | Cervix | CC | ribonucleotide metabolic process | 70/2311 | 385/18723 | 5.35e-04 | 5.18e-03 | 70 |
| Page: 1 2 3 4 5 6 7 8 9 10 11 12 13 14 15 16 17 18 19 20 21 22 23 24 25 26 27 |
| Pathway ID | Tissue | Disease Stage | Description | Gene Ratio | Bg Ratio | pvalue | p.adjust | qvalue | Count |
| hsa0414520 | Cervix | CC | Phagosome | 47/1267 | 152/8465 | 3.95e-07 | 4.26e-06 | 2.52e-06 | 47 |
| hsa051207 | Cervix | CC | Epithelial cell signaling in Helicobacter pylori infection | 24/1267 | 70/8465 | 4.35e-05 | 3.09e-04 | 1.83e-04 | 24 |
| hsa051657 | Cervix | CC | Human papillomavirus infection | 74/1267 | 331/8465 | 1.70e-04 | 1.02e-03 | 6.03e-04 | 74 |
| hsa0532314 | Cervix | CC | Rheumatoid arthritis | 27/1267 | 93/8465 | 3.64e-04 | 1.82e-03 | 1.07e-03 | 27 |
| hsa04145110 | Cervix | CC | Phagosome | 47/1267 | 152/8465 | 3.95e-07 | 4.26e-06 | 2.52e-06 | 47 |
| hsa0512014 | Cervix | CC | Epithelial cell signaling in Helicobacter pylori infection | 24/1267 | 70/8465 | 4.35e-05 | 3.09e-04 | 1.83e-04 | 24 |
| hsa0516512 | Cervix | CC | Human papillomavirus infection | 74/1267 | 331/8465 | 1.70e-04 | 1.02e-03 | 6.03e-04 | 74 |
| hsa0532315 | Cervix | CC | Rheumatoid arthritis | 27/1267 | 93/8465 | 3.64e-04 | 1.82e-03 | 1.07e-03 | 27 |
| hsa0414523 | Cervix | HSIL_HPV | Phagosome | 27/459 | 152/8465 | 3.58e-08 | 1.50e-06 | 1.21e-06 | 27 |
| hsa0019024 | Cervix | HSIL_HPV | Oxidative phosphorylation | 25/459 | 134/8465 | 4.23e-08 | 1.55e-06 | 1.25e-06 | 25 |
| hsa0532322 | Cervix | HSIL_HPV | Rheumatoid arthritis | 16/459 | 93/8465 | 3.41e-05 | 5.26e-04 | 4.25e-04 | 16 |
| hsa051522 | Cervix | HSIL_HPV | Tuberculosis | 19/459 | 180/8465 | 3.99e-03 | 2.39e-02 | 1.93e-02 | 19 |
| hsa0414533 | Cervix | HSIL_HPV | Phagosome | 27/459 | 152/8465 | 3.58e-08 | 1.50e-06 | 1.21e-06 | 27 |
| hsa0019034 | Cervix | HSIL_HPV | Oxidative phosphorylation | 25/459 | 134/8465 | 4.23e-08 | 1.55e-06 | 1.25e-06 | 25 |
| hsa0532332 | Cervix | HSIL_HPV | Rheumatoid arthritis | 16/459 | 93/8465 | 3.41e-05 | 5.26e-04 | 4.25e-04 | 16 |
| hsa051523 | Cervix | HSIL_HPV | Tuberculosis | 19/459 | 180/8465 | 3.99e-03 | 2.39e-02 | 1.93e-02 | 19 |
| hsa0019020 | Endometrium | AEH | Oxidative phosphorylation | 69/1197 | 134/8465 | 5.80e-25 | 3.14e-23 | 2.30e-23 | 69 |
| hsa0414524 | Endometrium | AEH | Phagosome | 41/1197 | 152/8465 | 2.12e-05 | 2.22e-04 | 1.63e-04 | 41 |
| hsa0511018 | Endometrium | AEH | Vibrio cholerae infection | 18/1197 | 50/8465 | 9.09e-05 | 8.69e-04 | 6.36e-04 | 18 |
| hsa0532316 | Endometrium | AEH | Rheumatoid arthritis | 23/1197 | 93/8465 | 4.43e-03 | 2.46e-02 | 1.80e-02 | 23 |
| Page: 1 2 3 4 5 6 |
Top |
Cell-cell communication analysis |
| Identification of potential cell-cell interactions between two cell types and their ligand-receptor pairs for different disease states |
| Ligand | Receptor | LRpair | Pathway | Tissue | Disease Stage |
| Page: 1 |
Top |
Single-cell gene regulatory network inference analysis |
| Find out the significant the regulons (TFs) and the target genes of each regulon across cell types for different disease states |
| TF | Cell Type | Tissue | Disease Stage | Target Gene | RSS | Regulon Activity |
| ∗The dot plots of a searched regulon are shown for all cell subpopulations in each disease state of each tissue based on the regulon specific score inferred using pySCENIC and by calculating the average expression. |
| Page: 1 |
Top |
Somatic mutation of malignant transformation related genes |
| Annotation of somatic variants for genes involved in malignant transformation |
| Hugo Symbol | Variant Class | Variant Classification | dbSNP RS | HGVSc | HGVSp | HGVSp Short | SWISSPROT | BIOTYPE | SIFT | PolyPhen | Tumor Sample Barcode | Tissue | Histology | Sex | Age | Stage | Therapy Types | Drugs | Outcome |
| ATP6V0C | SNV | Missense_Mutation | novel | c.59N>T | p.Ser20Leu | p.S20L | P27449 | protein_coding | deleterious(0.01) | benign(0.005) | TCGA-AC-A5XS-01 | Breast | breast invasive carcinoma | Female | >=65 | I/II | Hormone Therapy | femara | SD |
| ATP6V0C | SNV | Missense_Mutation | novel | c.50N>C | p.Met17Thr | p.M17T | P27449 | protein_coding | tolerated(0.07) | benign(0.017) | TCGA-AA-A00N-01 | Colorectum | colon adenocarcinoma | Male | >=65 | I/II | Unknown | Unknown | PD |
| ATP6V0C | SNV | Missense_Mutation | c.181N>G | p.Met61Val | p.M61V | P27449 | protein_coding | deleterious(0) | probably_damaging(0.973) | TCGA-CM-5341-01 | Colorectum | colon adenocarcinoma | Female | >=65 | III/IV | Chemotherapy | fluorouracil | SD | |
| ATP6V0C | SNV | Missense_Mutation | novel | c.337N>A | p.Val113Met | p.V113M | P27449 | protein_coding | deleterious(0.02) | probably_damaging(0.969) | TCGA-A5-A0G2-01 | Endometrium | uterine corpus endometrioid carcinoma | Female | <65 | III/IV | Unknown | Unknown | SD |
| ATP6V0C | SNV | Missense_Mutation | c.377N>A | p.Arg126Gln | p.R126Q | P27449 | protein_coding | deleterious(0.03) | benign(0.037) | TCGA-BS-A0UM-01 | Endometrium | uterine corpus endometrioid carcinoma | Female | <65 | I/II | Chemotherapy | adriamycin | SD | |
| ATP6V0C | SNV | Missense_Mutation | novel | c.397N>A | p.Leu133Met | p.L133M | P27449 | protein_coding | deleterious(0) | possibly_damaging(0.816) | TCGA-DF-A2KU-01 | Endometrium | uterine corpus endometrioid carcinoma | Female | Unknown | I/II | Unknown | Unknown | SD |
| ATP6V0C | SNV | Missense_Mutation | novel | c.352G>A | p.Val118Met | p.V118M | P27449 | protein_coding | deleterious(0) | probably_damaging(0.984) | TCGA-EO-A22R-01 | Endometrium | uterine corpus endometrioid carcinoma | Female | <65 | I/II | Unknown | Unknown | SD |
| ATP6V0C | SNV | Missense_Mutation | c.196G>A | p.Ala66Thr | p.A66T | P27449 | protein_coding | deleterious(0.05) | probably_damaging(0.957) | TCGA-SJ-A6ZI-01 | Endometrium | uterine corpus endometrioid carcinoma | Female | <65 | I/II | Unknown | Unknown | SD | |
| ATP6V0C | SNV | Missense_Mutation | novel | c.107A>C | p.Lys36Thr | p.K36T | P27449 | protein_coding | deleterious(0) | benign(0.37) | TCGA-G3-AAV6-01 | Liver | liver hepatocellular carcinoma | Female | <65 | III/IV | Unknown | Unknown | PD |
| ATP6V0C | SNV | Missense_Mutation | c.148N>A | p.Glu50Lys | p.E50K | P27449 | protein_coding | deleterious(0) | possibly_damaging(0.672) | TCGA-55-6712-01 | Lung | lung adenocarcinoma | Male | >=65 | I/II | Chemotherapy | carboplatin | PD |
| Page: 1 2 |
Top |
Related drugs of malignant transformation related genes |
| Identification of chemicals and drugs interact with genes involved in malignant transfromation |
| (DGIdb 4.0) |
| Entrez ID | Symbol | Category | Interaction Types | Drug Claim Name | Drug Name | PMIDs |
| Page: 1 |

Copyright 2023-Present -The University of Texas Health Science Center at Houston |